Jefferson County Investment Properties for Sale
Browse homes for sale and investment properties in Jefferson County. Refine your search by price, property type, or more.
Best cash flowing properties in Jefferson County
Active
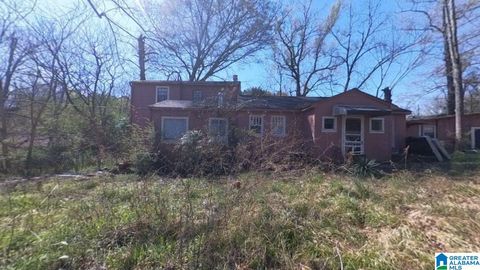
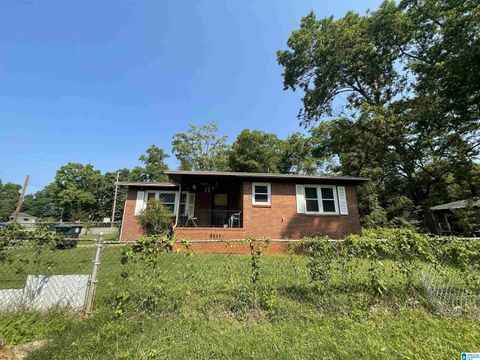
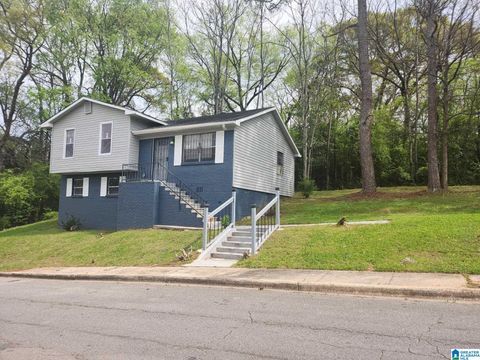
$39,900
3
bds
|
0
ba
|
1,460
sqft
|
built
1955
113 Mulberry Rd, Birmingham, AL 35214
$1,104
Cash flow
32.2%
Cash-on-Cash Return
33.2%
Cap rate
4.0%
Rent to Value Ratio
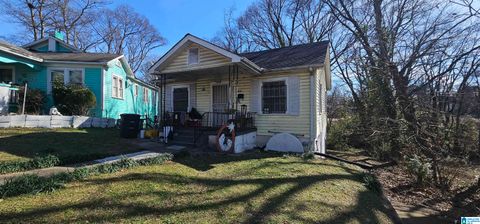
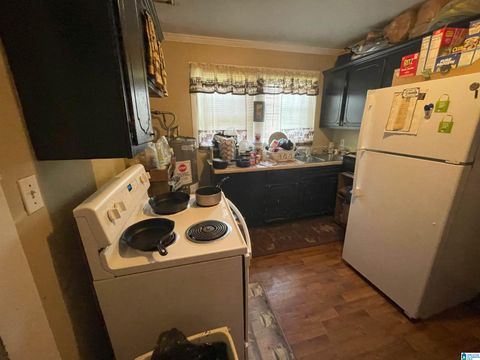
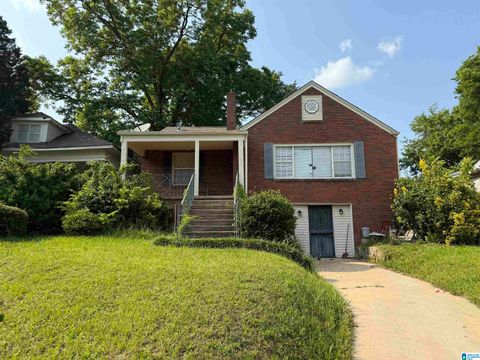
Active
$59,900
2
bds
|
0
ba
|
981
sqft
|
built
1940
4125 43rd Ave N, Birmingham, AL 35217
$828
Cash flow
16.1%
Cash-on-Cash Return
16.6%
Cap rate
2.0%
Rent to Value Ratio
1,459 out of 2,194 properties for sale in Jefferson County
Limited Results Shown
Create a free account, or log in to reveal all property listings and enjoy the complete experience.

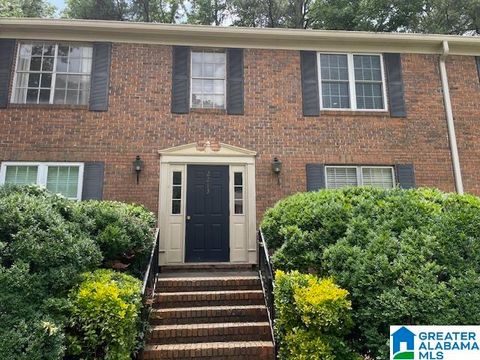
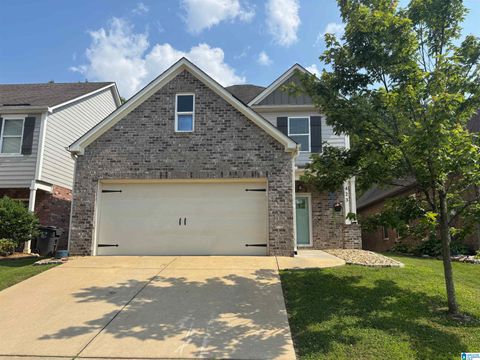
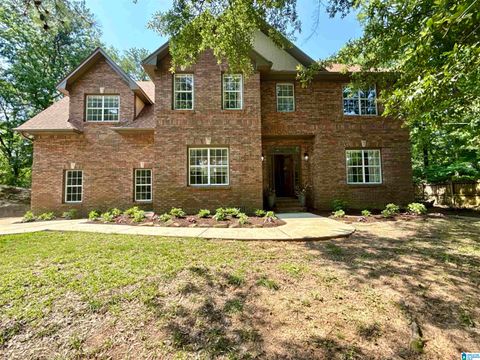
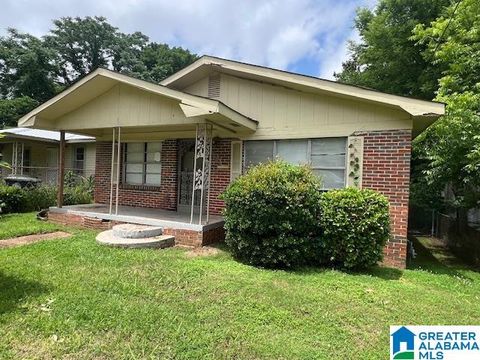
Active
$775,000
4
bds
|
0
ba
|
2,880
sqft
|
built
2016
626 Preserve Pkwy, Hoover, AL 35226
$-1,946
Cash flow
-13.1%
Cash-on-Cash Return
3.3%
Cap rate
0.4%
Rent to Value Ratio

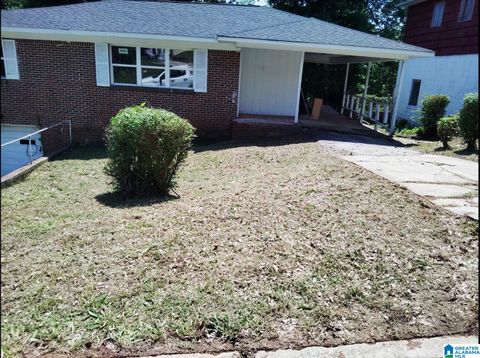
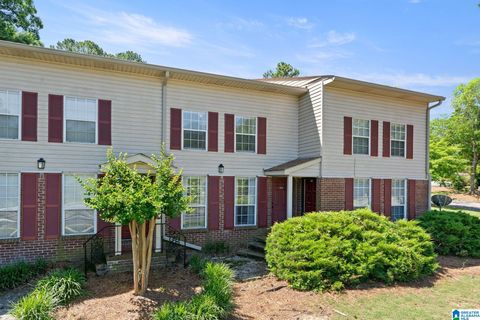
Active
$249,900
3
bds
|
0
ba
|
1,408
sqft
|
built
2005
2332 Ridgemont Dr, Birmingham, AL 35244
$-84
Cash flow
-1.8%
Cash-on-Cash Return
5.9%
Cap rate
0.7%
Rent to Value Ratio
Active
$174,900
2
bds
|
0
ba
|
1,085
sqft
|
built
1967
2213 Montreat Cir, Vestavia Hills, AL 35216
$53
Cash flow
1.6%
Cash-on-Cash Return
6.6%
Cap rate
0.8%
Rent to Value Ratio
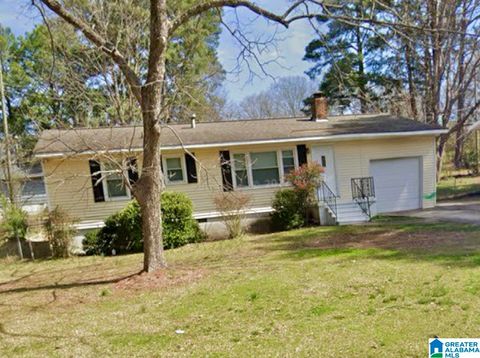
Active
$149,900
3
bds
|
0
ba
|
1,036
sqft
|
built
1959
732 84th St S, Birmingham, AL 35206
$45
Cash flow
1.6%
Cash-on-Cash Return
6.6%
Cap rate
0.8%
Rent to Value Ratio

Active
$400,000
4
bds
|
0
ba
|
2,815
sqft
|
built
1995
6391 Harness Way, Pinson, AL 35126
$-511
Cash flow
-6.7%
Cash-on-Cash Return
4.7%
Cap rate
0.6%
Rent to Value Ratio

Active
$230,000
4
bds
|
0
ba
|
2,361
sqft
|
built
2014
4664 Deer Foot Path, Pinson, AL 35126
$16
Cash flow
0.4%
Cash-on-Cash Return
6.3%
Cap rate
0.8%
Rent to Value Ratio
Active
$449,000
3
bds
|
0
ba
|
2,175
sqft
|
built
1987
2584 Crossgate Pl, Vestavia Hills, AL 35216
$-445
Cash flow
-5.2%
Cash-on-Cash Return
5.1%
Cap rate
0.6%
Rent to Value Ratio
Active
$159,900
3
bds
|
0
ba
|
1,960
sqft
|
built
1955
517 22nd St SW, Birmingham, AL 35211
$407
Cash flow
13.3%
Cash-on-Cash Return
9.3%
Cap rate
1.1%
Rent to Value Ratio
Active
$245,000
2
bds
|
0
ba
|
891
sqft
|
built
1955
4759 7th Ct S, Birmingham, AL 35222
$-37
Cash flow
-0.8%
Cash-on-Cash Return
6.1%
Cap rate
0.7%
Rent to Value Ratio
Active
$79,900
4
bds
|
0
ba
|
1,500
sqft
|
built
1971
405 Nevada St, Birmingham, AL 35224
$342
Cash flow
22.3%
Cash-on-Cash Return
11.4%
Cap rate
1.4%
Rent to Value Ratio

Active
$675,000
5
bds
|
0
ba
|
4,739
sqft
|
built
2005
1415 Scout Ridge Dr, Hoover, AL 35244
$-1,172
Cash flow
-9.1%
Cash-on-Cash Return
4.2%
Cap rate
0.5%
Rent to Value Ratio
Active
$75,000
3
bds
|
0
ba
|
1,649
sqft
|
built
1962
5624 Margaret Ave, Birmingham, AL 35221
$505
Cash flow
35.1%
Cash-on-Cash Return
14.4%
Cap rate
1.7%
Rent to Value Ratio
Active
$39,900
3
bds
|
0
ba
|
1,460
sqft
|
built
1955
113 Mulberry Rd, Birmingham, AL 35214
$1,104
Cash flow
32.2%
Cash-on-Cash Return
33.2%
Cap rate
4.0%
Rent to Value Ratio

Active
$499,000
5
bds
|
0
ba
|
3,729
sqft
|
built
2006
379 Barrington Ct, Irondale, AL 35210
$-495
Cash flow
-5.2%
Cash-on-Cash Return
5.1%
Cap rate
0.6%
Rent to Value Ratio
Active
$299,900
3
bds
|
0
ba
|
1,794
sqft
|
built
2015
423 W Park Dr, Fultondale, AL 35068
$-88
Cash flow
-1.5%
Cash-on-Cash Return
5.9%
Cap rate
0.7%
Rent to Value Ratio
Active
$169,900
3
bds
|
0
ba
|
1,485
sqft
|
built
1939
1636 33rd St SW, Birmingham, AL 35221
$79
Cash flow
2.4%
Cash-on-Cash Return
6.8%
Cap rate
0.8%
Rent to Value Ratio

Active
$1,695,000
3
bds
|
0
ba
|
4,575
sqft
|
built
1935
2005 Warwick Ct, Birmingham, AL 35209
$-6,365
Cash flow
-19.6%
Cash-on-Cash Return
1.8%
Cap rate
0.2%
Rent to Value Ratio
Active
$175,000
2
bds
|
0
ba
|
1,512
sqft
|
built
1970
1665 Patton Chapel Rd, Hoover, AL 35226
$190
Cash flow
5.7%
Cash-on-Cash Return
7.6%
Cap rate
0.9%
Rent to Value Ratio
Active
$150,000
2
bds
|
0
ba
|
2,174
sqft
|
built
1925
1100 16th St SW, Birmingham, AL 35211
$183
Cash flow
6.4%
Cash-on-Cash Return
7.7%
Cap rate
0.9%
Rent to Value Ratio
Active
$275,000
3
bds
|
0
ba
|
1,560
sqft
|
built
2004
5397 Summerset Way, Bessemer, AL 35022
$-73
Cash flow
-1.4%
Cash-on-Cash Return
5.9%
Cap rate
0.7%
Rent to Value Ratio
Active
$307,500
3
bds
|
0
ba
|
2,048
sqft
|
built
1999
7721 Clayton Cove Pkwy, Pinson, AL 35126
$-43
Cash flow
-0.7%
Cash-on-Cash Return
6.1%
Cap rate
0.7%
Rent to Value Ratio

Active
$219,900
3
bds
|
0
ba
|
1,235
sqft
|
built
1941
220 Honeysuckle Ln, Gardendale, AL 35071
$-182
Cash flow
-4.3%
Cash-on-Cash Return
5.3%
Cap rate
0.6%
Rent to Value Ratio
Active
$559,000
6
bds
|
0
ba
|
4,158
sqft
|
built
1990
103 Red Maple Ln, Trussville, AL 35173
$-800
Cash flow
-7.5%
Cash-on-Cash Return
4.5%
Cap rate
0.6%
Rent to Value Ratio
Active
$495,000
4
bds
|
0
ba
|
2,782
sqft
|
built
1993
3518 Wynwood Dr, Birmingham, AL 35210
$-583
Cash flow
-6.1%
Cash-on-Cash Return
4.9%
Cap rate
0.6%
Rent to Value Ratio
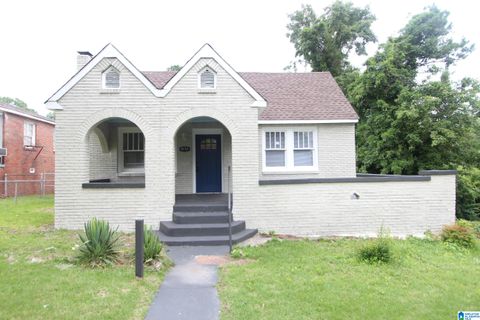
Active
$59,900
2
bds
|
0
ba
|
981
sqft
|
built
1940
4125 43rd Ave N, Birmingham, AL 35217
$828
Cash flow
16.1%
Cash-on-Cash Return
16.6%
Cap rate
2.0%
Rent to Value Ratio
Active
$64,000
2
bds
|
0
ba
|
900
sqft
|
built
1930
5409 Court G, Fairfield, AL 35064
$621
Cash flow
11.3%
Cash-on-Cash Return
11.6%
Cap rate
1.4%
Rent to Value Ratio
Active
$160,000
4
bds
|
0
ba
|
2,058
sqft
|
built
1970
2509 Bow String Dr, Birmingham, AL 35214
$269
Cash flow
8.8%
Cash-on-Cash Return
8.3%
Cap rate
1.0%
Rent to Value Ratio
Active
$89,900
3
bds
|
0
ba
|
1,159
sqft
|
built
1956
9809 Red Mill Rd, Birmingham, AL 35215
$428
Cash flow
24.8%
Cash-on-Cash Return
12.0%
Cap rate
1.4%
Rent to Value Ratio
Active
$140,000
4
bds
|
0
ba
|
1,976
sqft
|
built
1935
8300 7th Ter S, Birmingham, AL 35206
$235
Cash flow
8.8%
Cash-on-Cash Return
8.3%
Cap rate
1.0%
Rent to Value Ratio
Active
$475,000
5
bds
|
0
ba
|
2,724
sqft
|
built
1920
1710 Cullom St S, Birmingham, AL 35205
$-548
Cash flow
-6.0%
Cash-on-Cash Return
4.9%
Cap rate
0.6%
Rent to Value Ratio
Active
$599,900
4
bds
|
0
ba
|
3,285
sqft
|
built
1976
3258 Tyrol Ln, Vestavia Hills, AL 35216
$-924
Cash flow
-8.0%
Cash-on-Cash Return
4.4%
Cap rate
0.5%
Rent to Value Ratio
Active
$210,000
4
bds
|
0
ba
|
1,272
sqft
|
built
1932
539 63rd St S, Birmingham, AL 35212
$146
Cash flow
3.6%
Cash-on-Cash Return
7.1%
Cap rate
0.9%
Rent to Value Ratio

Active
$185,000
3
bds
|
0
ba
|
2,506
sqft
|
built
1968
635 16th Ter NW, Center Point, AL 35215
$0
Cash flow
0.0%
Cash-on-Cash Return
6.3%
Cap rate
0.8%
Rent to Value Ratio
Active
$165,000
1
bds
|
0
ba
|
276
sqft
|
built
1887
2015 1st Ave N, Birmingham, AL 35203
$91
Cash flow
2.9%
Cash-on-Cash Return
6.9%
Cap rate
0.9%
Rent to Value Ratio

Active
$529,900
5
bds
|
0
ba
|
3,101
sqft
|
built
1998
4728 Red Leaf Cir, Hoover, AL 35226
$-681
Cash flow
-6.7%
Cash-on-Cash Return
4.7%
Cap rate
0.6%
Rent to Value Ratio

Active
$499,900
4
bds
|
0
ba
|
2,120
sqft
|
built
2014
4240 Cahaba Bnd, Trussville, AL 35173
$-695
Cash flow
-7.3%
Cash-on-Cash Return
4.6%
Cap rate
0.6%
Rent to Value Ratio
Active
$130,000
3
bds
|
0
ba
|
1,286
sqft
|
built
1970
2125 Henry Crumpton Dr, Birmingham, AL 35211
$218
Cash flow
8.7%
Cash-on-Cash Return
8.3%
Cap rate
1.0%
Rent to Value Ratio
Active
$105,000
3
bds
|
0
ba
|
1,524
sqft
|
built
1939
4016 39th Ct N, Birmingham, AL 35217
$349
Cash flow
17.3%
Cash-on-Cash Return
10.3%
Cap rate
1.2%
Rent to Value Ratio
Active
$99,900
5
bds
|
0
ba
|
2,896
sqft
|
built
1940
2304 Mayfield Ave SW, Birmingham, AL 35211
$513
Cash flow
26.8%
Cash-on-Cash Return
12.4%
Cap rate
1.5%
Rent to Value Ratio
Active
$279,000
3
bds
|
0
ba
|
2,208
sqft
|
built
1993
1805 Petticoat Way, Birmingham, AL 35215
$-353
Cash flow
-6.6%
Cash-on-Cash Return
4.7%
Cap rate
0.6%
Rent to Value Ratio