Antioch, IL Investment Properties for Sale
Browse homes for sale and investment properties in Antioch, IL. Refine your search by price, property type, or more.
Best cash flowing properties in Antioch, IL
Active
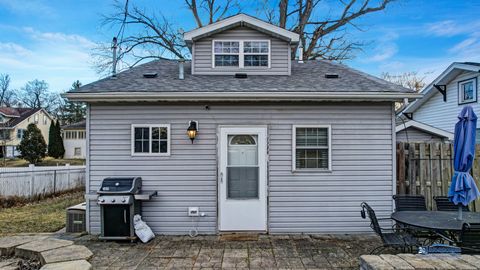
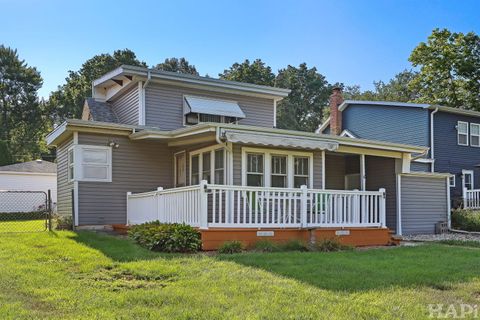
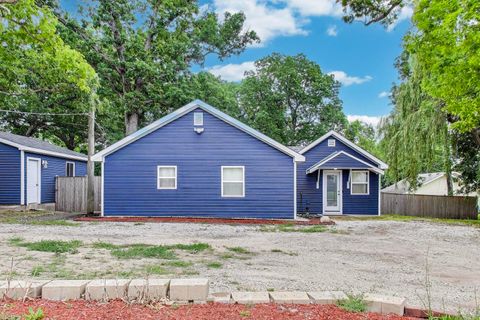
$225,000
3
bds
|
1
ba
|
1,025
sqft
|
built
1965
43247 N Grandview Ter, Antioch, IL 60002
$52
Cash flow
1.2%
Cash-on-Cash Return
6.0%
Cap rate
1.0%
Rent to Value Ratio
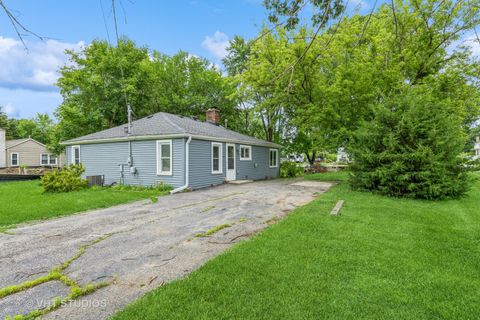
Active
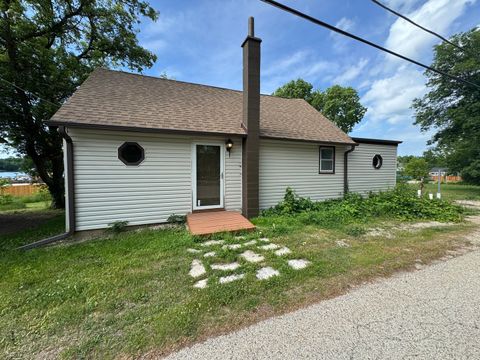
$189,999
2
bds
|
1
ba
|
1,050
sqft
|
built
1957
42309 N Woodbine Ave, Antioch, IL 60002
$-2
Cash flow
-0.1%
Cash-on-Cash Return
5.7%
Cap rate
0.9%
Rent to Value Ratio
20 out of 27 properties for sale in Antioch, IL
Limited Results Shown
Create a free account, or log in to reveal all property listings and enjoy the complete experience.
Active
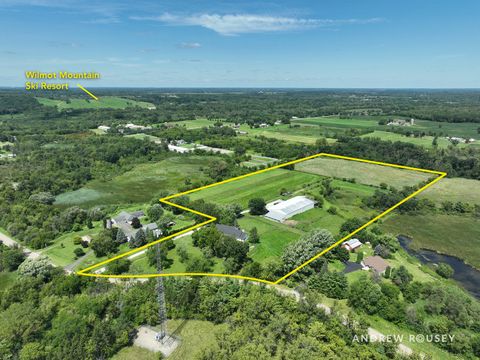
$1,850,000
3
bds
|
5
ba
|
5,303
sqft
|
built
1989
27490 W Wilmot Rd, Antioch, IL 60002
$-5,450
Cash flow
-15.4%
Cash-on-Cash Return
2.1%
Cap rate
0.4%
Rent to Value Ratio
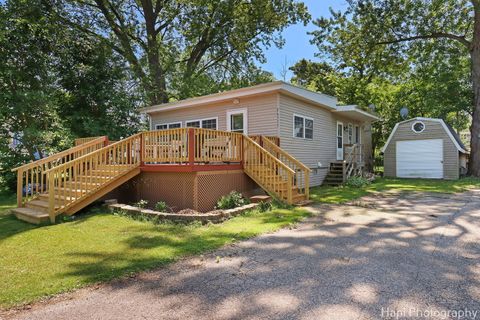
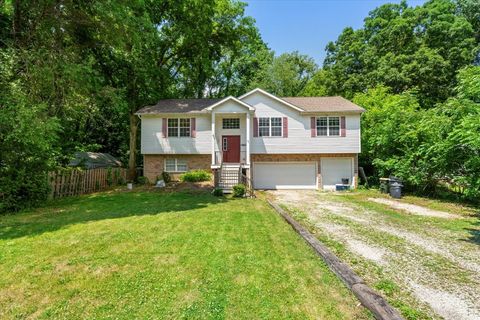
Active
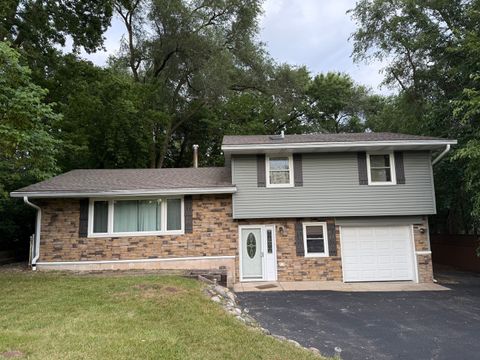
$289,900
3
bds
|
2
ba
|
1,320
sqft
|
built
1970
26307 W Grass Lake Rd, Antioch, IL 60002
$-69
Cash flow
-1.2%
Cash-on-Cash Return
5.4%
Cap rate
0.9%
Rent to Value Ratio
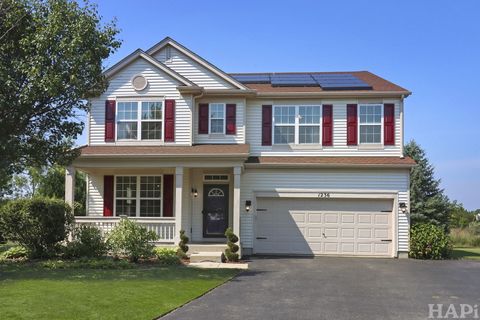
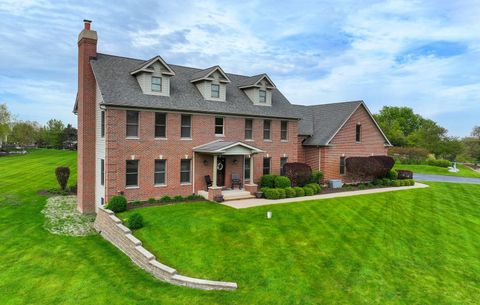
Active
$399,900
4
bds
|
4
ba
|
2,576
sqft
|
built
2004
1236 Kathleen Ct, Antioch, IL 60002
$-989
Cash flow
-12.9%
Cash-on-Cash Return
2.7%
Cap rate
0.8%
Rent to Value Ratio
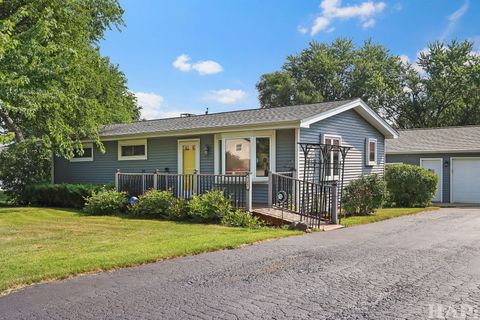
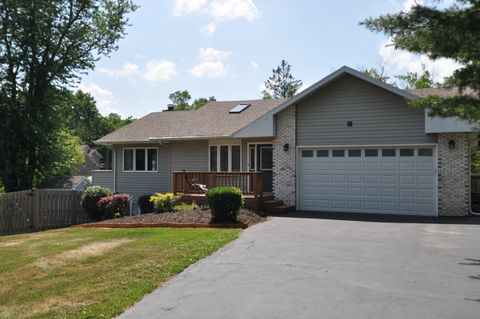
Active
$274,900
3
bds
|
2
ba
|
1,200
sqft
|
built
1960
41097 N Julia Ct, Antioch, IL 60002
$-118
Cash flow
-2.2%
Cash-on-Cash Return
5.2%
Cap rate
0.8%
Rent to Value Ratio
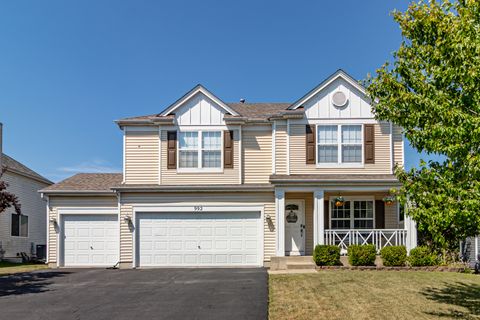
Active
$379,000
4
bds
|
4
ba
|
2,232
sqft
|
built
2005
992 Neuhaven Dr, Antioch, IL 60002
$-964
Cash flow
-13.3%
Cash-on-Cash Return
2.6%
Cap rate
0.7%
Rent to Value Ratio
Active
$399,900
5
bds
|
4
ba
|
3,098
sqft
|
built
1992
1196 Edgewater Ln, Antioch, IL 60002
$-553
Cash flow
-7.2%
Cash-on-Cash Return
4.0%
Cap rate
0.8%
Rent to Value Ratio
Active
$381,900
2
bds
|
1
ba
|
1,161
sqft
|
built
1950
38410 N Lakeside Pl, Antioch, IL 60002
$-836
Cash flow
-11.4%
Cash-on-Cash Return
3.1%
Cap rate
0.6%
Rent to Value Ratio
Active
$331,000
2
bds
|
1
ba
|
1,617
sqft
|
built
1955
26177 W Heart O Lakes Blvd, Antioch, IL 60002
$-391
Cash flow
-6.2%
Cash-on-Cash Return
4.3%
Cap rate
0.8%
Rent to Value Ratio
Active
$279,900
3
bds
|
1
ba
|
1,120
sqft
|
built
1970
26377 W Marie Ave, Antioch, IL 60002
$-552
Cash flow
-10.3%
Cash-on-Cash Return
3.3%
Cap rate
0.6%
Rent to Value Ratio
Active
$737,000
4
bds
|
4
ba
|
6,500
sqft
|
built
2008
575 Hidden Creek Dr, Antioch, IL 60002
$-2,105
Cash flow
-14.9%
Cash-on-Cash Return
2.3%
Cap rate
0.6%
Rent to Value Ratio
Active
$295,000
3
bds
|
2
ba
|
1,189
sqft
|
built
1965
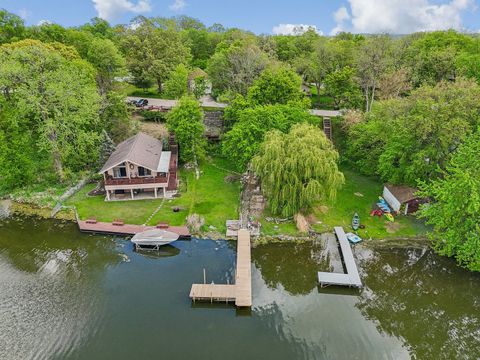
43173 N Lake Ave, Antioch, IL 60002
$-419
Cash flow
-7.4%
Cash-on-Cash Return
4.0%
Cap rate
0.7%
Rent to Value Ratio
Active
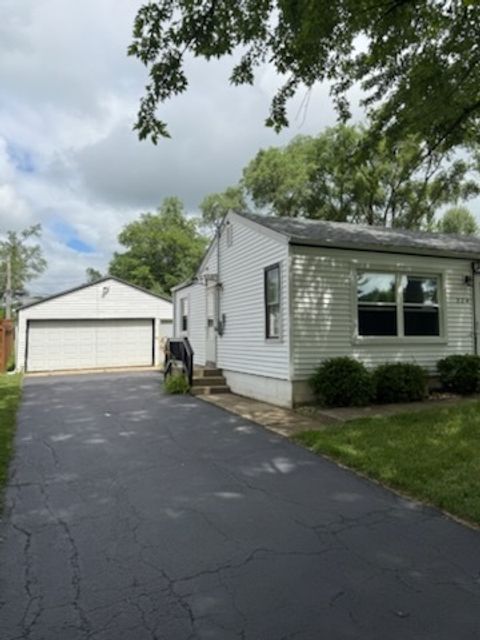
$205,000
2
bds
|
1
ba
|
744
sqft
|
built
1957
324 Elmwood Ln, Antioch, IL 60002
$-347
Cash flow
-8.8%
Cash-on-Cash Return
3.6%
Cap rate
0.7%
Rent to Value Ratio
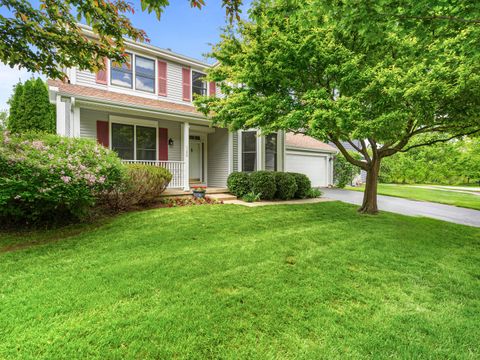
Active
$329,000
3
bds
|
3
ba
|
2,220
sqft
|
built
2010
25612 W Woodlawn Ave, Antioch, IL 60002
$-433
Cash flow
-6.9%
Cash-on-Cash Return
4.1%
Cap rate
0.9%
Rent to Value Ratio
Active
$424,900
4
bds
|
3
ba
|
2,532
sqft
|
built
1990
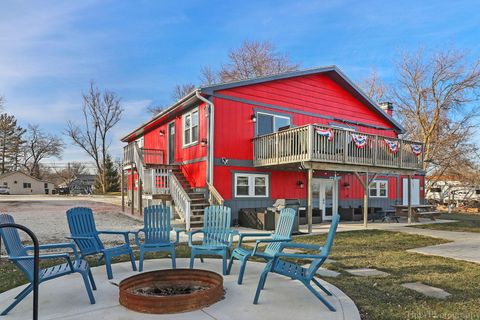
42220 N Center St, Antioch, IL 60002
$-83
Cash flow
-1.0%
Cash-on-Cash Return
5.4%
Cap rate
0.7%
Rent to Value Ratio
Active
$339,000
2
bds
|
1
ba
|
960
sqft
|
built
1960
26211 W Spring Grove Rd, Antioch, IL 60002
$-781
Cash flow
-12.0%
Cash-on-Cash Return
2.9%
Cap rate
0.7%
Rent to Value Ratio
Active
$1,175,000
5
bds
|
4
ba
|
0
sqft
|
built
1978
26048 W Forest Ave, Antioch, IL 60002
$-3,616
Cash flow
-16.1%
Cash-on-Cash Return
2.0%
Cap rate
0.4%
Rent to Value Ratio
Active
$420,000
3
bds
|
2
ba
|
1,400
sqft
|
built
1910
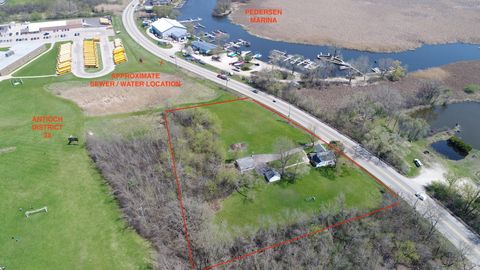
24816 W Il Route 173, Antioch, IL 60002
$-692
Cash flow
-8.6%
Cash-on-Cash Return
3.7%
Cap rate
0.7%
Rent to Value Ratio

Active
$775,000
2
bds
|
1
ba
|
4,730
sqft
|
built
1907
17049 W Edwards Rd, Antioch, IL 60002
$-1,545
Cash flow
-10.4%
Cash-on-Cash Return
3.3%
Cap rate
0.5%
Rent to Value Ratio