Baton Rouge, LA Investment Properties for Sale
Browse homes for sale and investment properties in Baton Rouge, LA. Refine your search by price, property type, or more.
Best cash flowing properties in Baton Rouge, LA

Active
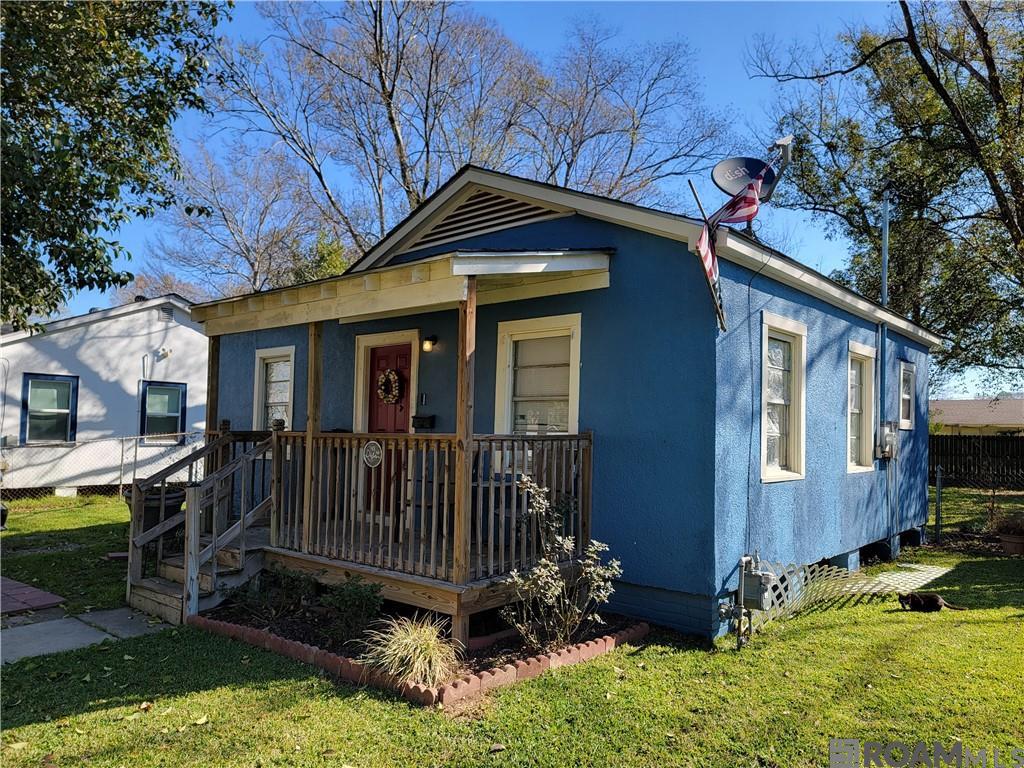
$59,900
2
bds
|
1
ba
|
730
sqft
|
built
1968
3423 Seneca St, Baton Rouge, LA 70805
$828
Cash flow
16.1%
Cash-on-Cash Return
16.6%
Cap rate
2.0%
Rent to Value Ratio

Active
$43,000
2
bds
|
1
ba
|
784
sqft
|
built
1960
4261 Gurney St, Baton Rouge, LA 70805
$690
Cash flow
18.7%
Cash-on-Cash Return
19.3%
Cap rate
2.3%
Rent to Value Ratio
986 out of 1,271 properties for sale in Baton Rouge, LA
Limited Results Shown
Create a free account, or log in to reveal all property listings and enjoy the complete experience.
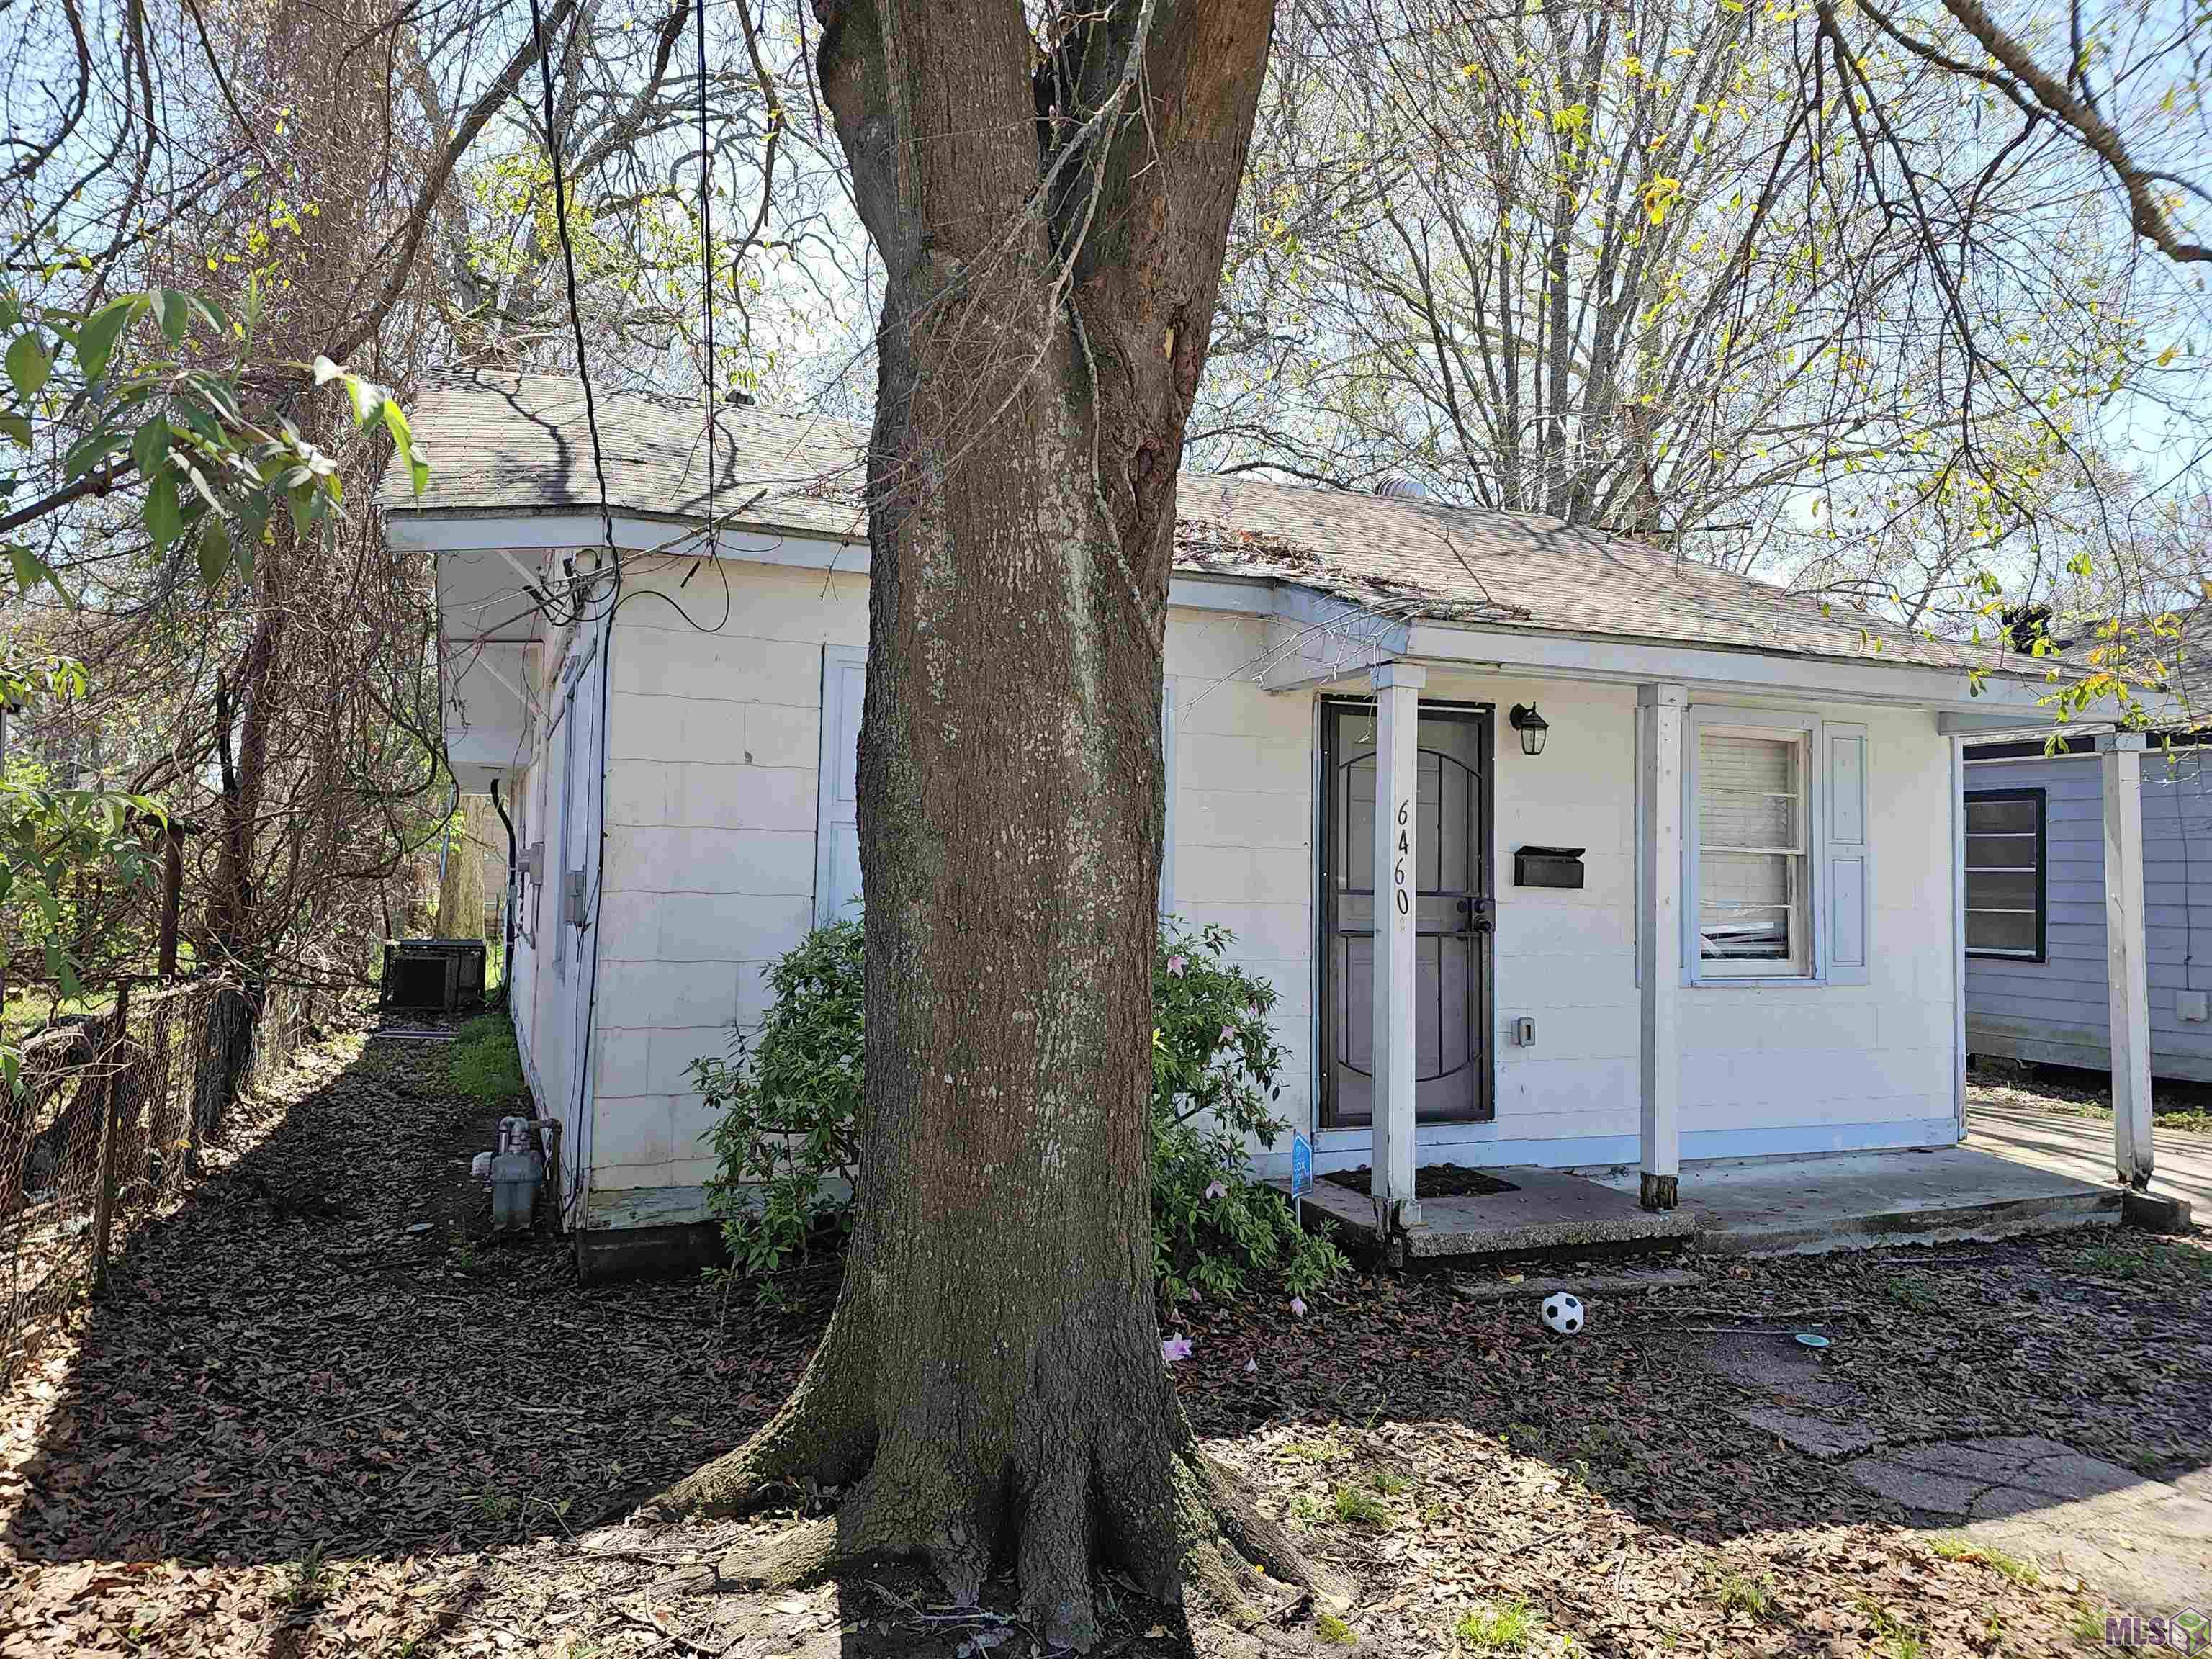
Active
$80,000
3
bds
|
2
ba
|
1,214
sqft
|
built
1970
6460 Underwood Ave, Baton Rouge, LA 70805
$380
Cash flow
24.8%
Cash-on-Cash Return
11.4%
Cap rate
1.4%
Rent to Value Ratio
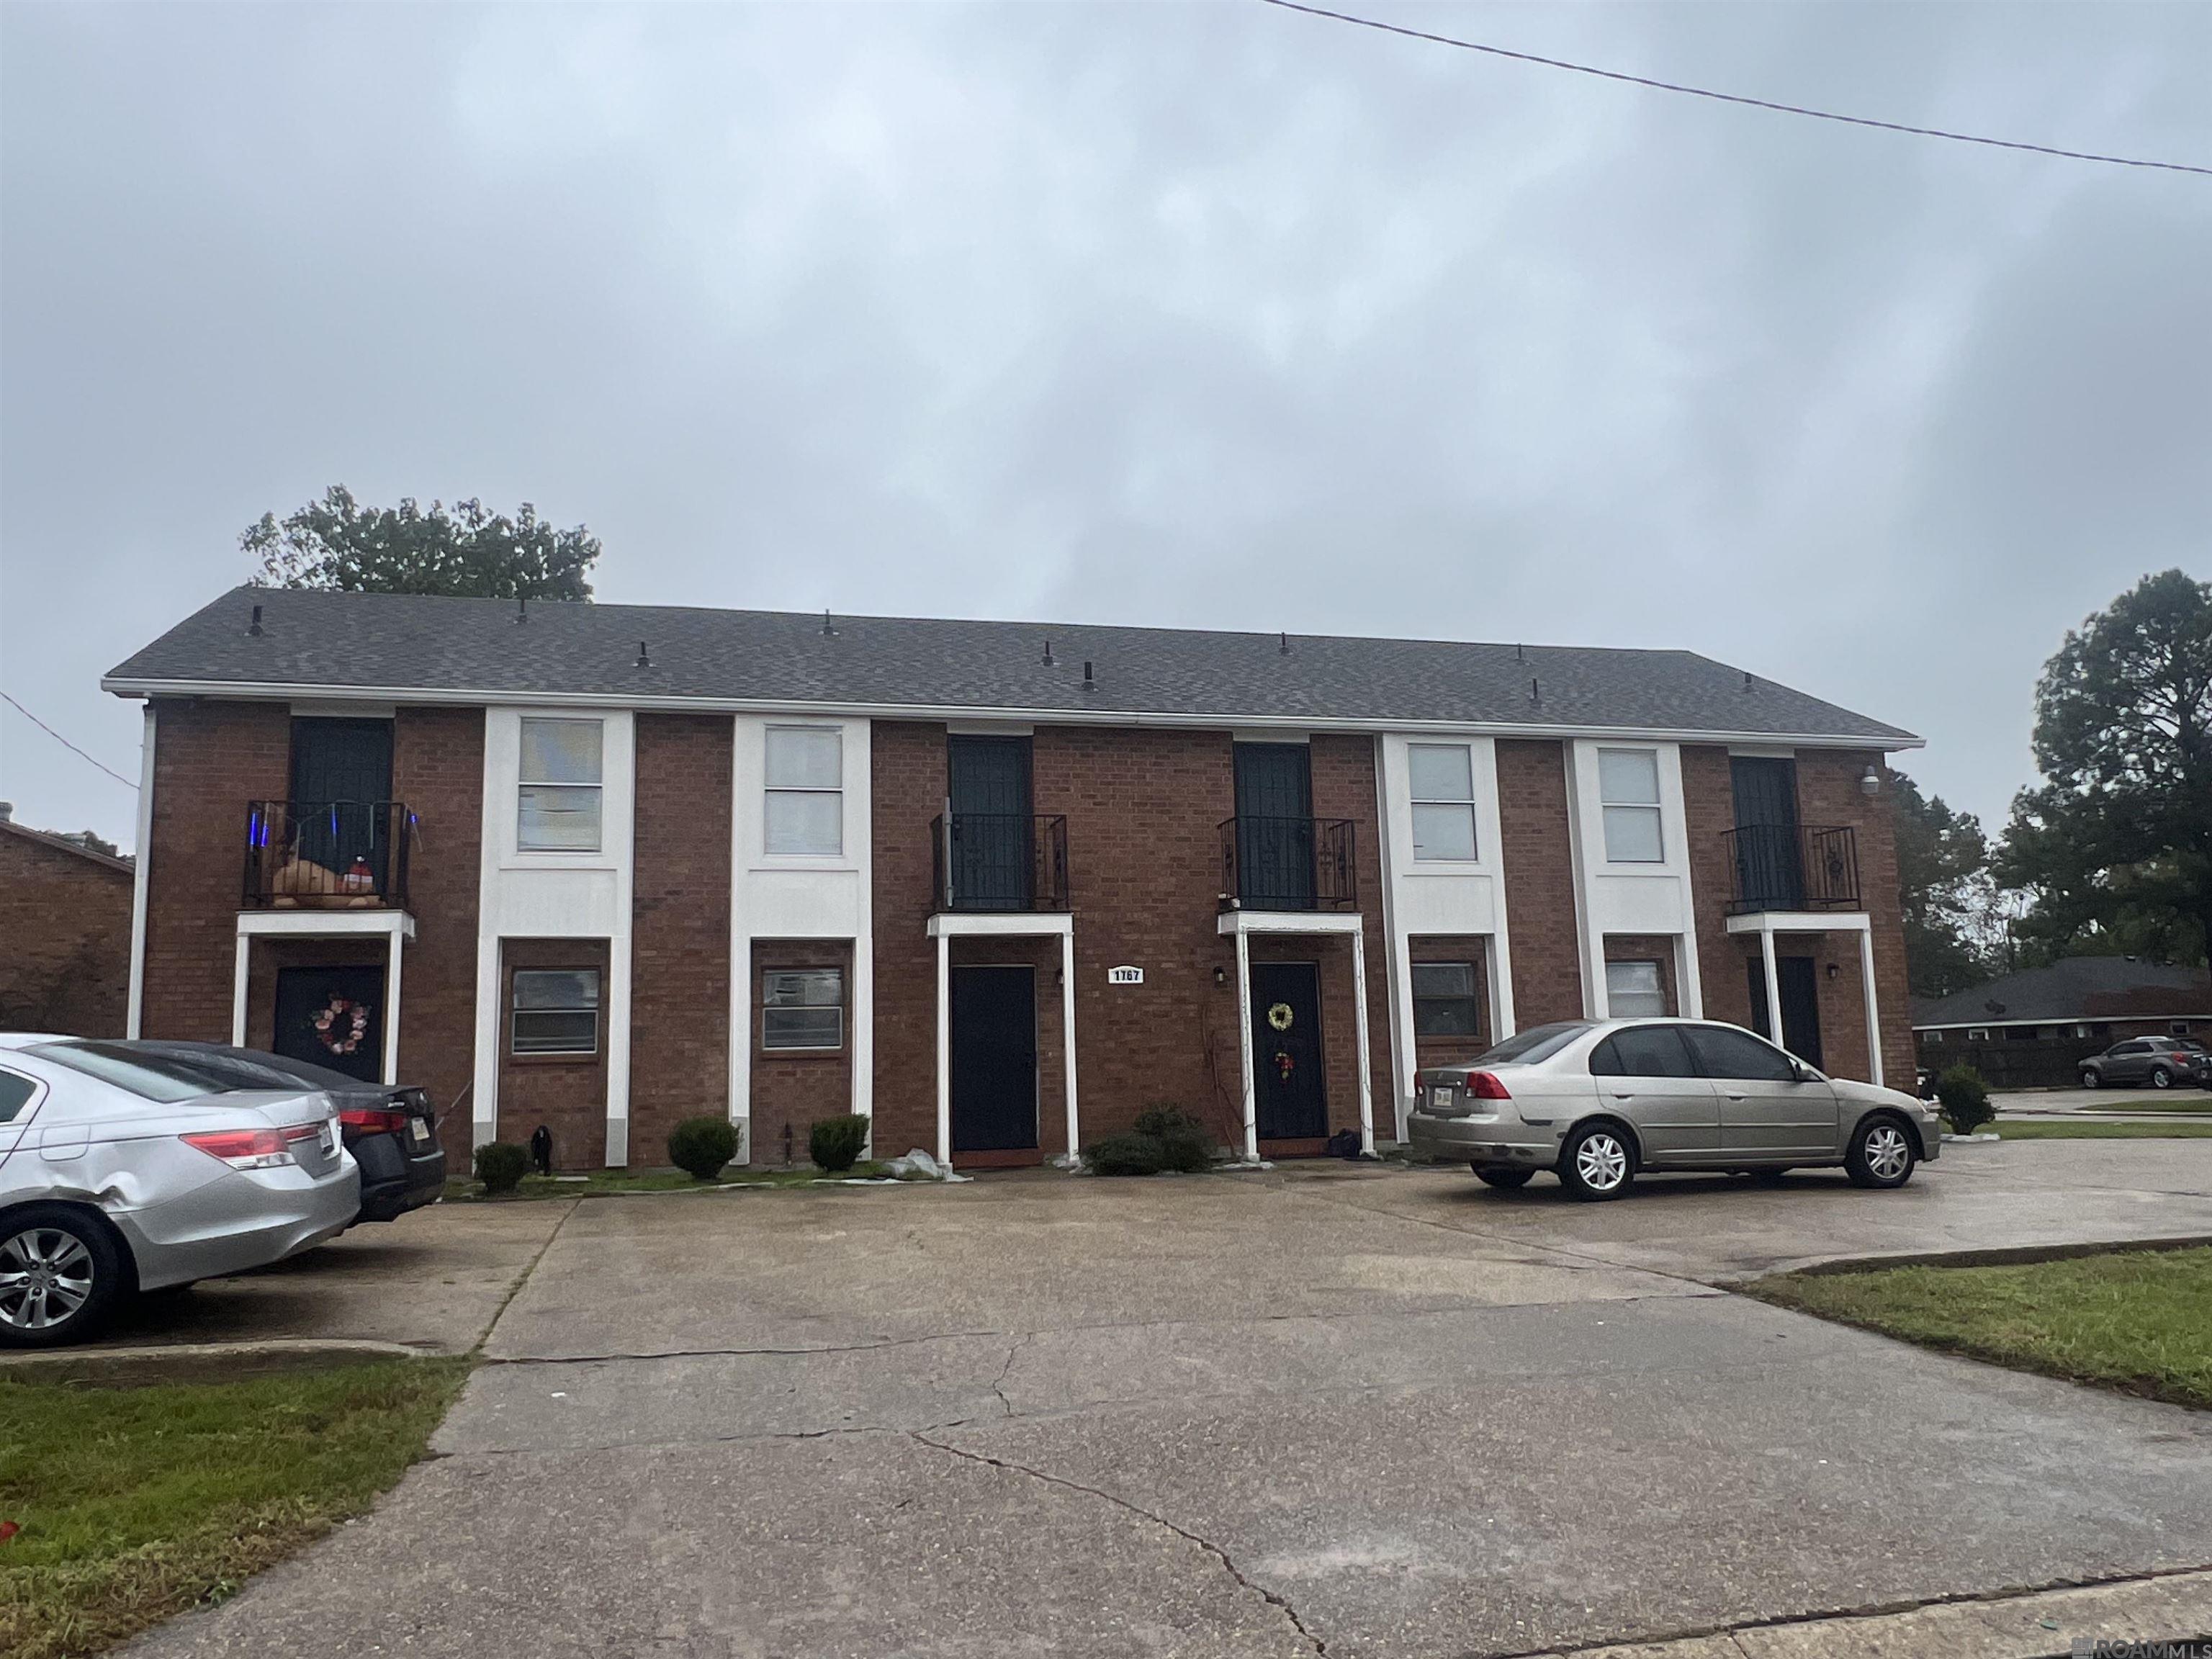
Active
$315,000
bds
|
0
ba
|
4,200
sqft
|
built
1979
1767 Port Dr, Baton Rouge, LA 70820
$234
Cash flow
3.9%
Cash-on-Cash Return
6.6%
Cap rate
0.8%
Rent to Value Ratio
Active
$69,000
3
bds
|
1
ba
|
1,140
sqft
|
built
1960
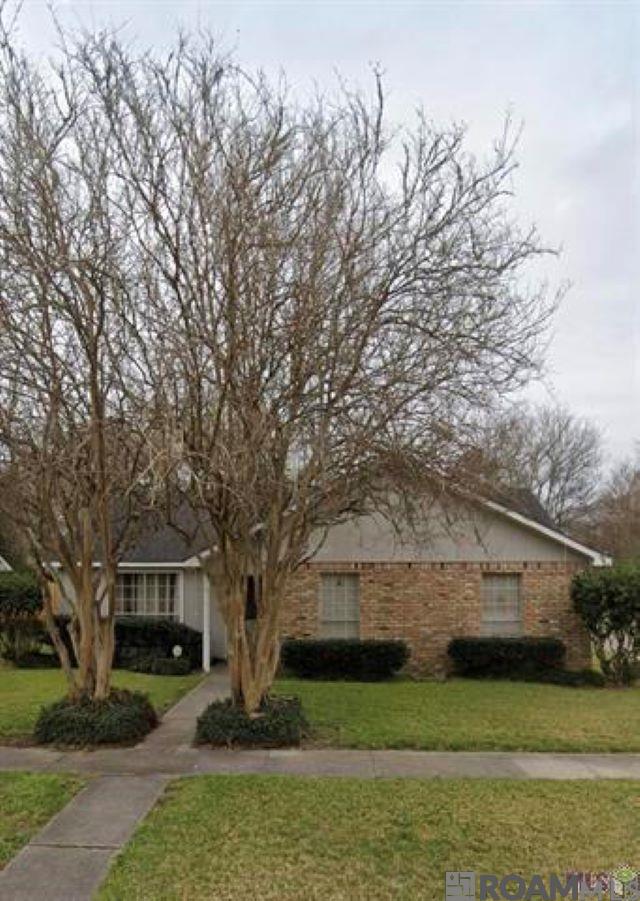
249 N 26th St, Baton Rouge, LA 70806
$690
Cash flow
11.7%
Cash-on-Cash Return
12.0%
Cap rate
1.4%
Rent to Value Ratio
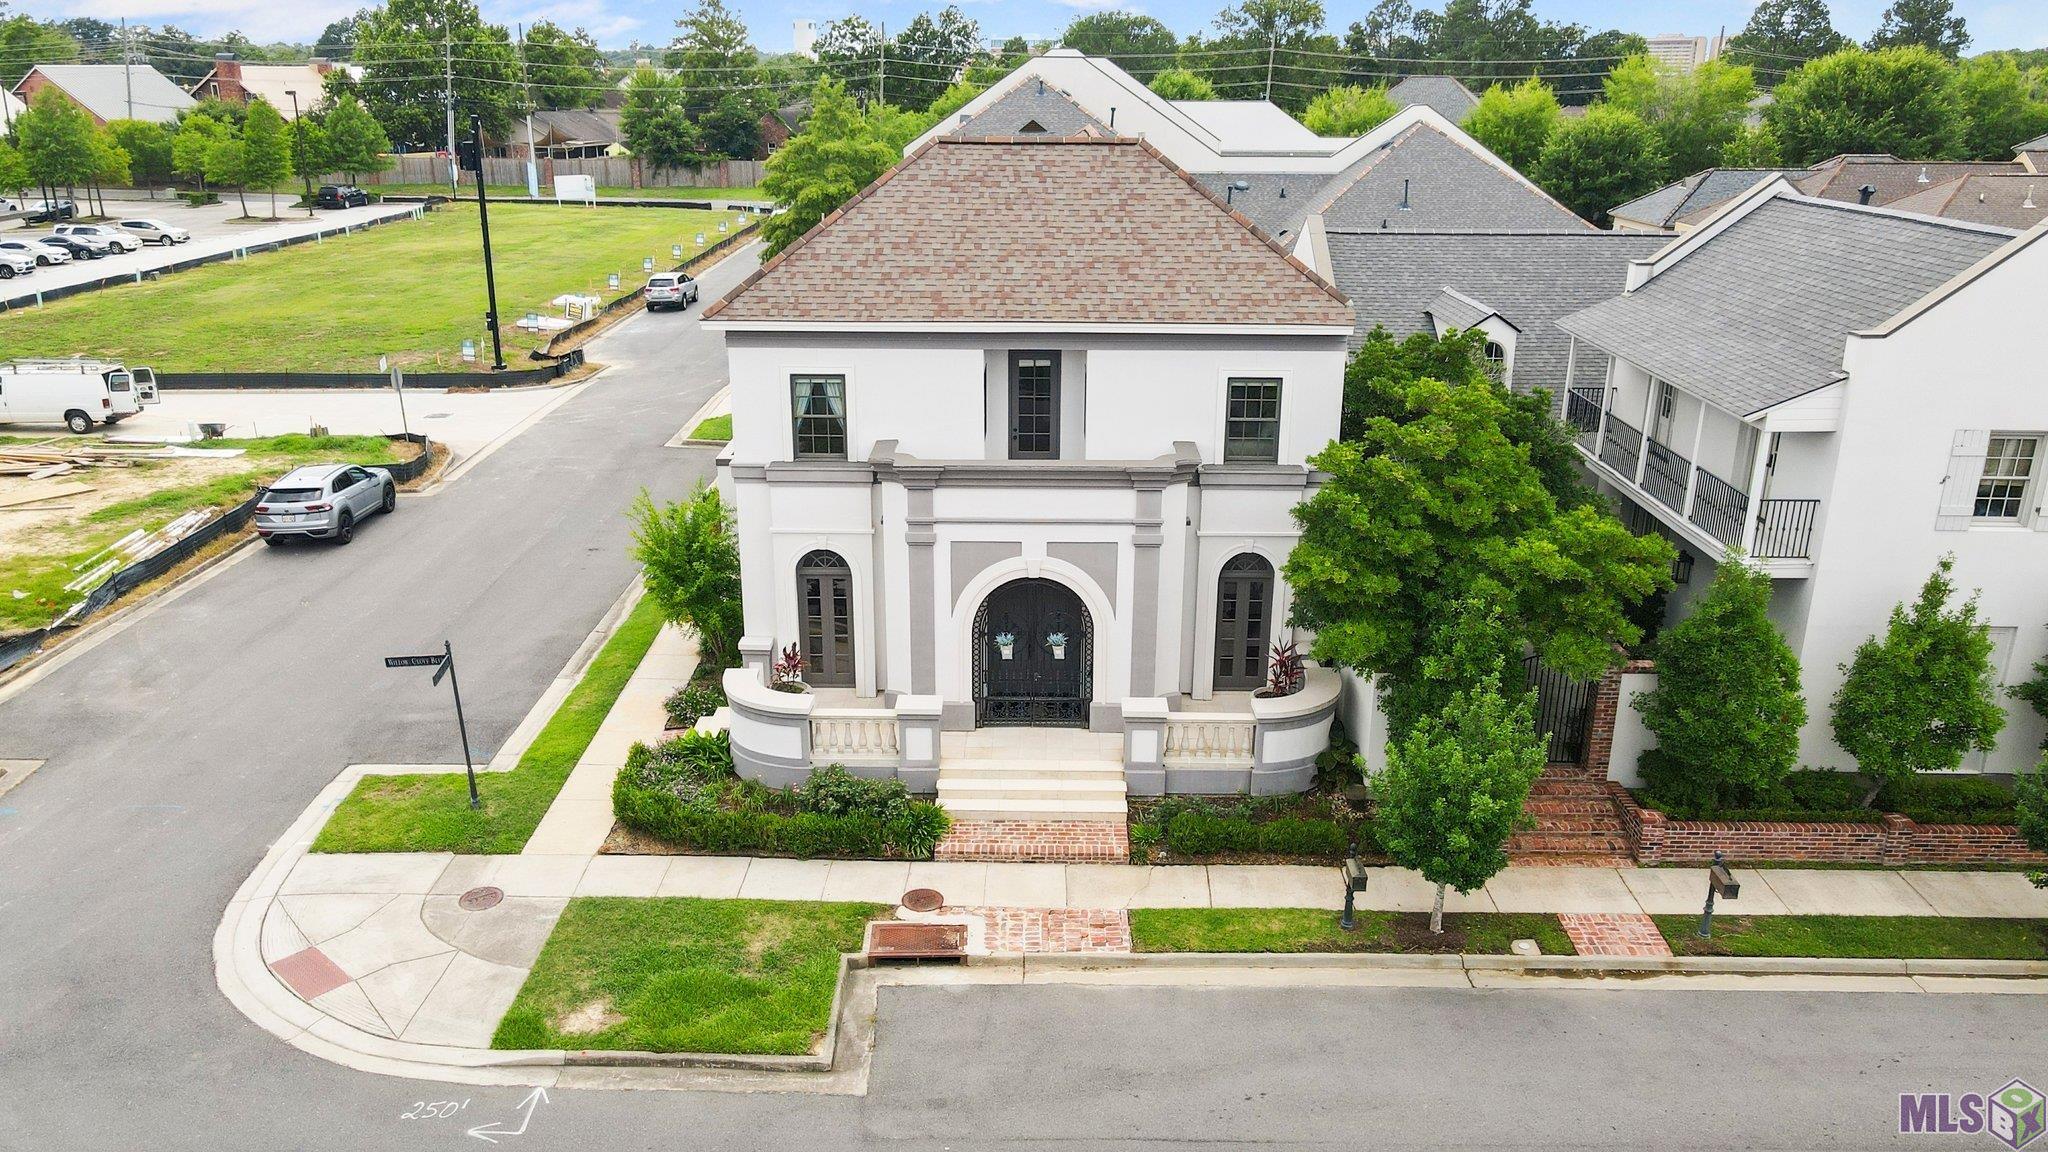
Active
$750,000
3
bds
|
3
ba
|
3,201
sqft
|
built
2016
8164 Willow Grove Blvd, Baton Rouge, LA 70810
$-845
Cash flow
-5.9%
Cash-on-Cash Return
4.3%
Cap rate
0.5%
Rent to Value Ratio
Active
$79,550
2
bds
|
1
ba
|
812
sqft
|
built
1947
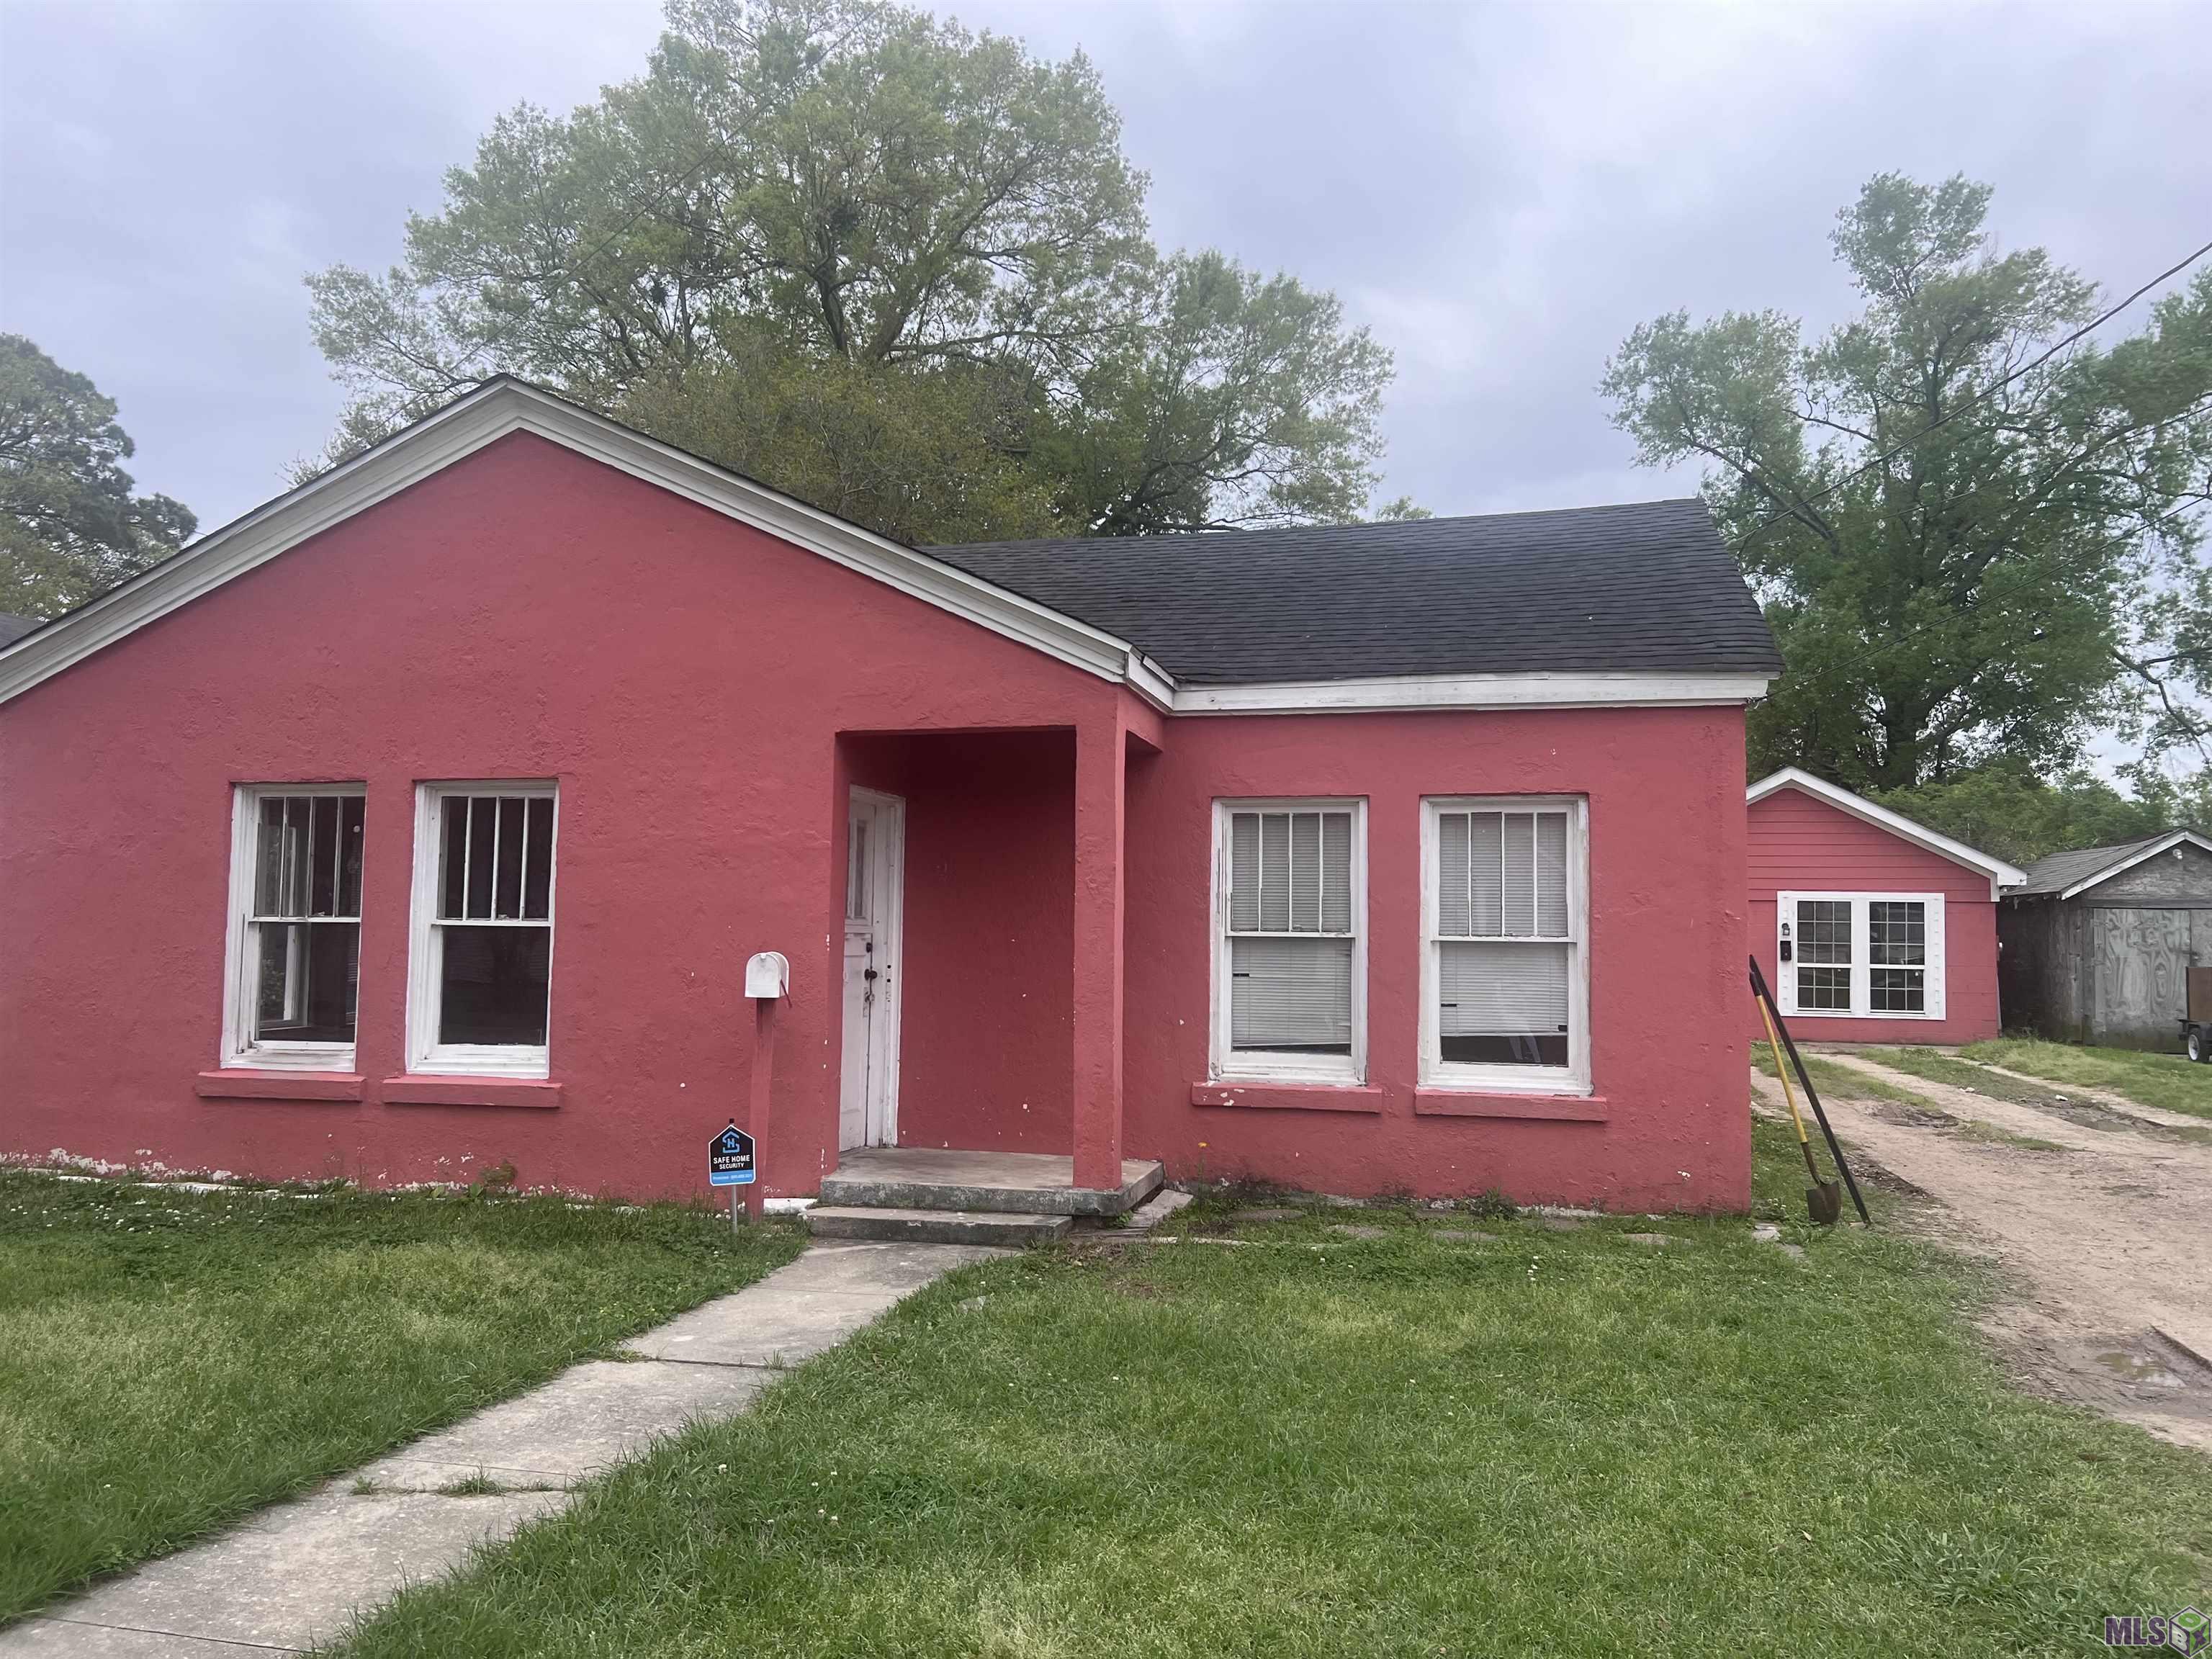
3134 Dougherty Dr, Baton Rouge, LA 70805
$314
Cash flow
20.6%
Cash-on-Cash Return
10.4%
Cap rate
1.3%
Rent to Value Ratio
Active
$345,000
4
bds
|
2
ba
|
2,062
sqft
|
built
2017
6544 Oak Garden Dr, Baton Rouge, LA 70817
$67
Cash flow
1.0%
Cash-on-Cash Return
5.9%
Cap rate
0.7%
Rent to Value Ratio
Active
$336,900
3
bds
|
2
ba
|
1,782
sqft
|
built
2017
2637 Cresthaven Ave, Baton Rouge, LA 70810
$-565
Cash flow
-8.7%
Cash-on-Cash Return
3.7%
Cap rate
0.5%
Rent to Value Ratio
Active
$397,500
3
bds
|
2
ba
|
2,330
sqft
|
built
1992
3912 Indian Run Dr, Baton Rouge, LA 70816
$258
Cash flow
3.4%
Cash-on-Cash Return
6.5%
Cap rate
0.8%
Rent to Value Ratio

Active
$348,500
3
bds
|
2
ba
|
1,442
sqft
|
built
2011
752 Rapides St, Baton Rouge, LA 70806
$-407
Cash flow
-6.1%
Cash-on-Cash Return
4.3%
Cap rate
0.5%
Rent to Value Ratio
Active
$59,900
2
bds
|
1
ba
|
730
sqft
|
built
1968
3423 Seneca St, Baton Rouge, LA 70805
$828
Cash flow
16.1%
Cash-on-Cash Return
16.6%
Cap rate
2.0%
Rent to Value Ratio
Active
$180,000
3
bds
|
2
ba
|
1,381
sqft
|
built
1975
1837 General Mouton Ave, Baton Rouge, LA 70810
$114
Cash flow
3.3%
Cash-on-Cash Return
6.4%
Cap rate
0.8%
Rent to Value Ratio
Active
$115,000
5
bds
|
3
ba
|
1,500
sqft
|
built
1960
3030 Fairfields Ave, Baton Rouge, LA 70802
$353
Cash flow
16.0%
Cash-on-Cash Return
9.4%
Cap rate
1.1%
Rent to Value Ratio

Active
$27,500
2
bds
|
1
ba
|
819
sqft
|
built
1973
2965 Pocahontas St, Baton Rouge, LA 70805
$552
Cash flow
23.4%
Cash-on-Cash Return
24.1%
Cap rate
2.9%
Rent to Value Ratio
Active
$399,000
4
bds
|
3
ba
|
2,416
sqft
|
built
1988
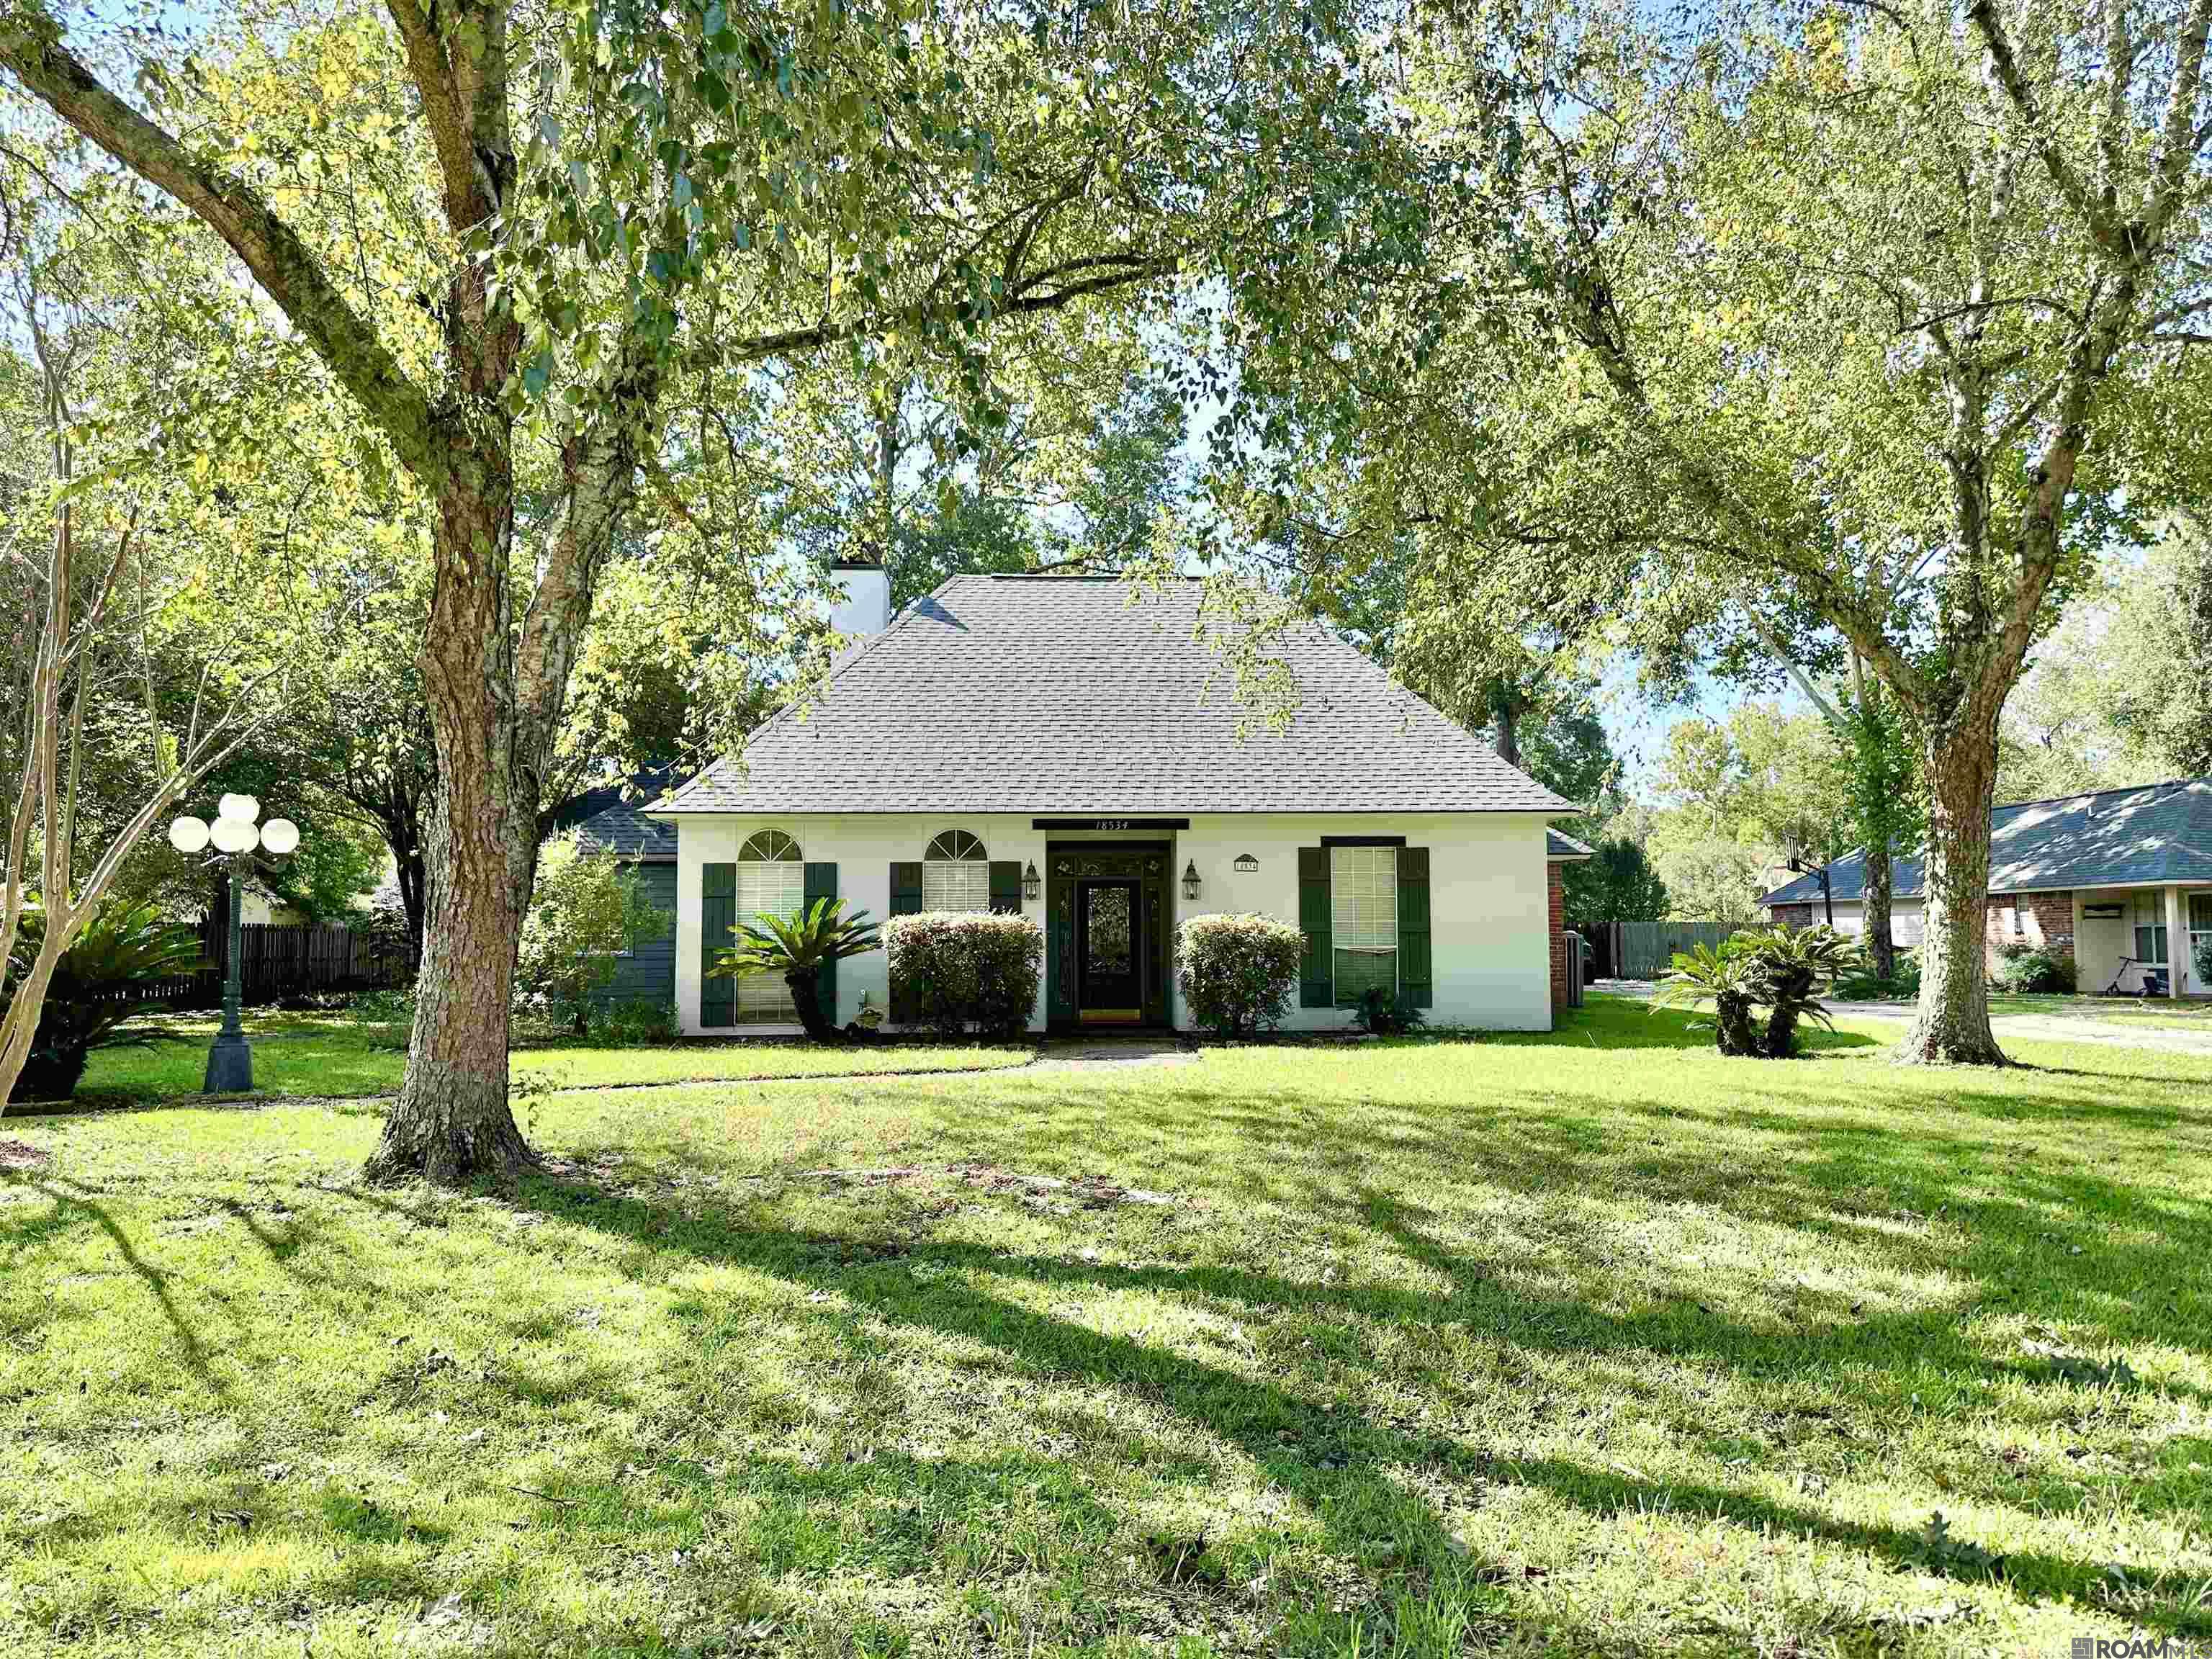
18534 Old Trace Dr, Baton Rouge, LA 70817
$19
Cash flow
0.2%
Cash-on-Cash Return
5.7%
Cap rate
0.7%
Rent to Value Ratio
Active
$499,000
3
bds
|
2
ba
|
3,610
sqft
|
built
2017
16025 Parkside Ct, Baton Rouge, LA 70817
$-669
Cash flow
-7.0%
Cash-on-Cash Return
4.1%
Cap rate
0.5%
Rent to Value Ratio
Active
$289,400
3
bds
|
2
ba
|
1,695
sqft
|
built
2016
10123 Hyde Park Ct, Baton Rouge, LA 70816
$4
Cash flow
0.1%
Cash-on-Cash Return
5.7%
Cap rate
0.7%
Rent to Value Ratio
Active
$43,000
2
bds
|
1
ba
|
784
sqft
|
built
1960
4261 Gurney St, Baton Rouge, LA 70805
$690
Cash flow
18.7%
Cash-on-Cash Return
19.3%
Cap rate
2.3%
Rent to Value Ratio
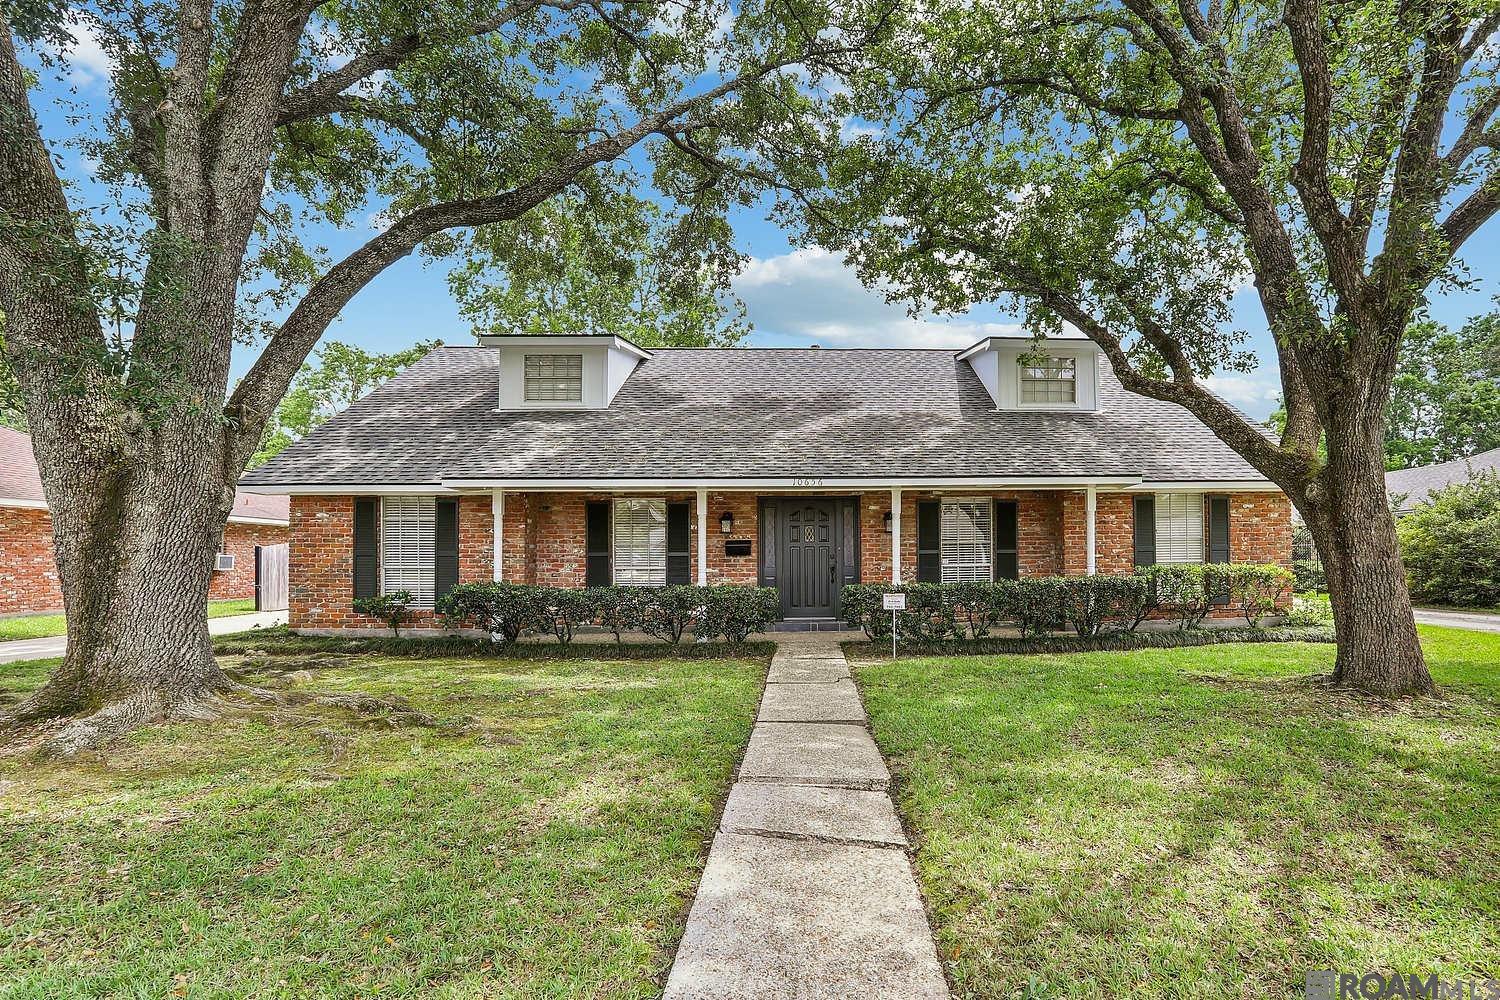
Active
$399,000
4
bds
|
3
ba
|
2,926
sqft
|
built
1973
10656 Rondo Ave, Baton Rouge, LA 70815
$-508
Cash flow
-6.6%
Cash-on-Cash Return
4.2%
Cap rate
0.5%
Rent to Value Ratio
Active
$280,000
5
bds
|
3
ba
|
2,406
sqft
|
built
1968
12118 Gurney Rd, Baton Rouge, LA 70818
$262
Cash flow
4.9%
Cash-on-Cash Return
6.8%
Cap rate
0.8%
Rent to Value Ratio

Active
$355,000
4
bds
|
3
ba
|
2,144
sqft
|
built
1977
667 College Hill Dr, Baton Rouge, LA 70808
$45
Cash flow
0.7%
Cash-on-Cash Return
5.8%
Cap rate
0.7%
Rent to Value Ratio
Active
$1,895,000
4
bds
|
5
ba
|
5,524
sqft
|
built
2010
6925 Woodstock Dr, Baton Rouge, LA 70809
$-2,938
Cash flow
-8.1%
Cash-on-Cash Return
3.8%
Cap rate
0.5%
Rent to Value Ratio
Active
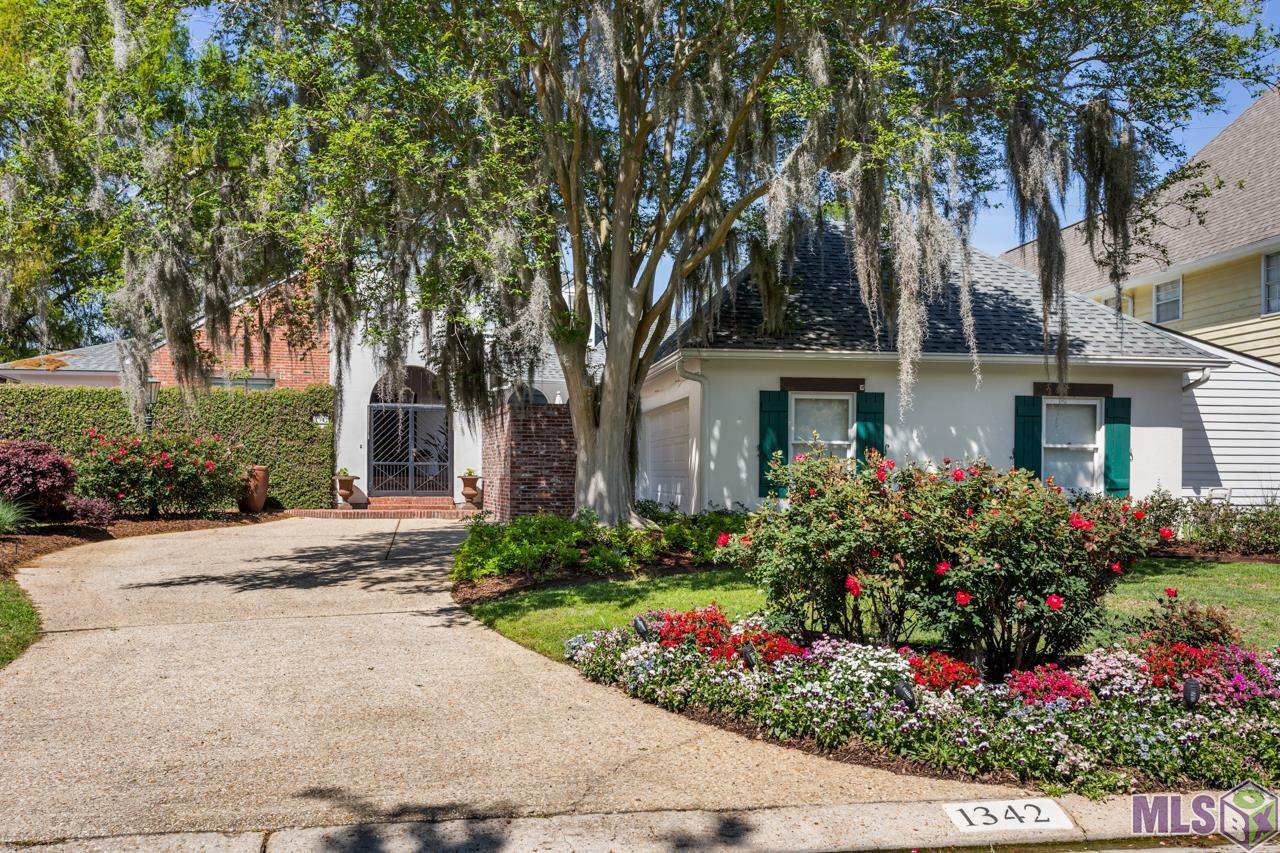
$799,000
4
bds
|
4
ba
|
3,960
sqft
|
built
1990
1342 Applewood Rd, Baton Rouge, LA 70808
$-442
Cash flow
-2.9%
Cash-on-Cash Return
5.0%
Cap rate
0.6%
Rent to Value Ratio
Active
$310,000
4
bds
|
3
ba
|
2,637
sqft
|
built
1973
13343 E Parnell Ave, Baton Rouge, LA 70815
$258
Cash flow
4.3%
Cash-on-Cash Return
6.7%
Cap rate
0.8%
Rent to Value Ratio
Active
$179,500
2
bds
|
2
ba
|
1,357
sqft
|
built
1983
4151 Jefferson Woods Dr, Baton Rouge, LA 70809
$27
Cash flow
0.8%
Cash-on-Cash Return
5.9%
Cap rate
0.8%
Rent to Value Ratio
Active
$259,000
3
bds
|
2
ba
|
2,525
sqft
|
built
1967
12511 E Robin Hood Dr, Baton Rouge, LA 70815
$292
Cash flow
5.9%
Cash-on-Cash Return
7.0%
Cap rate
0.8%
Rent to Value Ratio
Active
$216,500
2
bds
|
2
ba
|
1,430
sqft
|
built
1976
10093 Jefferson Hwy, Baton Rouge, LA 70809
$-151
Cash flow
-3.6%
Cash-on-Cash Return
4.8%
Cap rate
0.8%
Rent to Value Ratio
Active
$230,000
4
bds
|
2
ba
|
2,049
sqft
|
built
1974
1814 Mc Quaid Dr, Baton Rouge, LA 70810
$16
Cash flow
0.4%
Cash-on-Cash Return
5.8%
Cap rate
0.7%
Rent to Value Ratio
Active
$395,000
4
bds
|
3
ba
|
2,468
sqft
|
built
2022
5412 Heron Landing Dr, Baton Rouge, LA 70816
$-736
Cash flow
-9.7%
Cash-on-Cash Return
3.4%
Cap rate
0.4%
Rent to Value Ratio
Active
$150,000
3
bds
|
2
ba
|
1,216
sqft
|
built
1950
9121 Cefalu Dr, Baton Rouge, LA 70811
$394
Cash flow
13.7%
Cash-on-Cash Return
8.8%
Cap rate
1.1%
Rent to Value Ratio
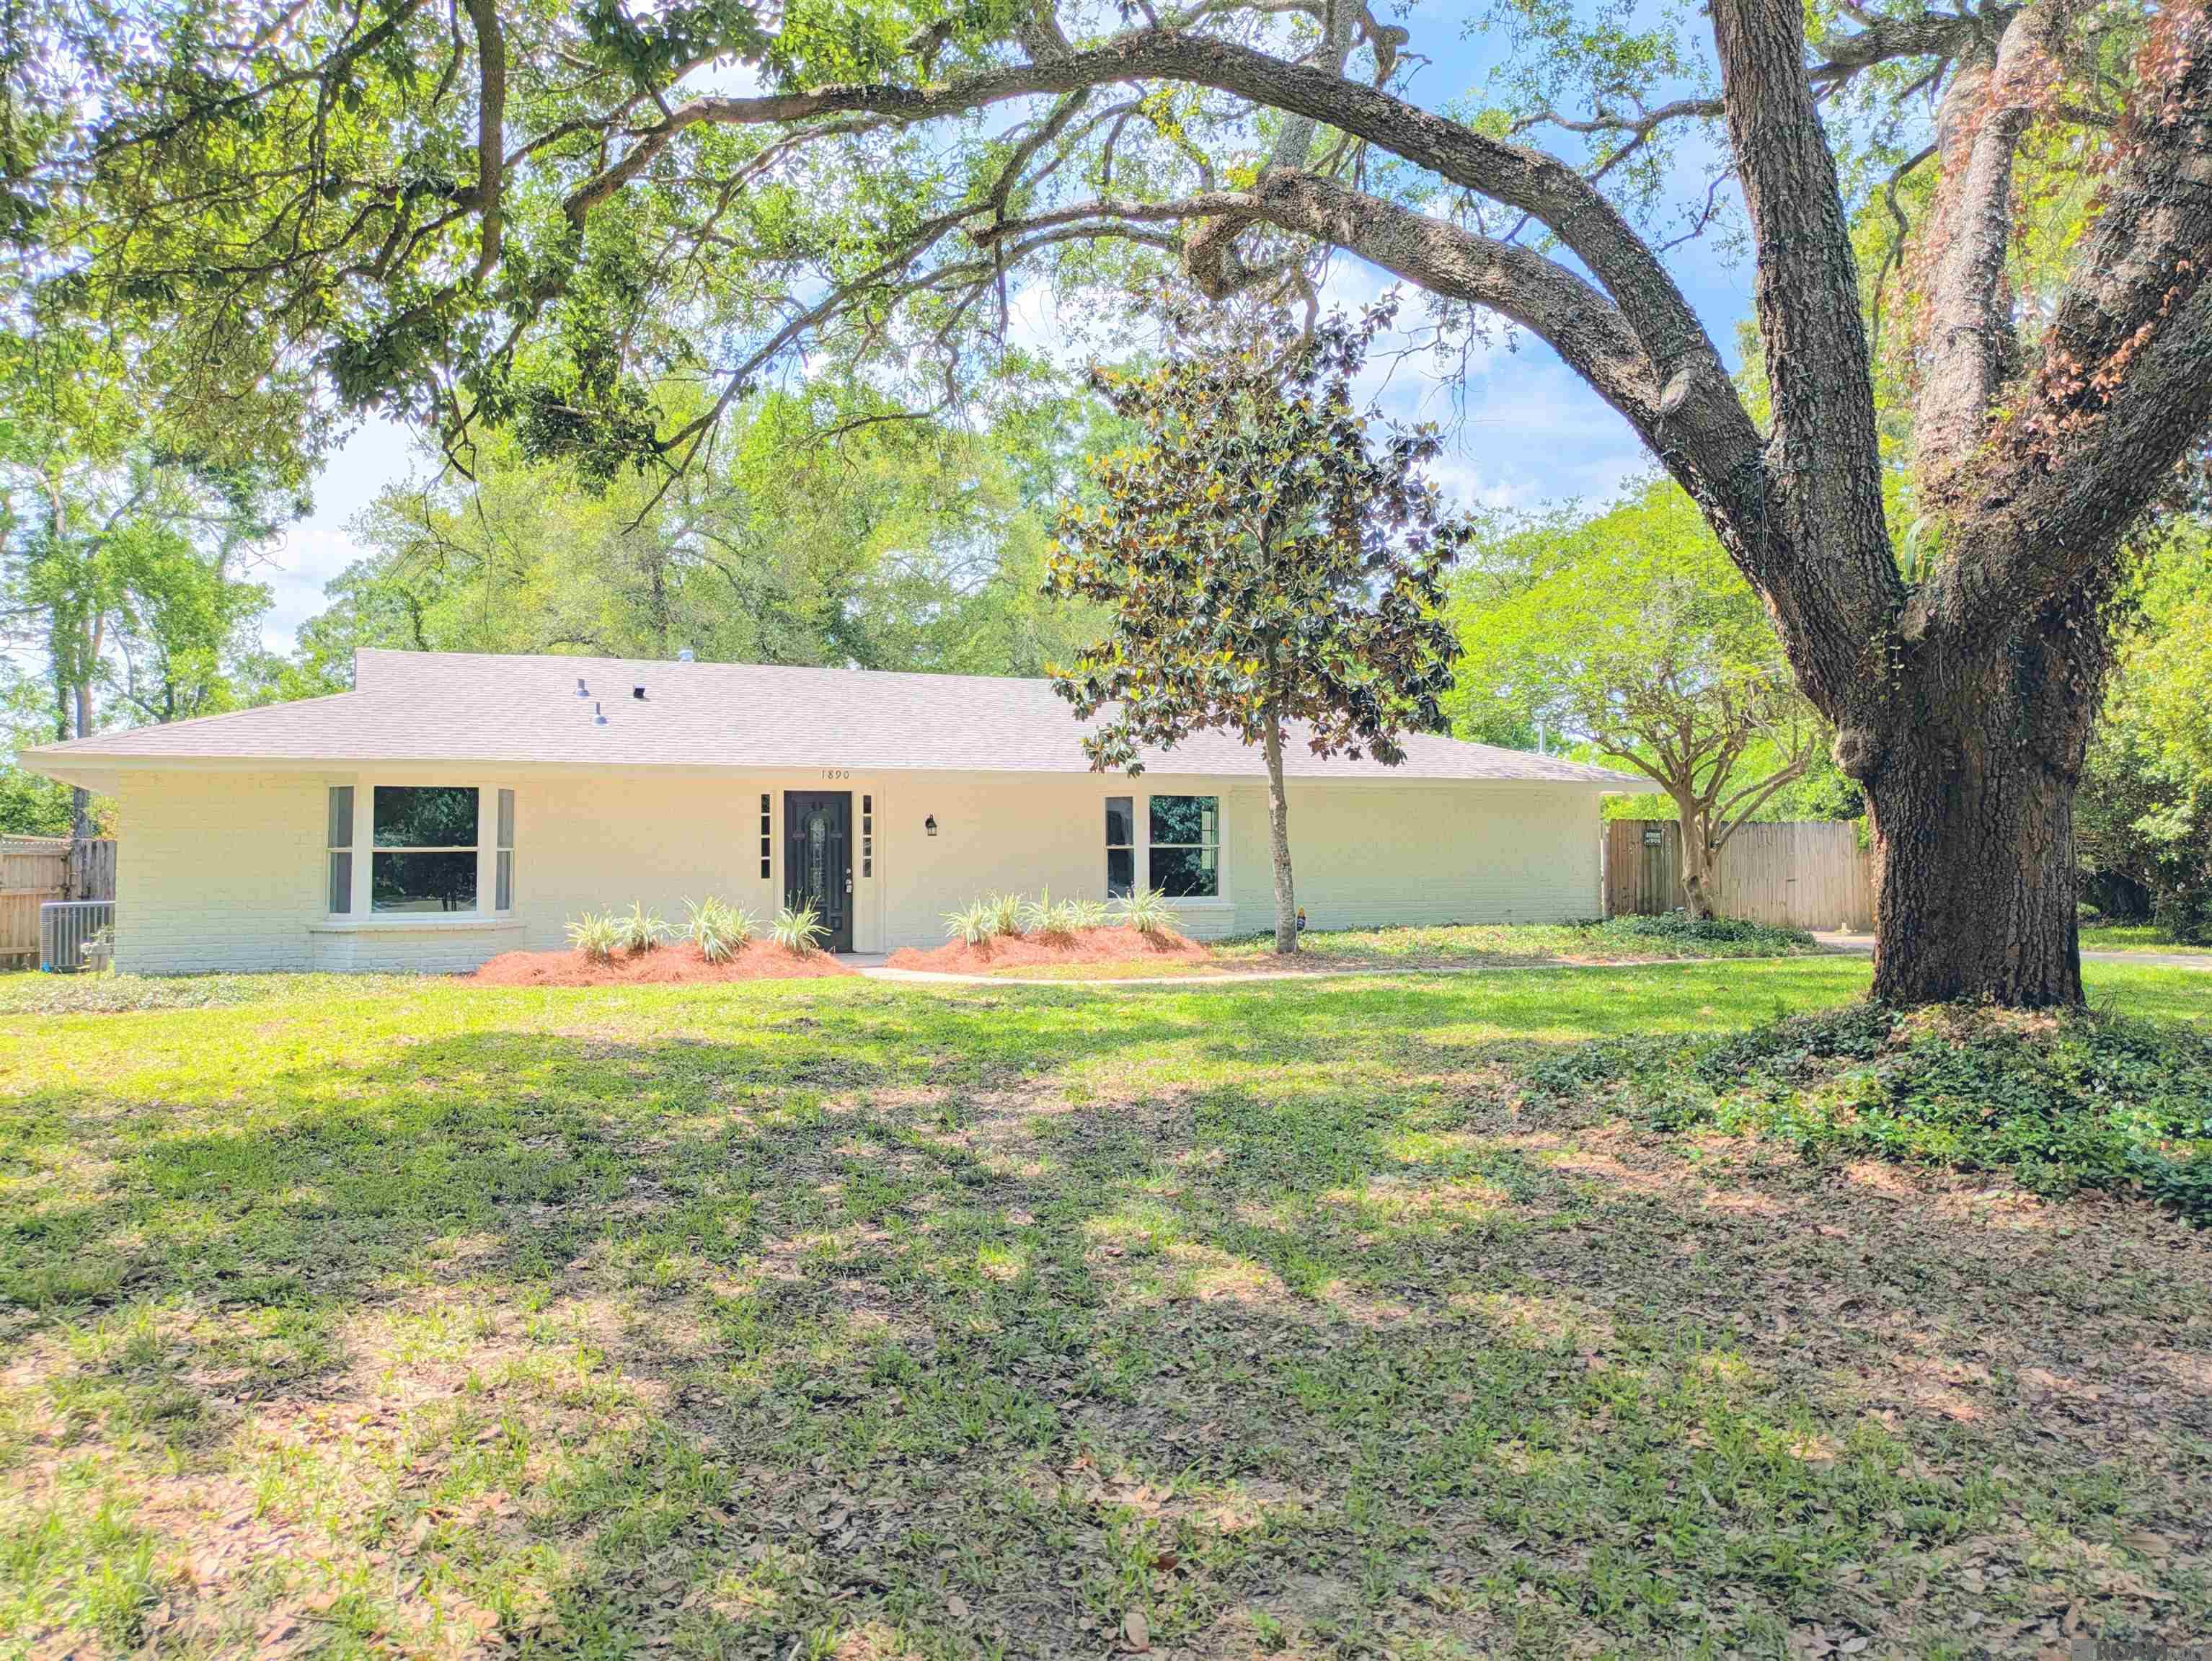
Active
$239,000
3
bds
|
2
ba
|
2,128
sqft
|
built
1970
1890 Dabney Dr, Baton Rouge, LA 70816
$111
Cash flow
2.4%
Cash-on-Cash Return
6.2%
Cap rate
0.8%
Rent to Value Ratio
Active
$1,050,000
5
bds
|
4
ba
|
4,139
sqft
|
built
2005
10321 N Lake Estates Ave, Baton Rouge, LA 70810
$-2,554
Cash flow
-12.7%
Cash-on-Cash Return
2.8%
Cap rate
0.3%
Rent to Value Ratio
Active
$599,000
4
bds
|
3
ba
|
3,213
sqft
|
built
1976
5812 Georgetown Ave, Baton Rouge, LA 70808
$-1,114
Cash flow
-9.7%
Cash-on-Cash Return
3.4%
Cap rate
0.4%
Rent to Value Ratio
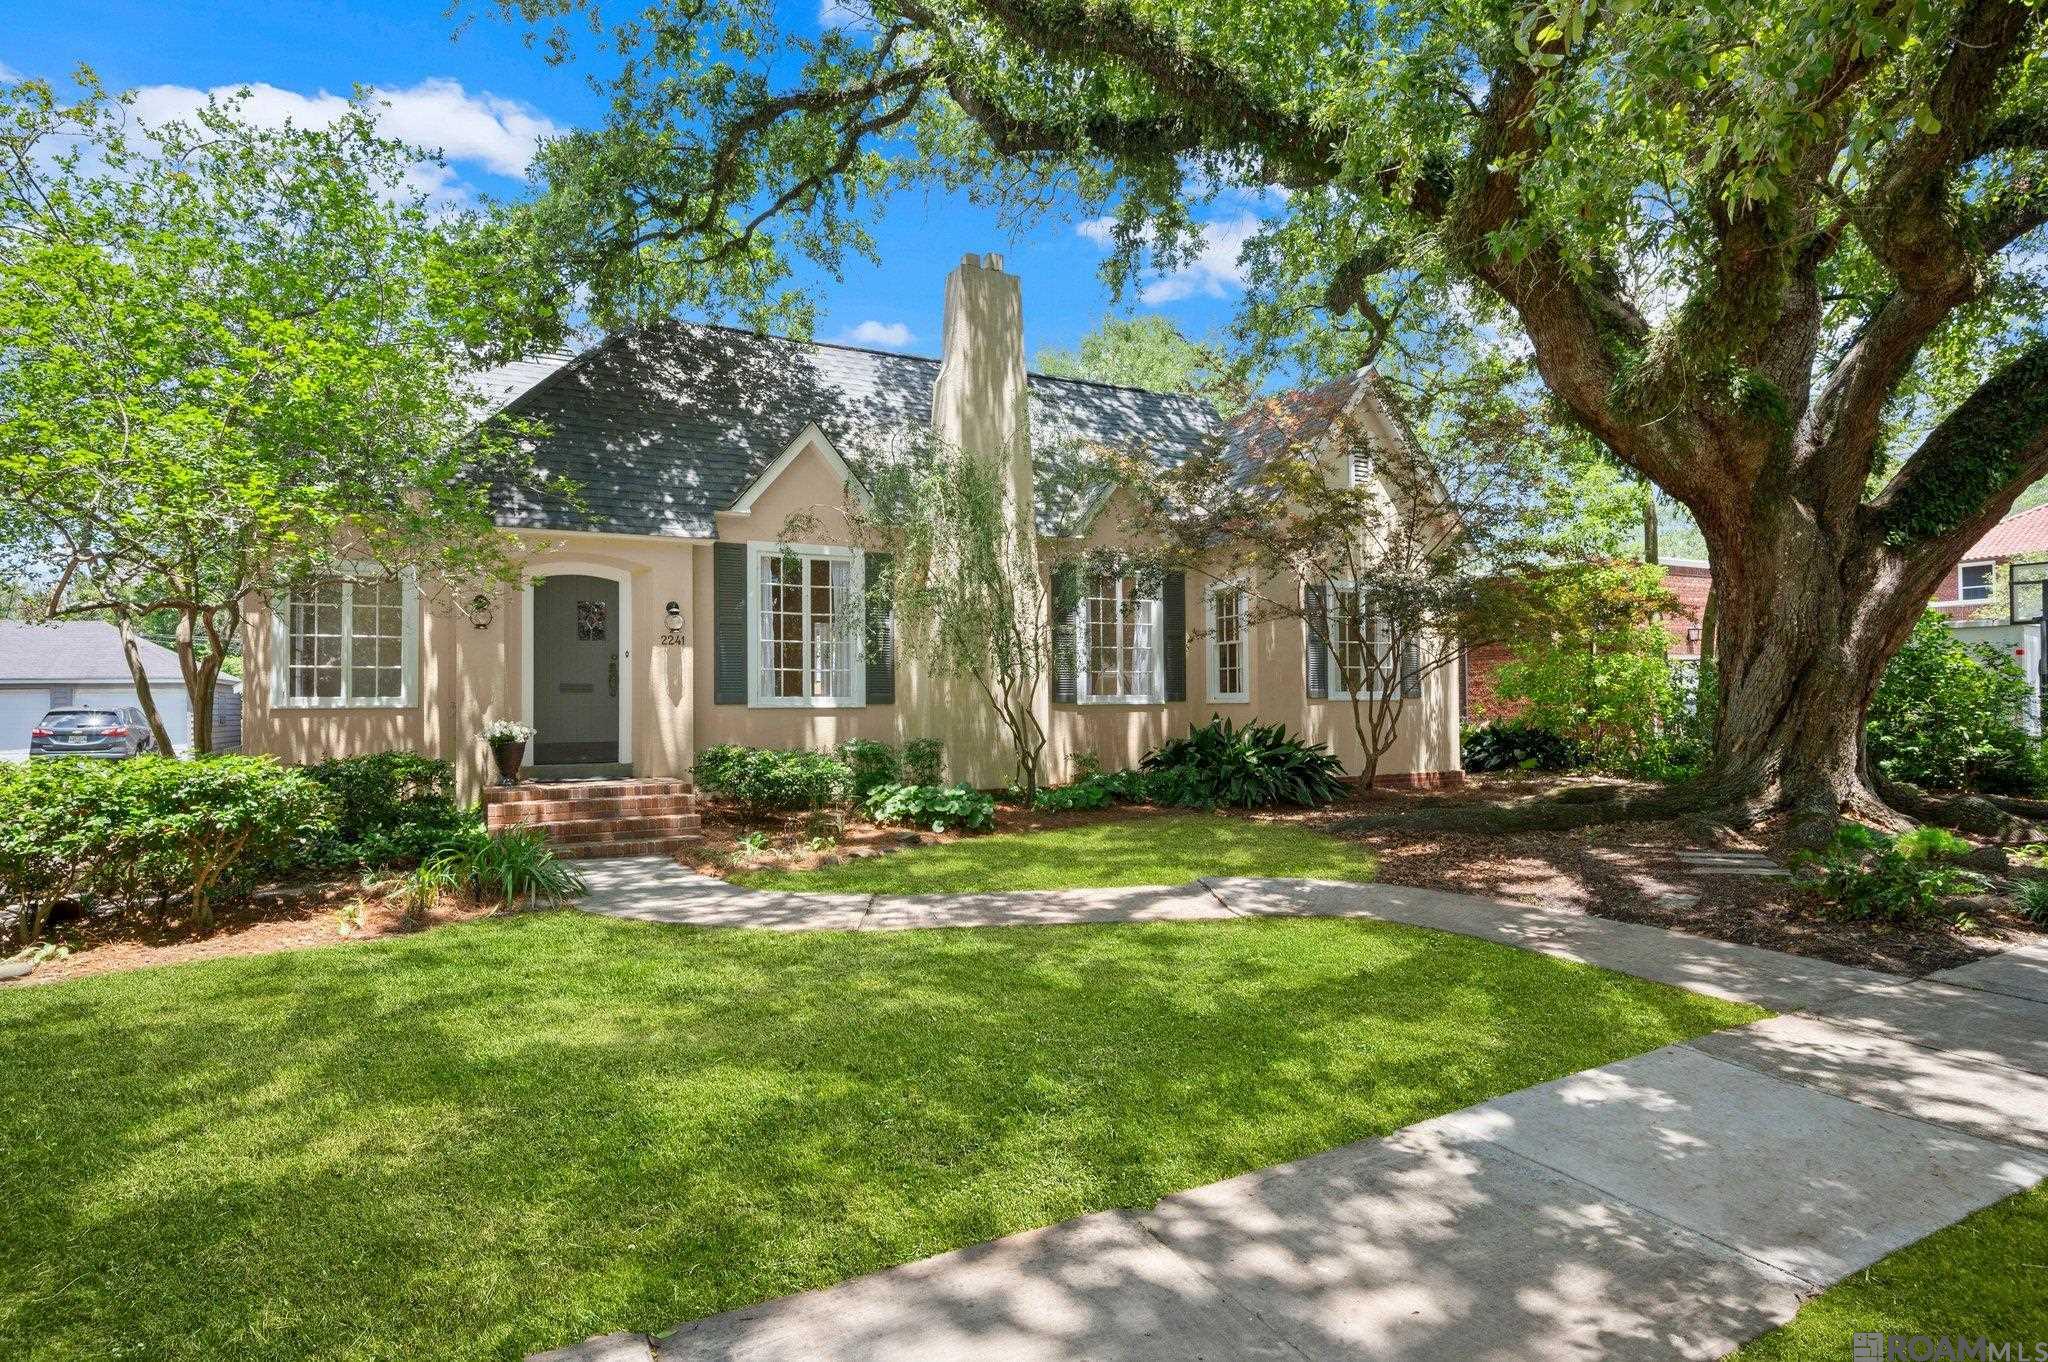
Active
$475,000
2
bds
|
2
ba
|
1,792
sqft
|
built
1938
2241 Myrtle Ave, Baton Rouge, LA 70806
$-730
Cash flow
-8.0%
Cash-on-Cash Return
3.8%
Cap rate
0.5%
Rent to Value Ratio

Pending
$199,900
3
bds
|
2
ba
|
1,816
sqft
|
built
1985
5256 N Afton Pkwy, Baton Rouge, LA 70806
$158
Cash flow
4.1%
Cash-on-Cash Return
6.6%
Cap rate
0.8%
Rent to Value Ratio
Active
$289,000
3
bds
|
2
ba
|
1,611
sqft
|
built
2011
17854 Willow Trail Dr, Baton Rouge, LA 70817
$-13
Cash flow
-0.2%
Cash-on-Cash Return
5.6%
Cap rate
0.7%
Rent to Value Ratio
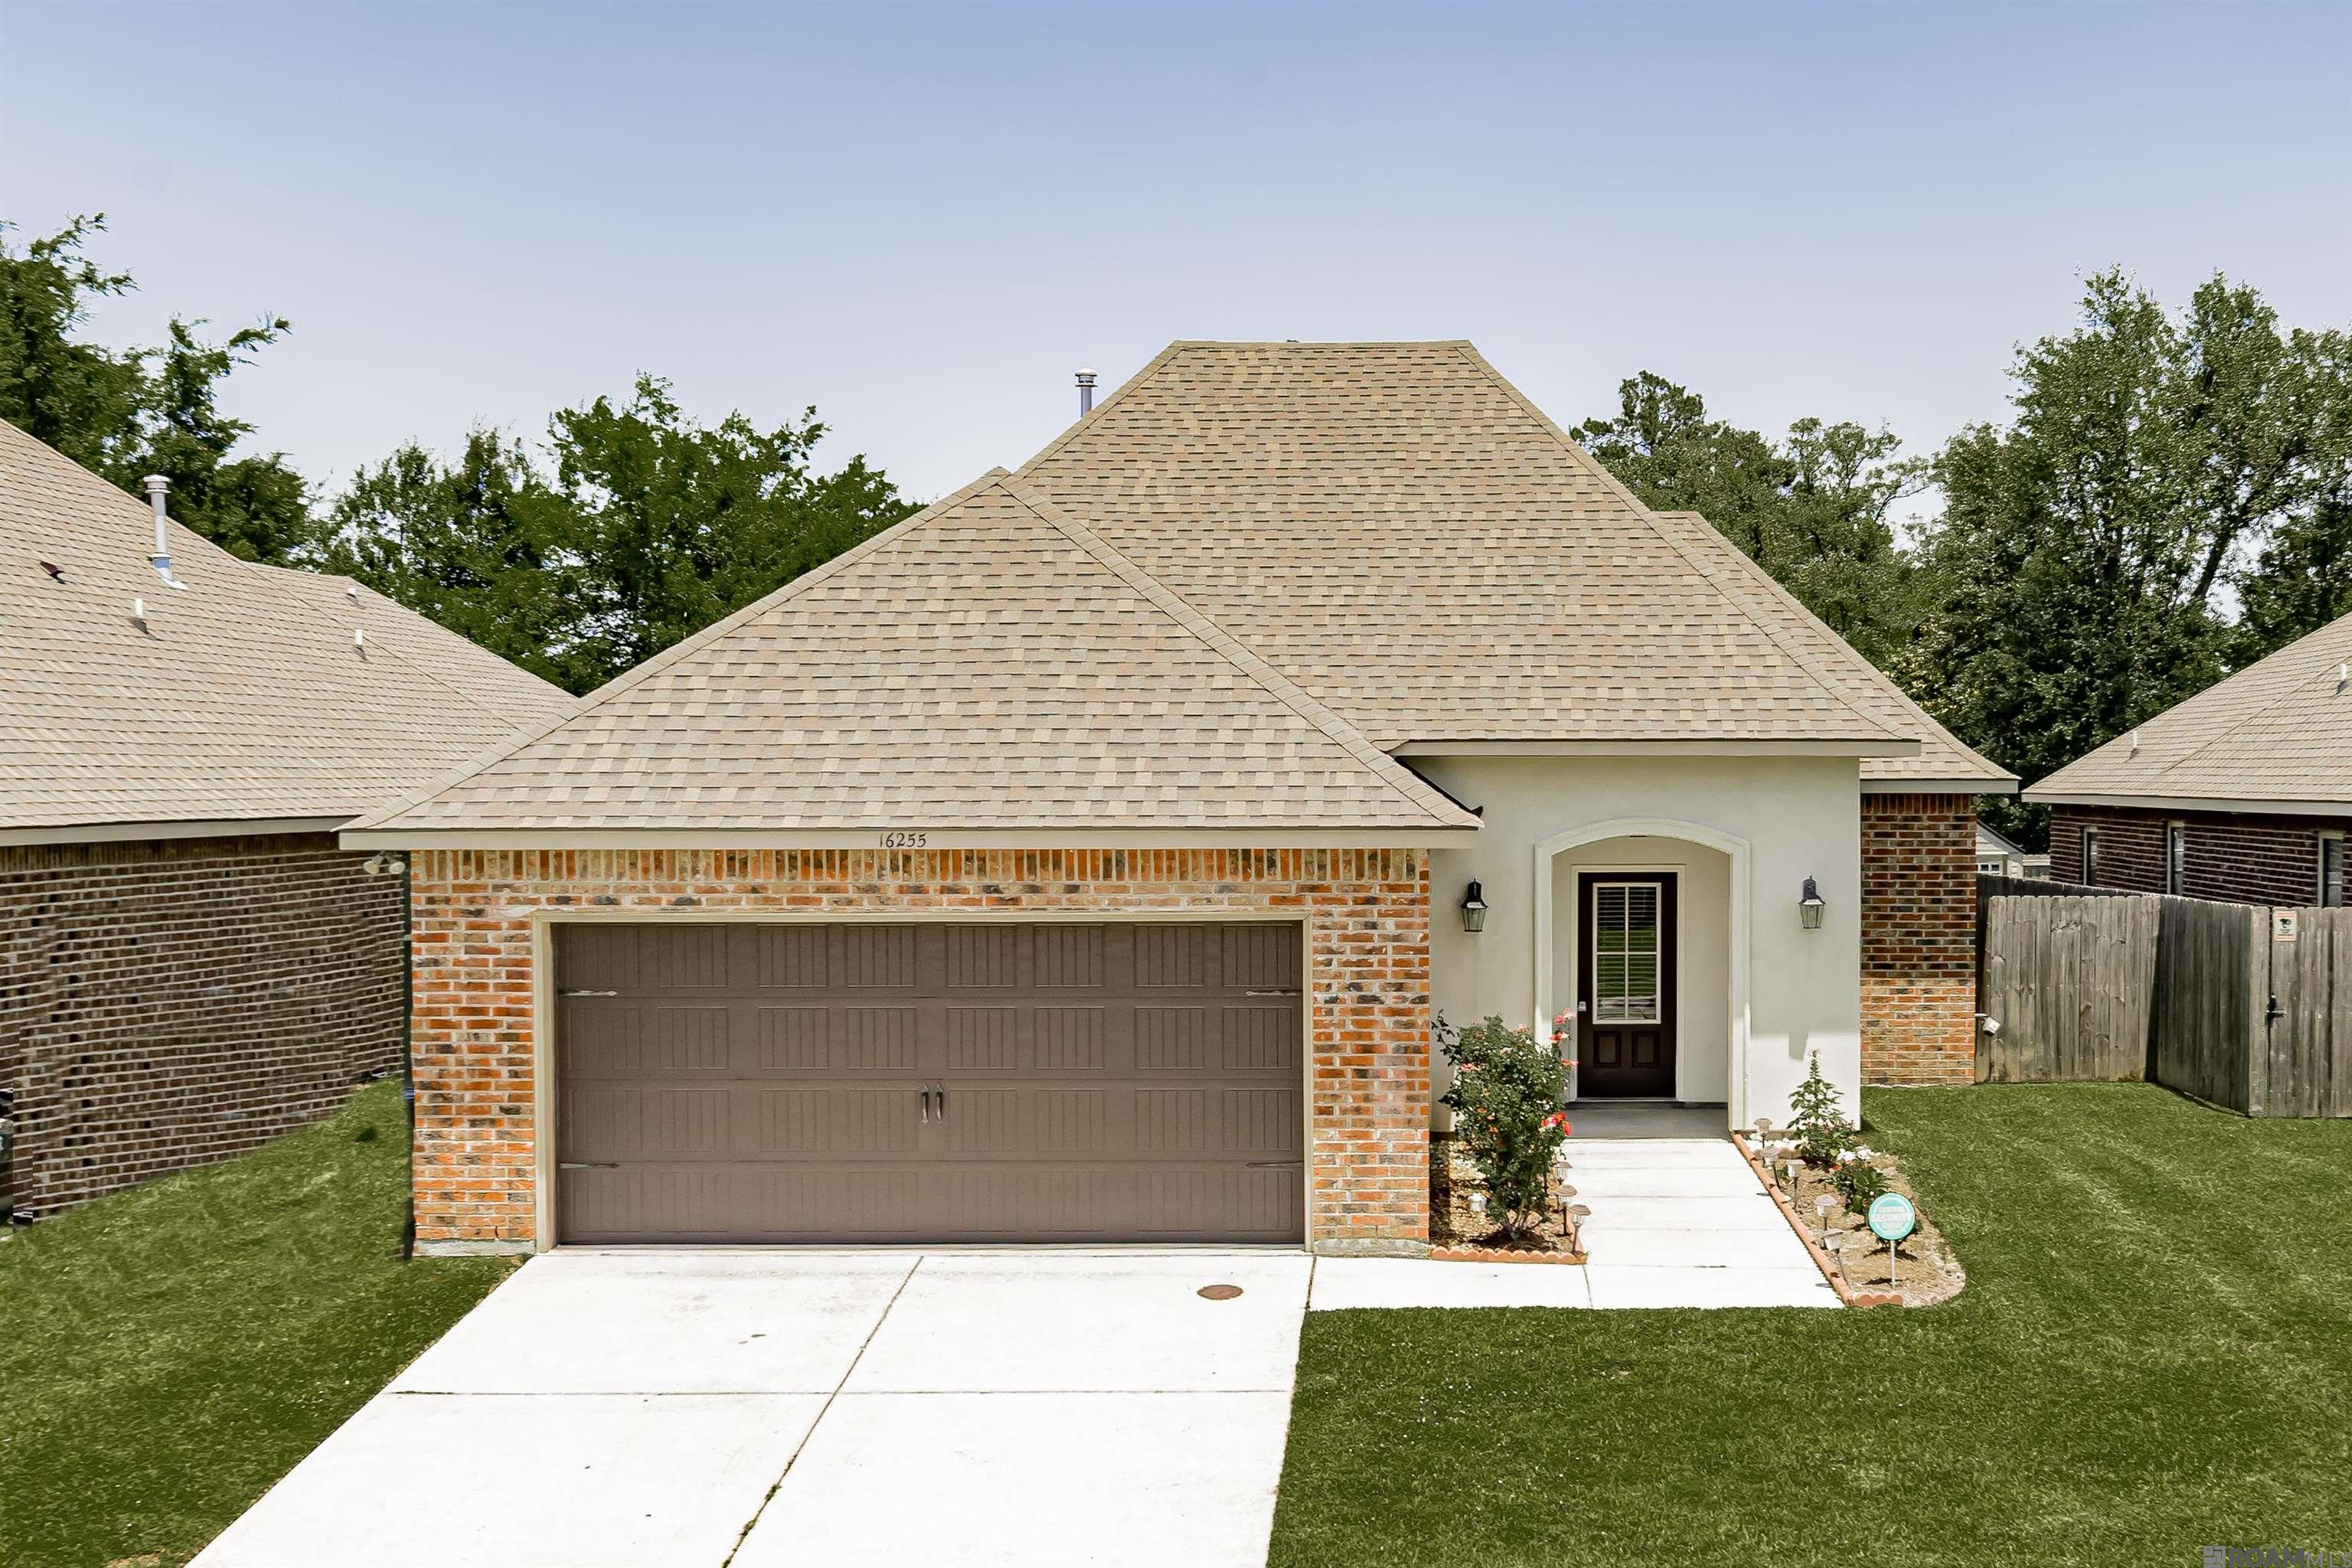
Active
$339,000
3
bds
|
2
ba
|
1,973
sqft
|
built
2018
16255 White Rose Dr, Baton Rouge, LA 70817
$-44
Cash flow
-0.7%
Cash-on-Cash Return
5.5%
Cap rate
0.7%
Rent to Value Ratio
Active
$669,000
4
bds
|
4
ba
|
3,843
sqft
|
built
1993
5802 Highland Rd, Baton Rouge, LA 70808
$-406
Cash flow
-3.2%
Cash-on-Cash Return
5.0%
Cap rate
0.6%
Rent to Value Ratio
Active
$200,000
2
bds
|
2
ba
|
1,569
sqft
|
built
1967
256 Kenwood Ave, Baton Rouge, LA 70806
$227
Cash flow
5.9%
Cash-on-Cash Return
7.0%
Cap rate
0.9%
Rent to Value Ratio
Pending
$160,000
3
bds
|
2
ba
|
1,081
sqft
|
built
1970
5621 Lanier Dr, Baton Rouge, LA 70812
$71
Cash flow
2.3%
Cash-on-Cash Return
6.2%
Cap rate
0.8%
Rent to Value Ratio
Active
$585,000
3
bds
|
2
ba
|
1,948
sqft
|
built
1940
1501 Letitia St, Baton Rouge, LA 70808
$-1,388
Cash flow
-12.4%
Cash-on-Cash Return
2.8%
Cap rate
0.3%
Rent to Value Ratio