Baton Rouge, LA Investment Properties for Sale
Browse homes for sale and investment properties in Baton Rouge, LA. Refine your search by price, property type, or more.
Best cash flowing properties in Baton Rouge, LA

Active
$44,900
2
bds
|
1
ba
|
757
sqft
|
built
1985
2760 N Foster Dr, Baton Rouge, LA 70805
$828
Cash flow
21.5%
Cash-on-Cash Return
22.1%
Cap rate
2.7%
Rent to Value Ratio
Active
$85,000
bds
|
0
ba
|
3,150
sqft
|
built
1118 Convention St, Baton Rouge, LA 70802
$797
Cash flow
48.9%
Cash-on-Cash Return
17.5%
Cap rate
2.1%
Rent to Value Ratio
996 out of 1,283 properties for sale in Baton Rouge, LA
Limited Results Shown
Create a free account, or log in to reveal all property listings and enjoy the complete experience.
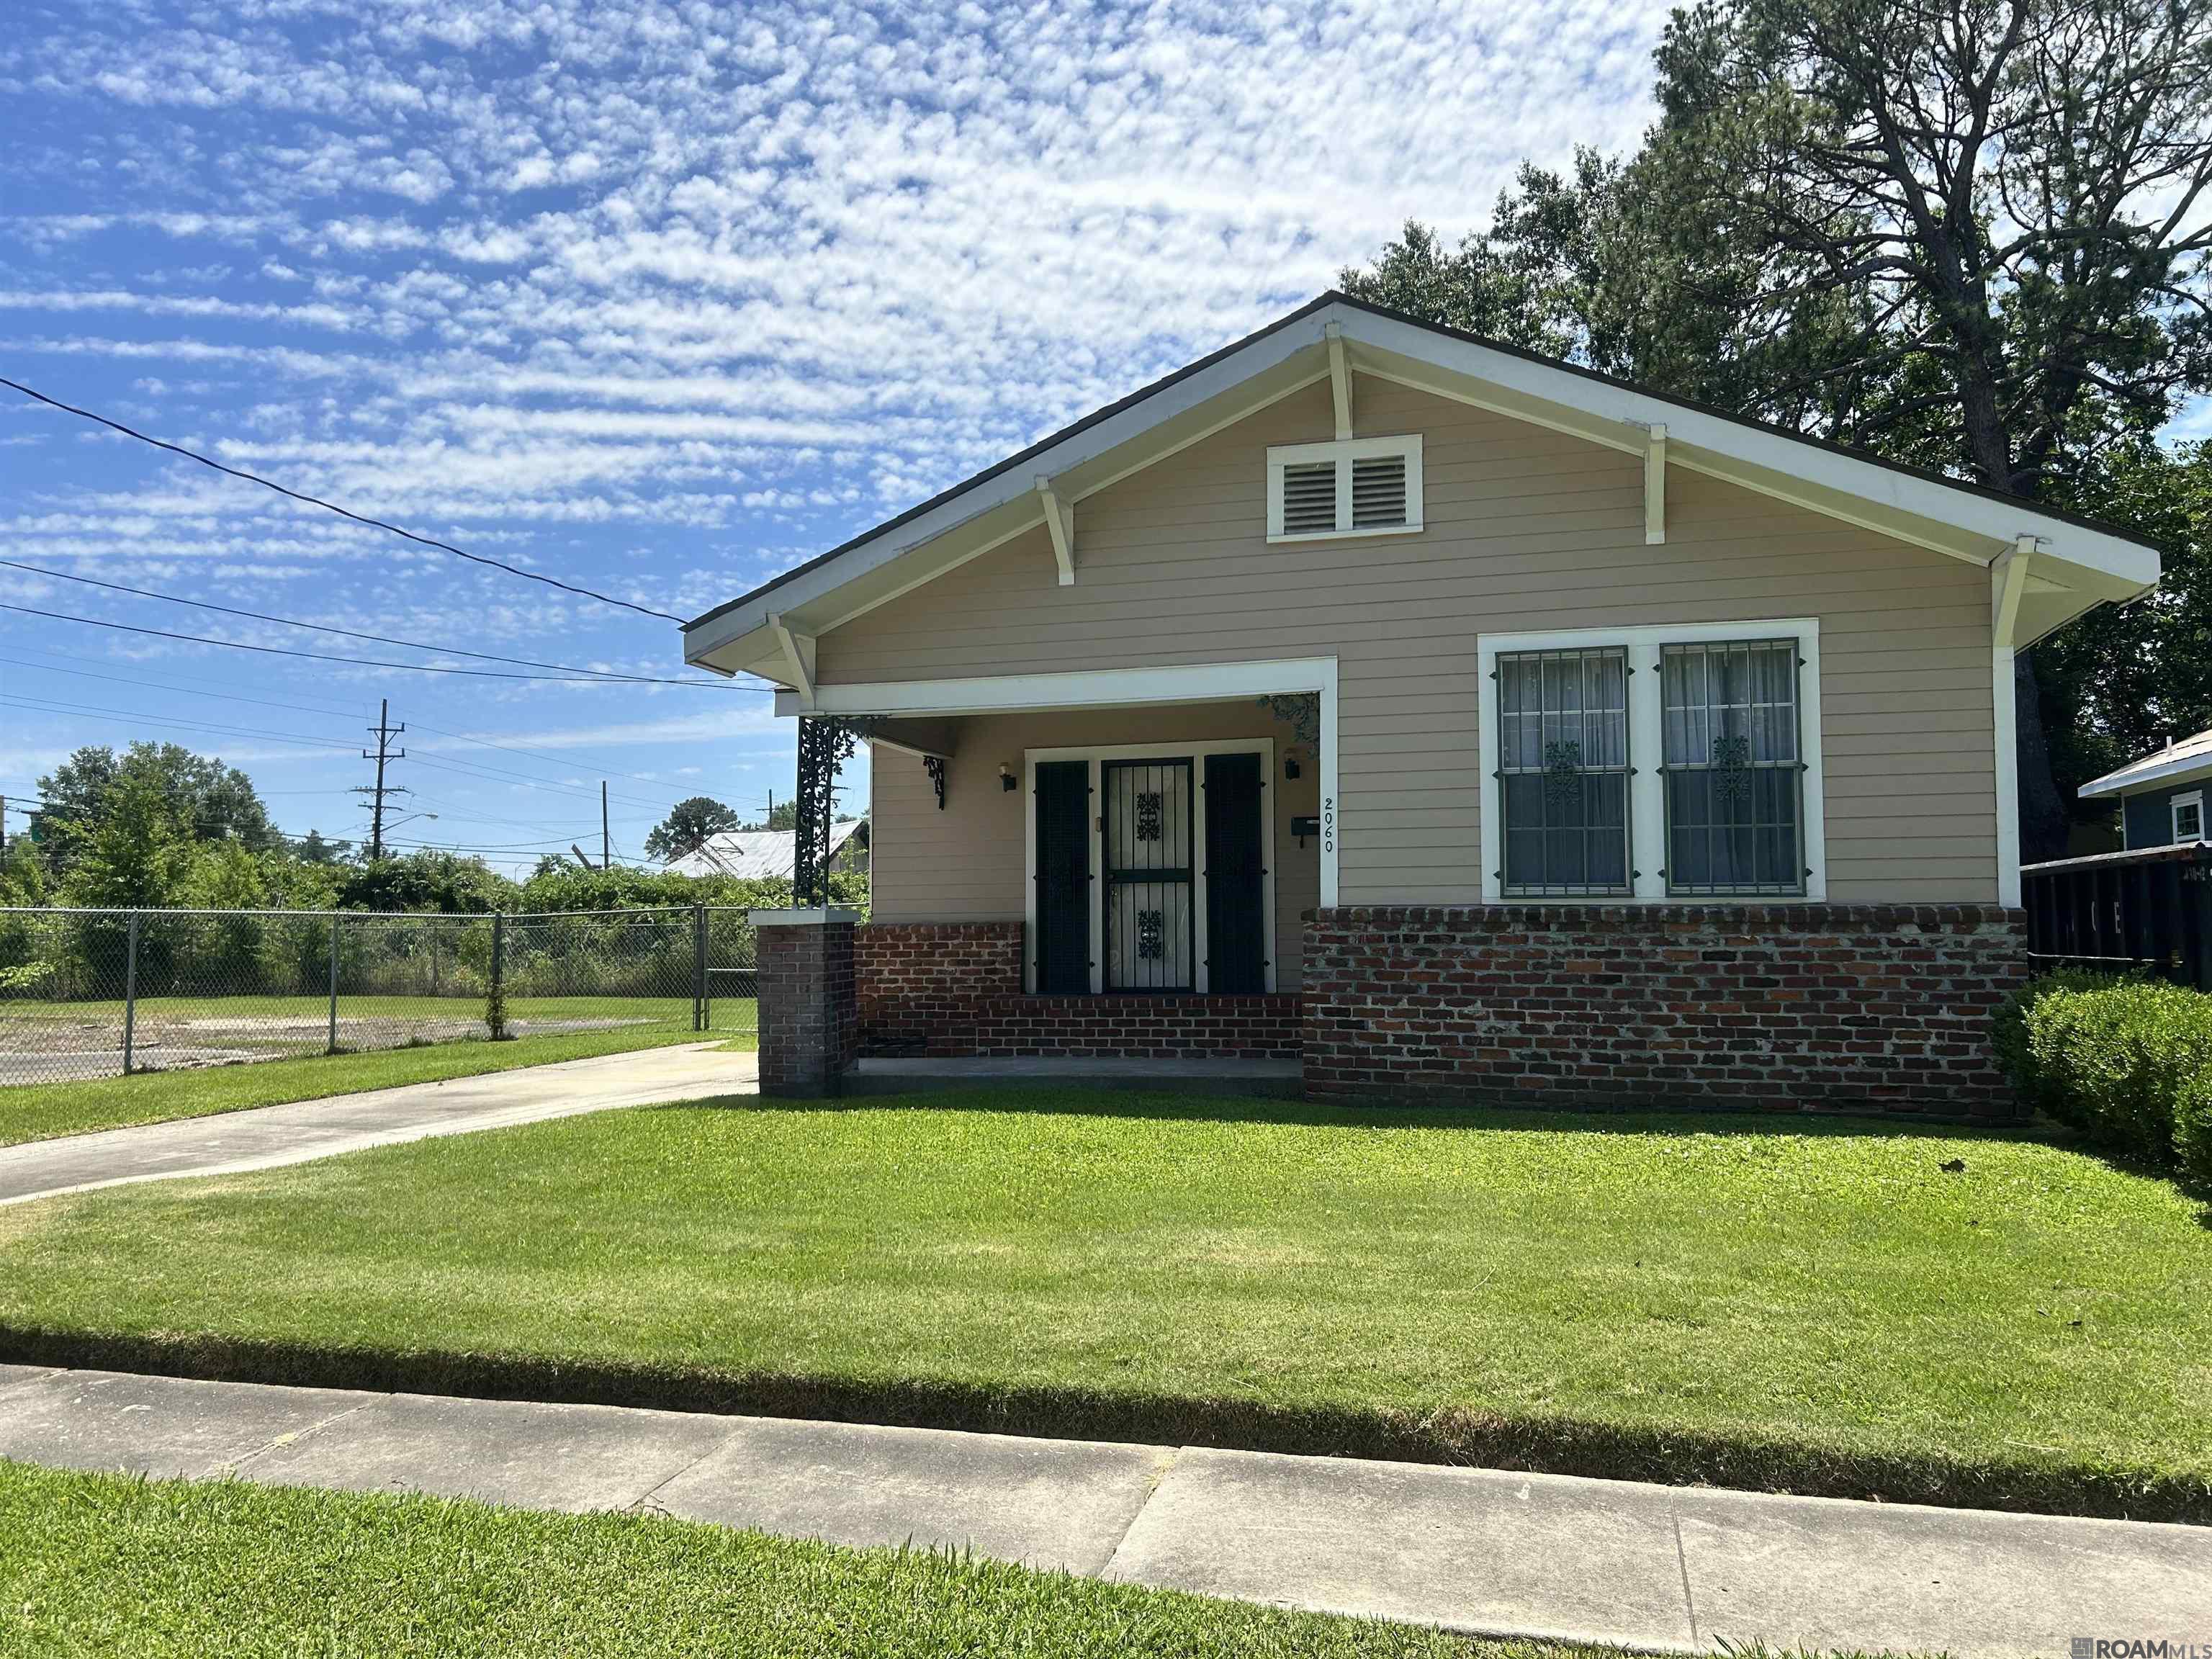
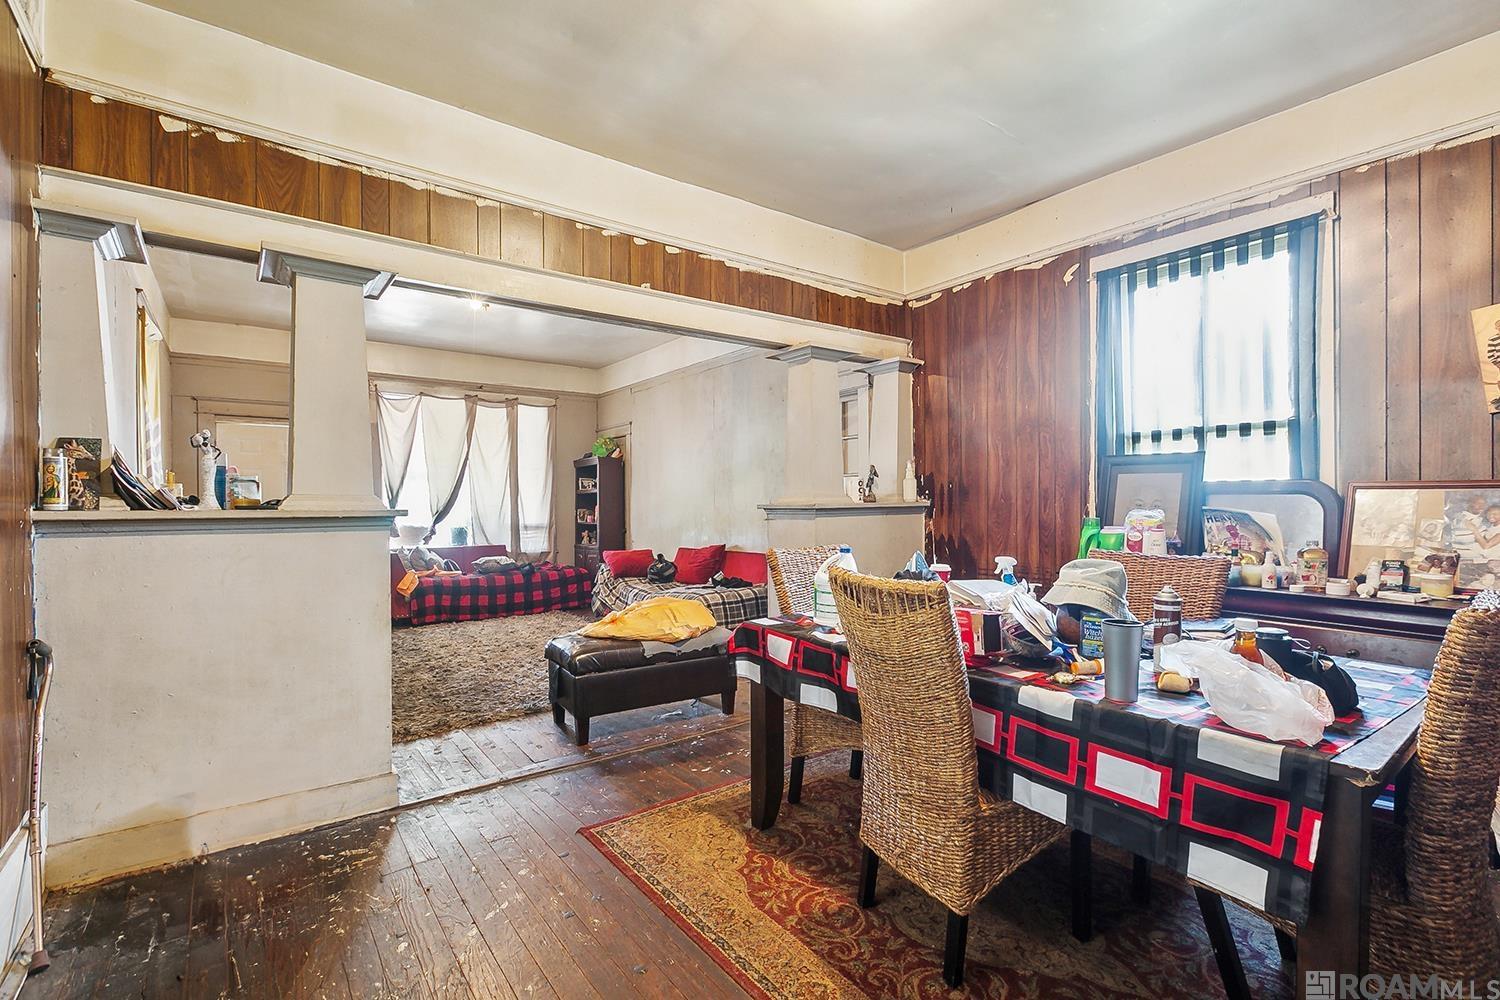
Active
$130,000
2
bds
|
1
ba
|
1,665
sqft
|
built
1975
2060 Hemlock St, Baton Rouge, LA 70802
$78
Cash flow
3.1%
Cash-on-Cash Return
7.0%
Cap rate
0.8%
Rent to Value Ratio
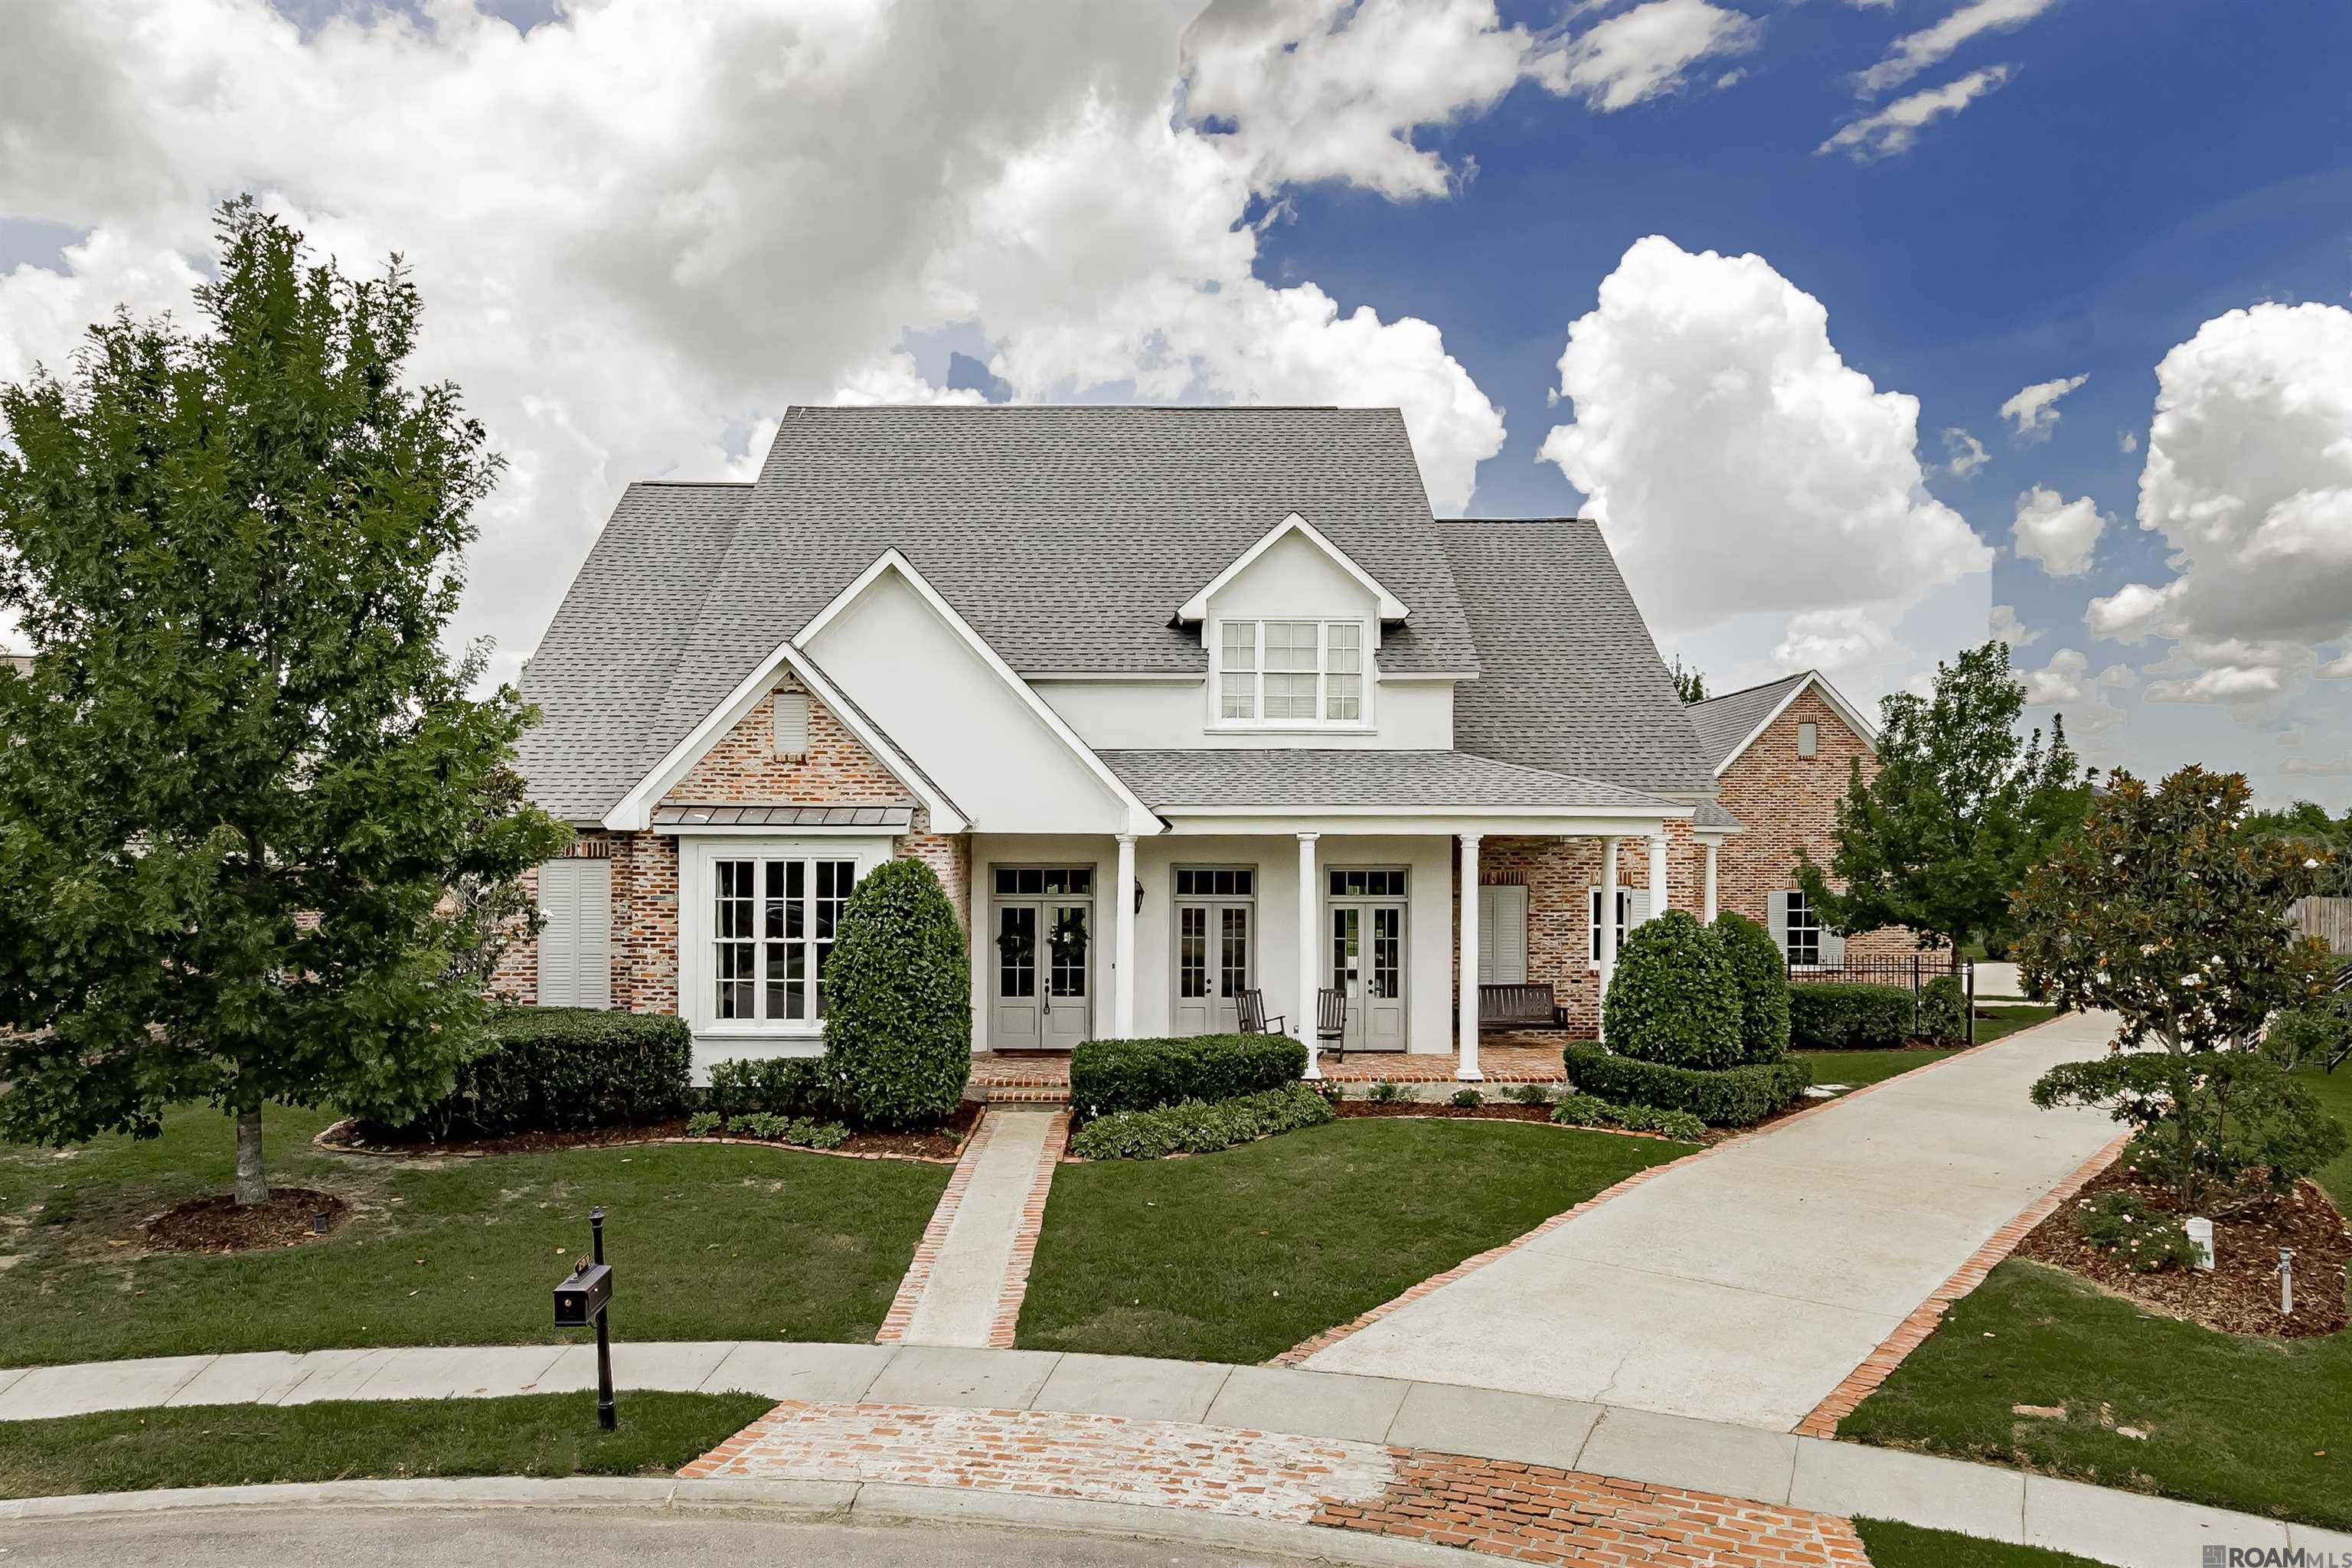
Active
$995,000
5
bds
|
5
ba
|
4,838
sqft
|
built
2009
15020 Tower Ct, Baton Rouge, LA 70810
$-1,357
Cash flow
-7.1%
Cash-on-Cash Return
4.6%
Cap rate
0.6%
Rent to Value Ratio
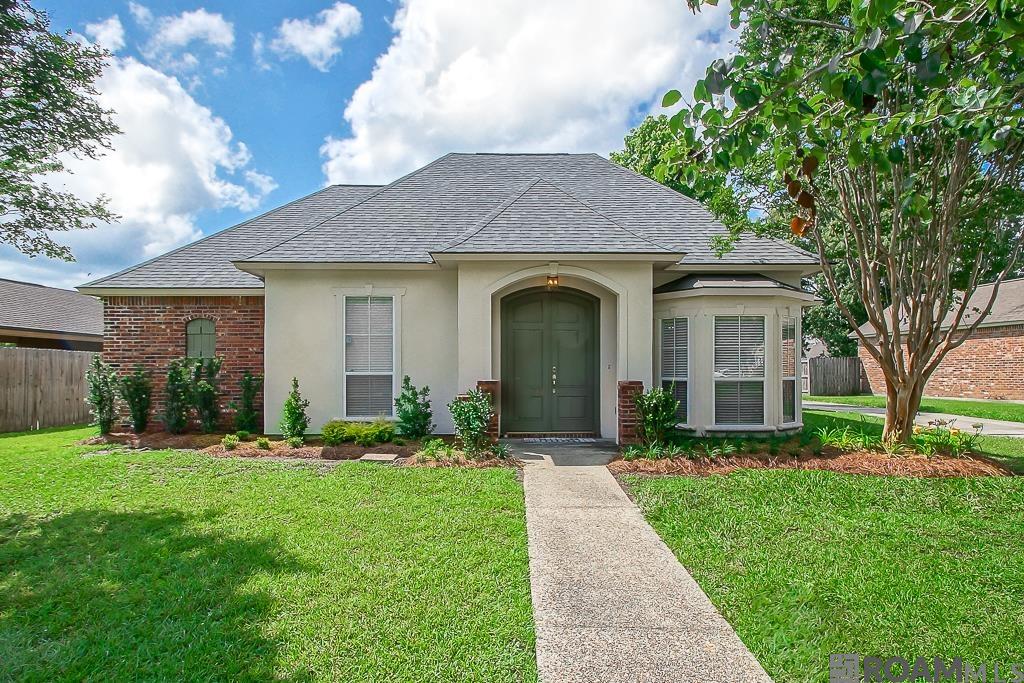
Active
$359,900
3
bds
|
3
ba
|
1,909
sqft
|
built
1999
10673 Hillshire Ave, Baton Rouge, LA 70810
$-400
Cash flow
-5.8%
Cash-on-Cash Return
5.0%
Cap rate
0.6%
Rent to Value Ratio
Active
$950,000
4
bds
|
4
ba
|
4,866
sqft
|
built
2007
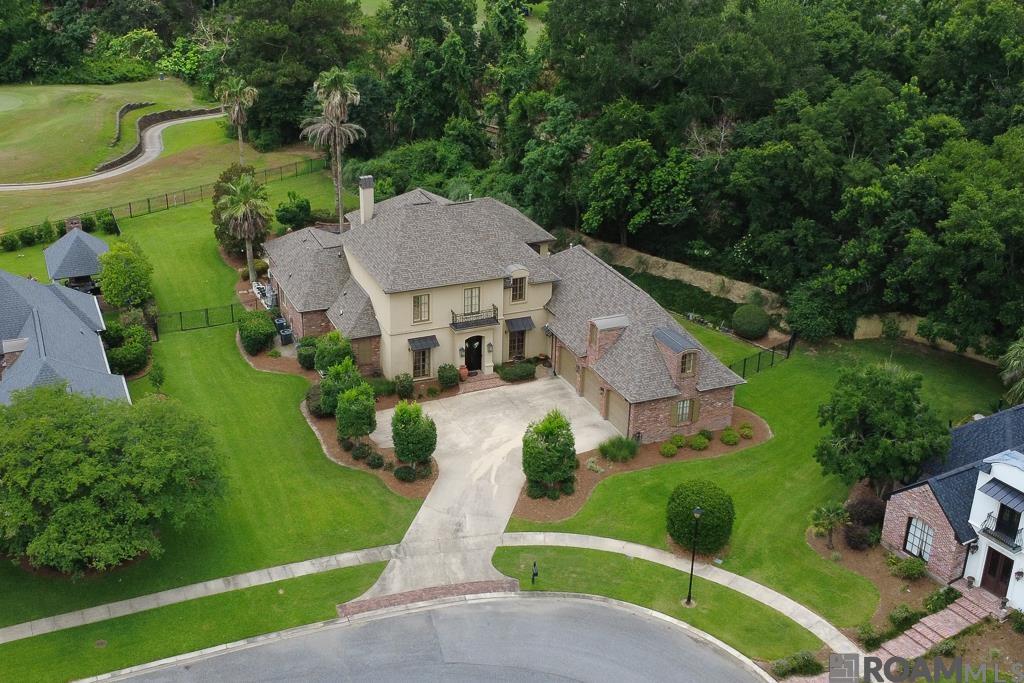
19018 Spyglass Hill Dr, Baton Rouge, LA 70809
$-2,549
Cash flow
-14.0%
Cash-on-Cash Return
3.1%
Cap rate
0.4%
Rent to Value Ratio
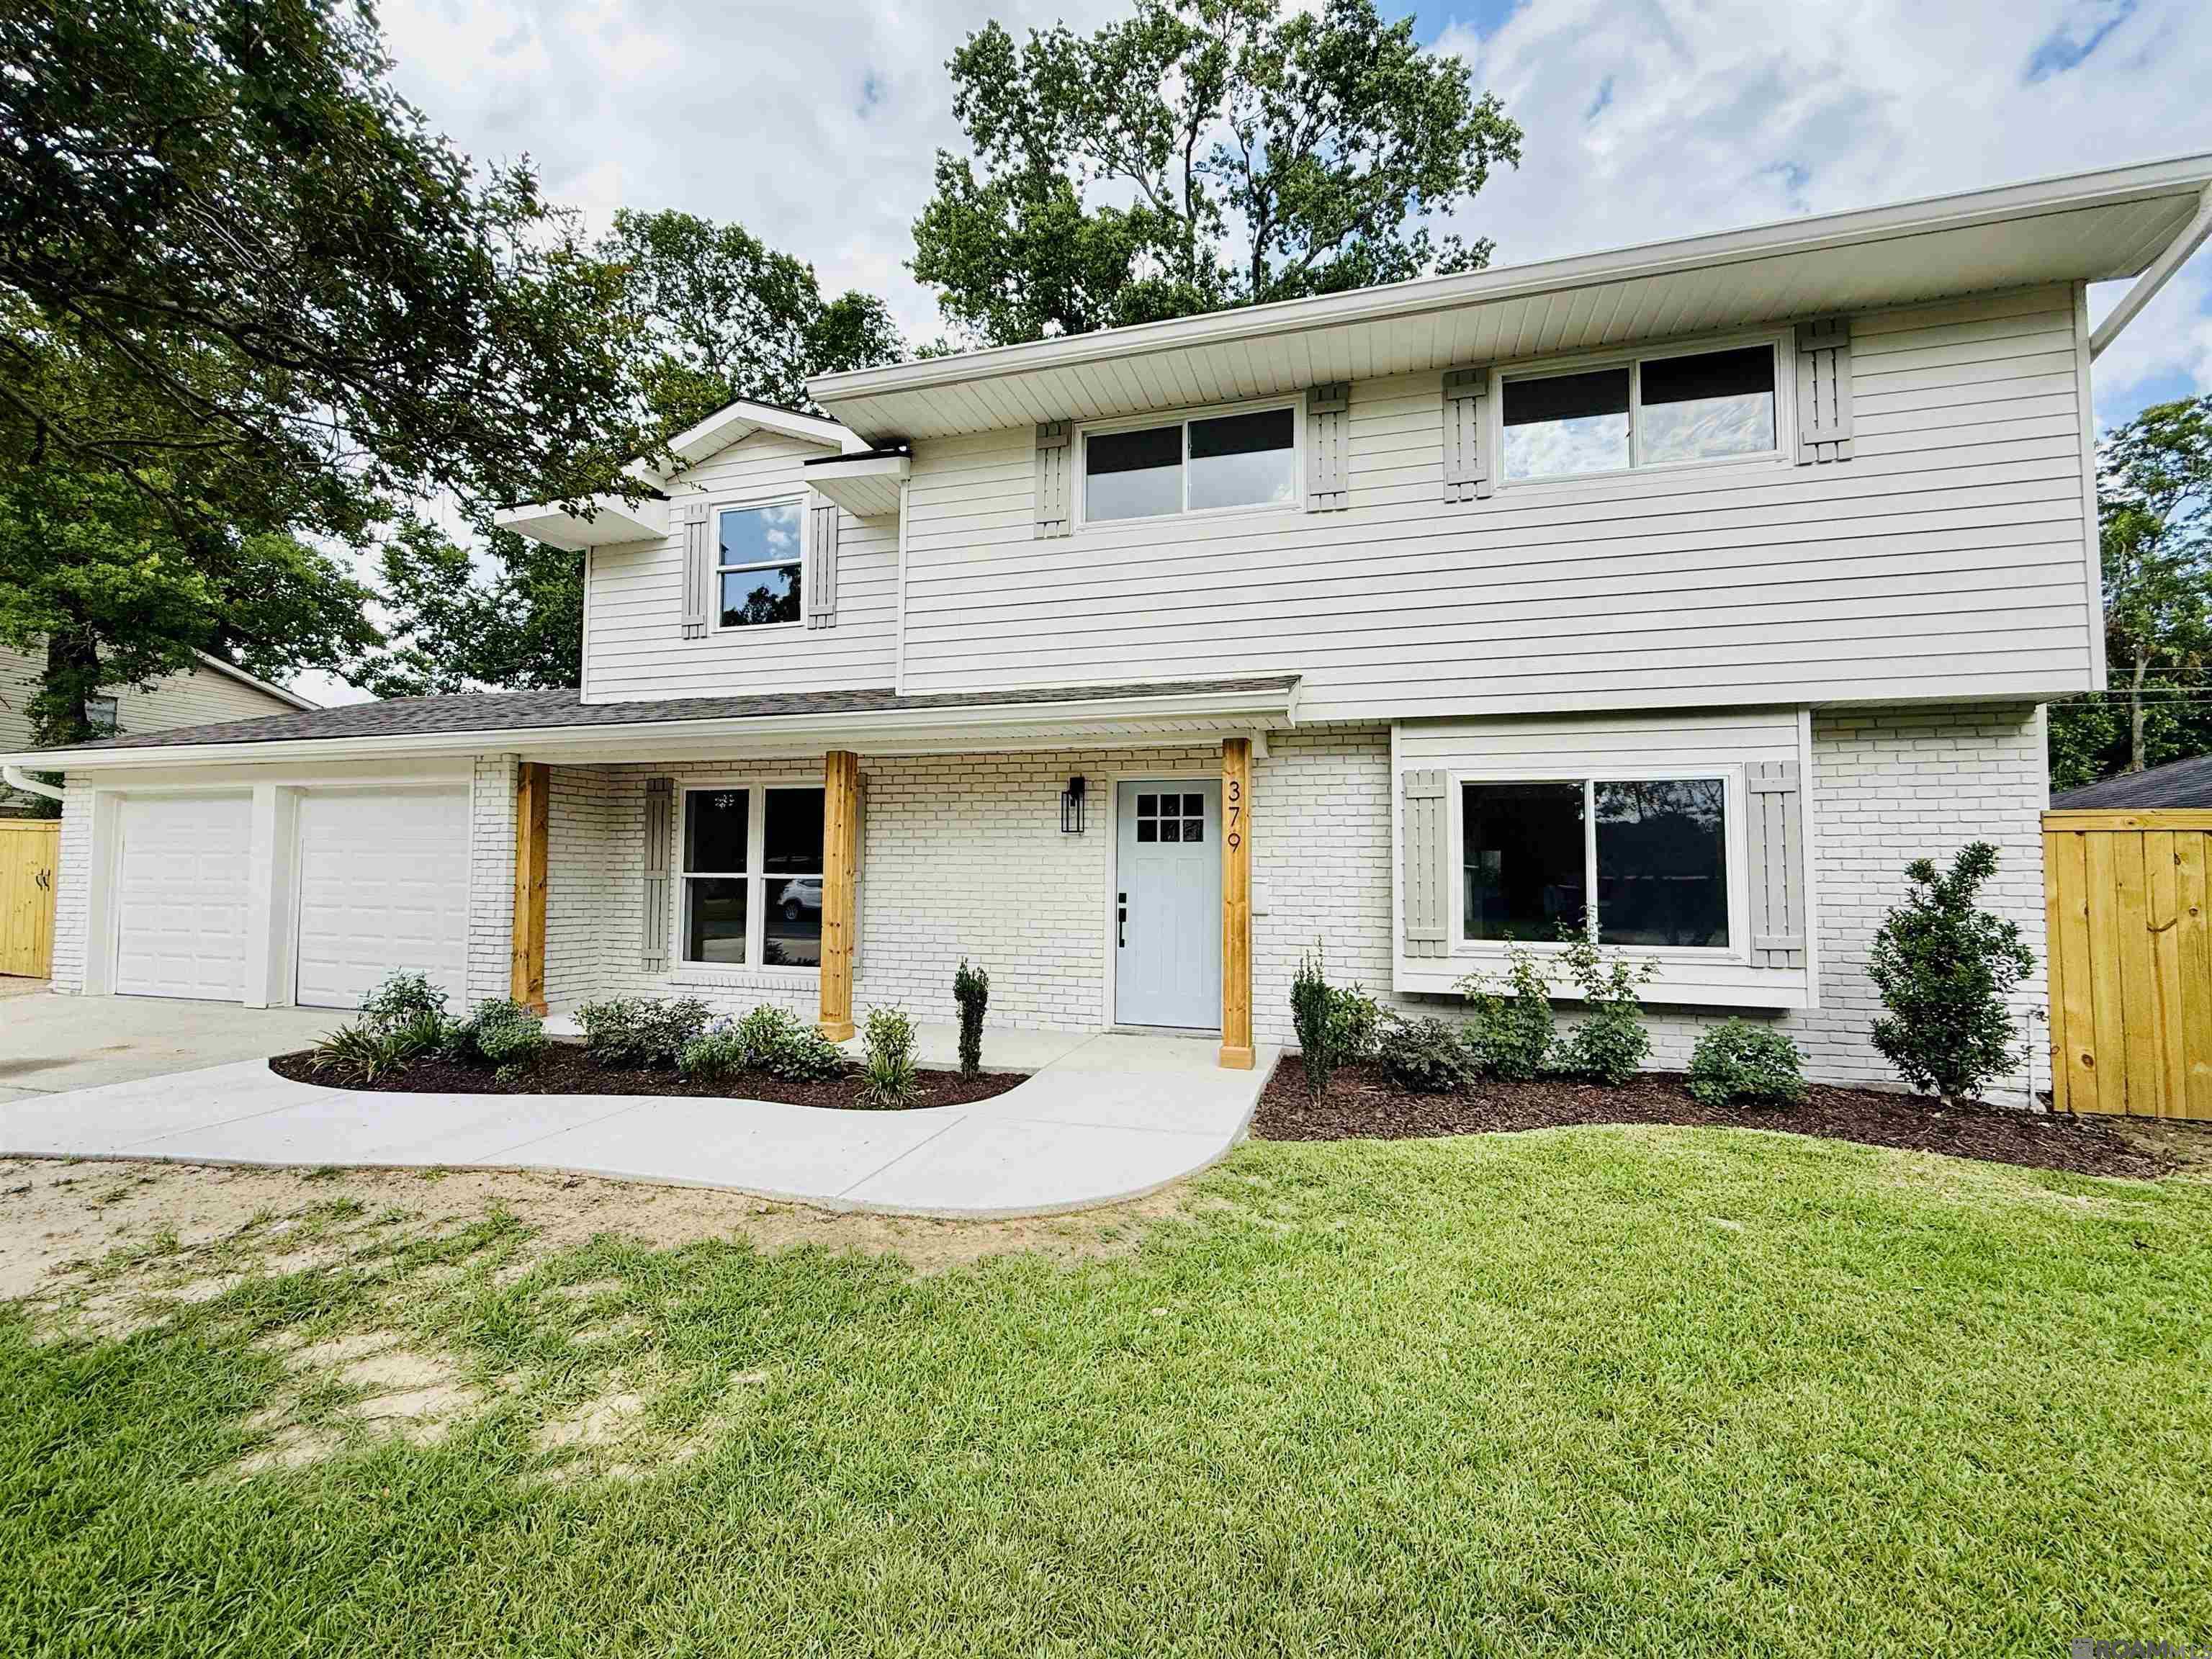
Active
$315,000
4
bds
|
3
ba
|
2,419
sqft
|
built
1965
379 Wilton Dr, Baton Rouge, LA 70815
$-270
Cash flow
-4.5%
Cash-on-Cash Return
5.3%
Cap rate
0.6%
Rent to Value Ratio
Active
$250,000
4
bds
|
2
ba
|
2,086
sqft
|
built
1970
9978 W Tams Dr, Baton Rouge, LA 70815
$2
Cash flow
0.0%
Cash-on-Cash Return
6.3%
Cap rate
0.8%
Rent to Value Ratio
Pending
$189,000
2
bds
|
2
ba
|
1,443
sqft
|
built
1981
2017 Shire Ln, Baton Rouge, LA 70810
$114
Cash flow
3.1%
Cash-on-Cash Return
7.0%
Cap rate
0.8%
Rent to Value Ratio
Active
$295,000
3
bds
|
2
ba
|
1,482
sqft
|
built
2002
10509 Springrose Ave, Baton Rouge, LA 70810
$-198
Cash flow
-3.5%
Cash-on-Cash Return
5.5%
Cap rate
0.7%
Rent to Value Ratio
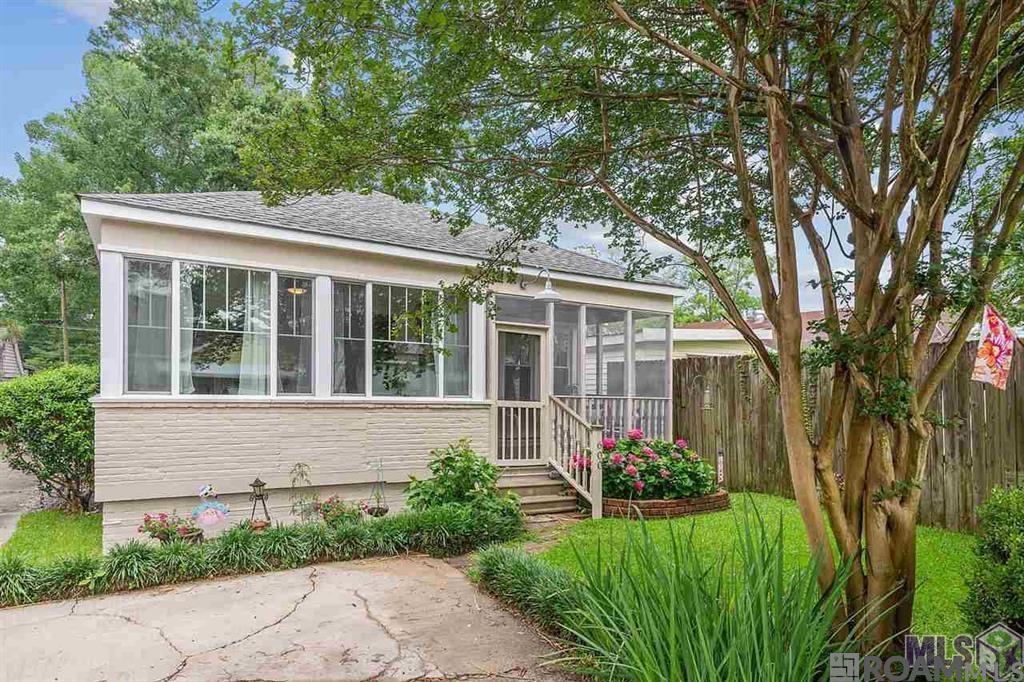
Active
$299,000
2
bds
|
2
ba
|
1,339
sqft
|
built
1950
600 Blanchard St, Baton Rouge, LA 70806
$-324
Cash flow
-5.7%
Cash-on-Cash Return
5.0%
Cap rate
0.6%
Rent to Value Ratio
Active
$145,000
3
bds
|
1
ba
|
1,937
sqft
|
built
1980
4314 Evangeline St, Baton Rouge, LA 70805
$414
Cash flow
14.9%
Cash-on-Cash Return
9.7%
Cap rate
1.2%
Rent to Value Ratio
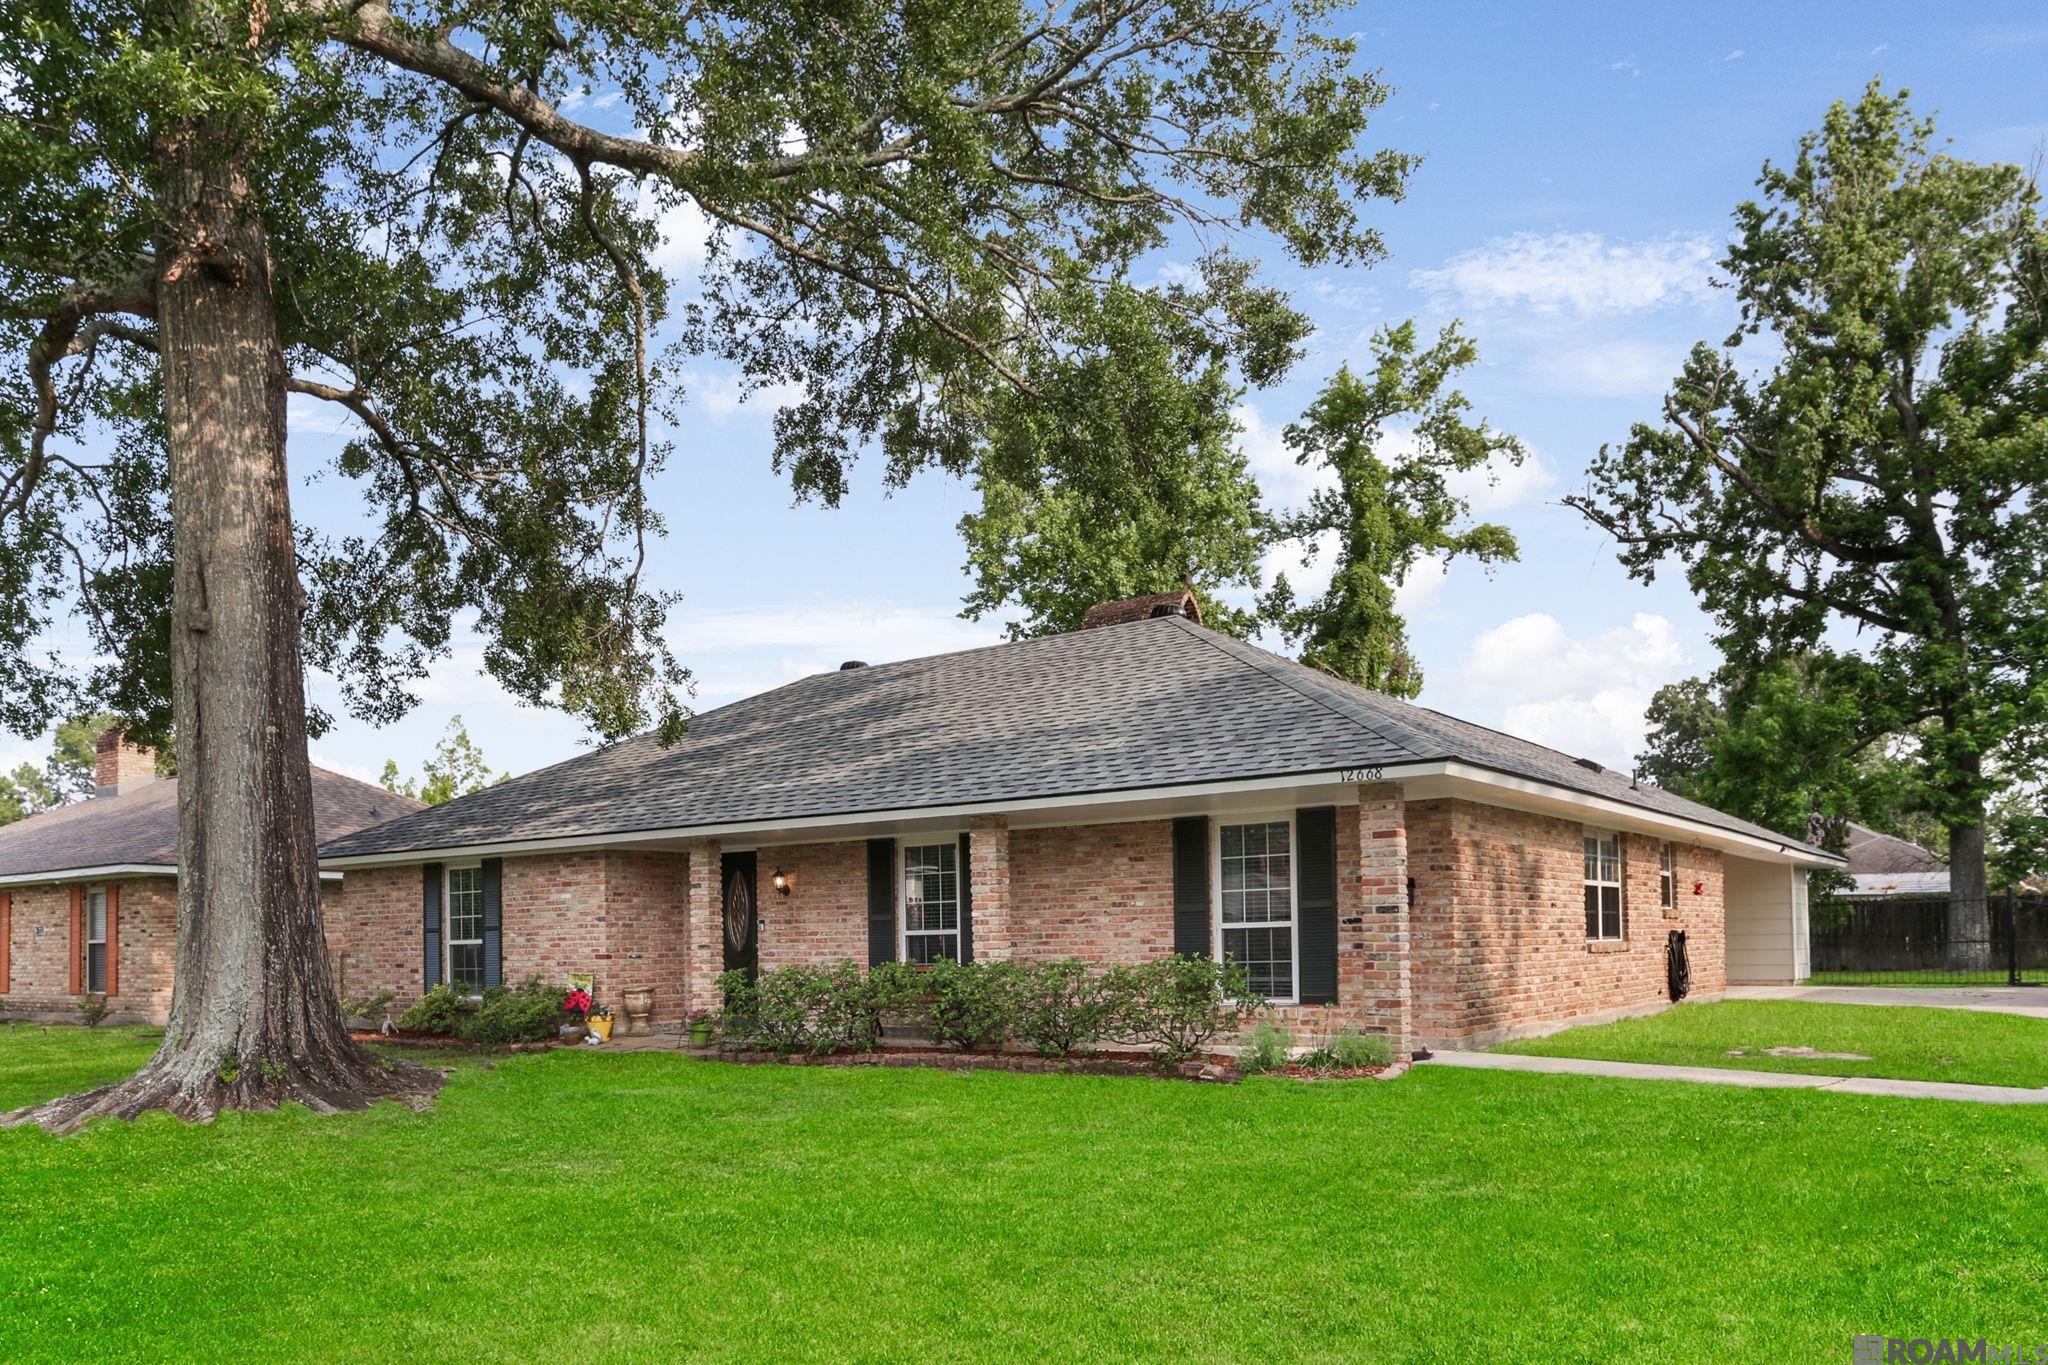
Active
$274,900
3
bds
|
2
ba
|
1,917
sqft
|
built
1970
12668 Mollylea Dr, Baton Rouge, LA 70815
$-64
Cash flow
-1.2%
Cash-on-Cash Return
6.0%
Cap rate
0.7%
Rent to Value Ratio
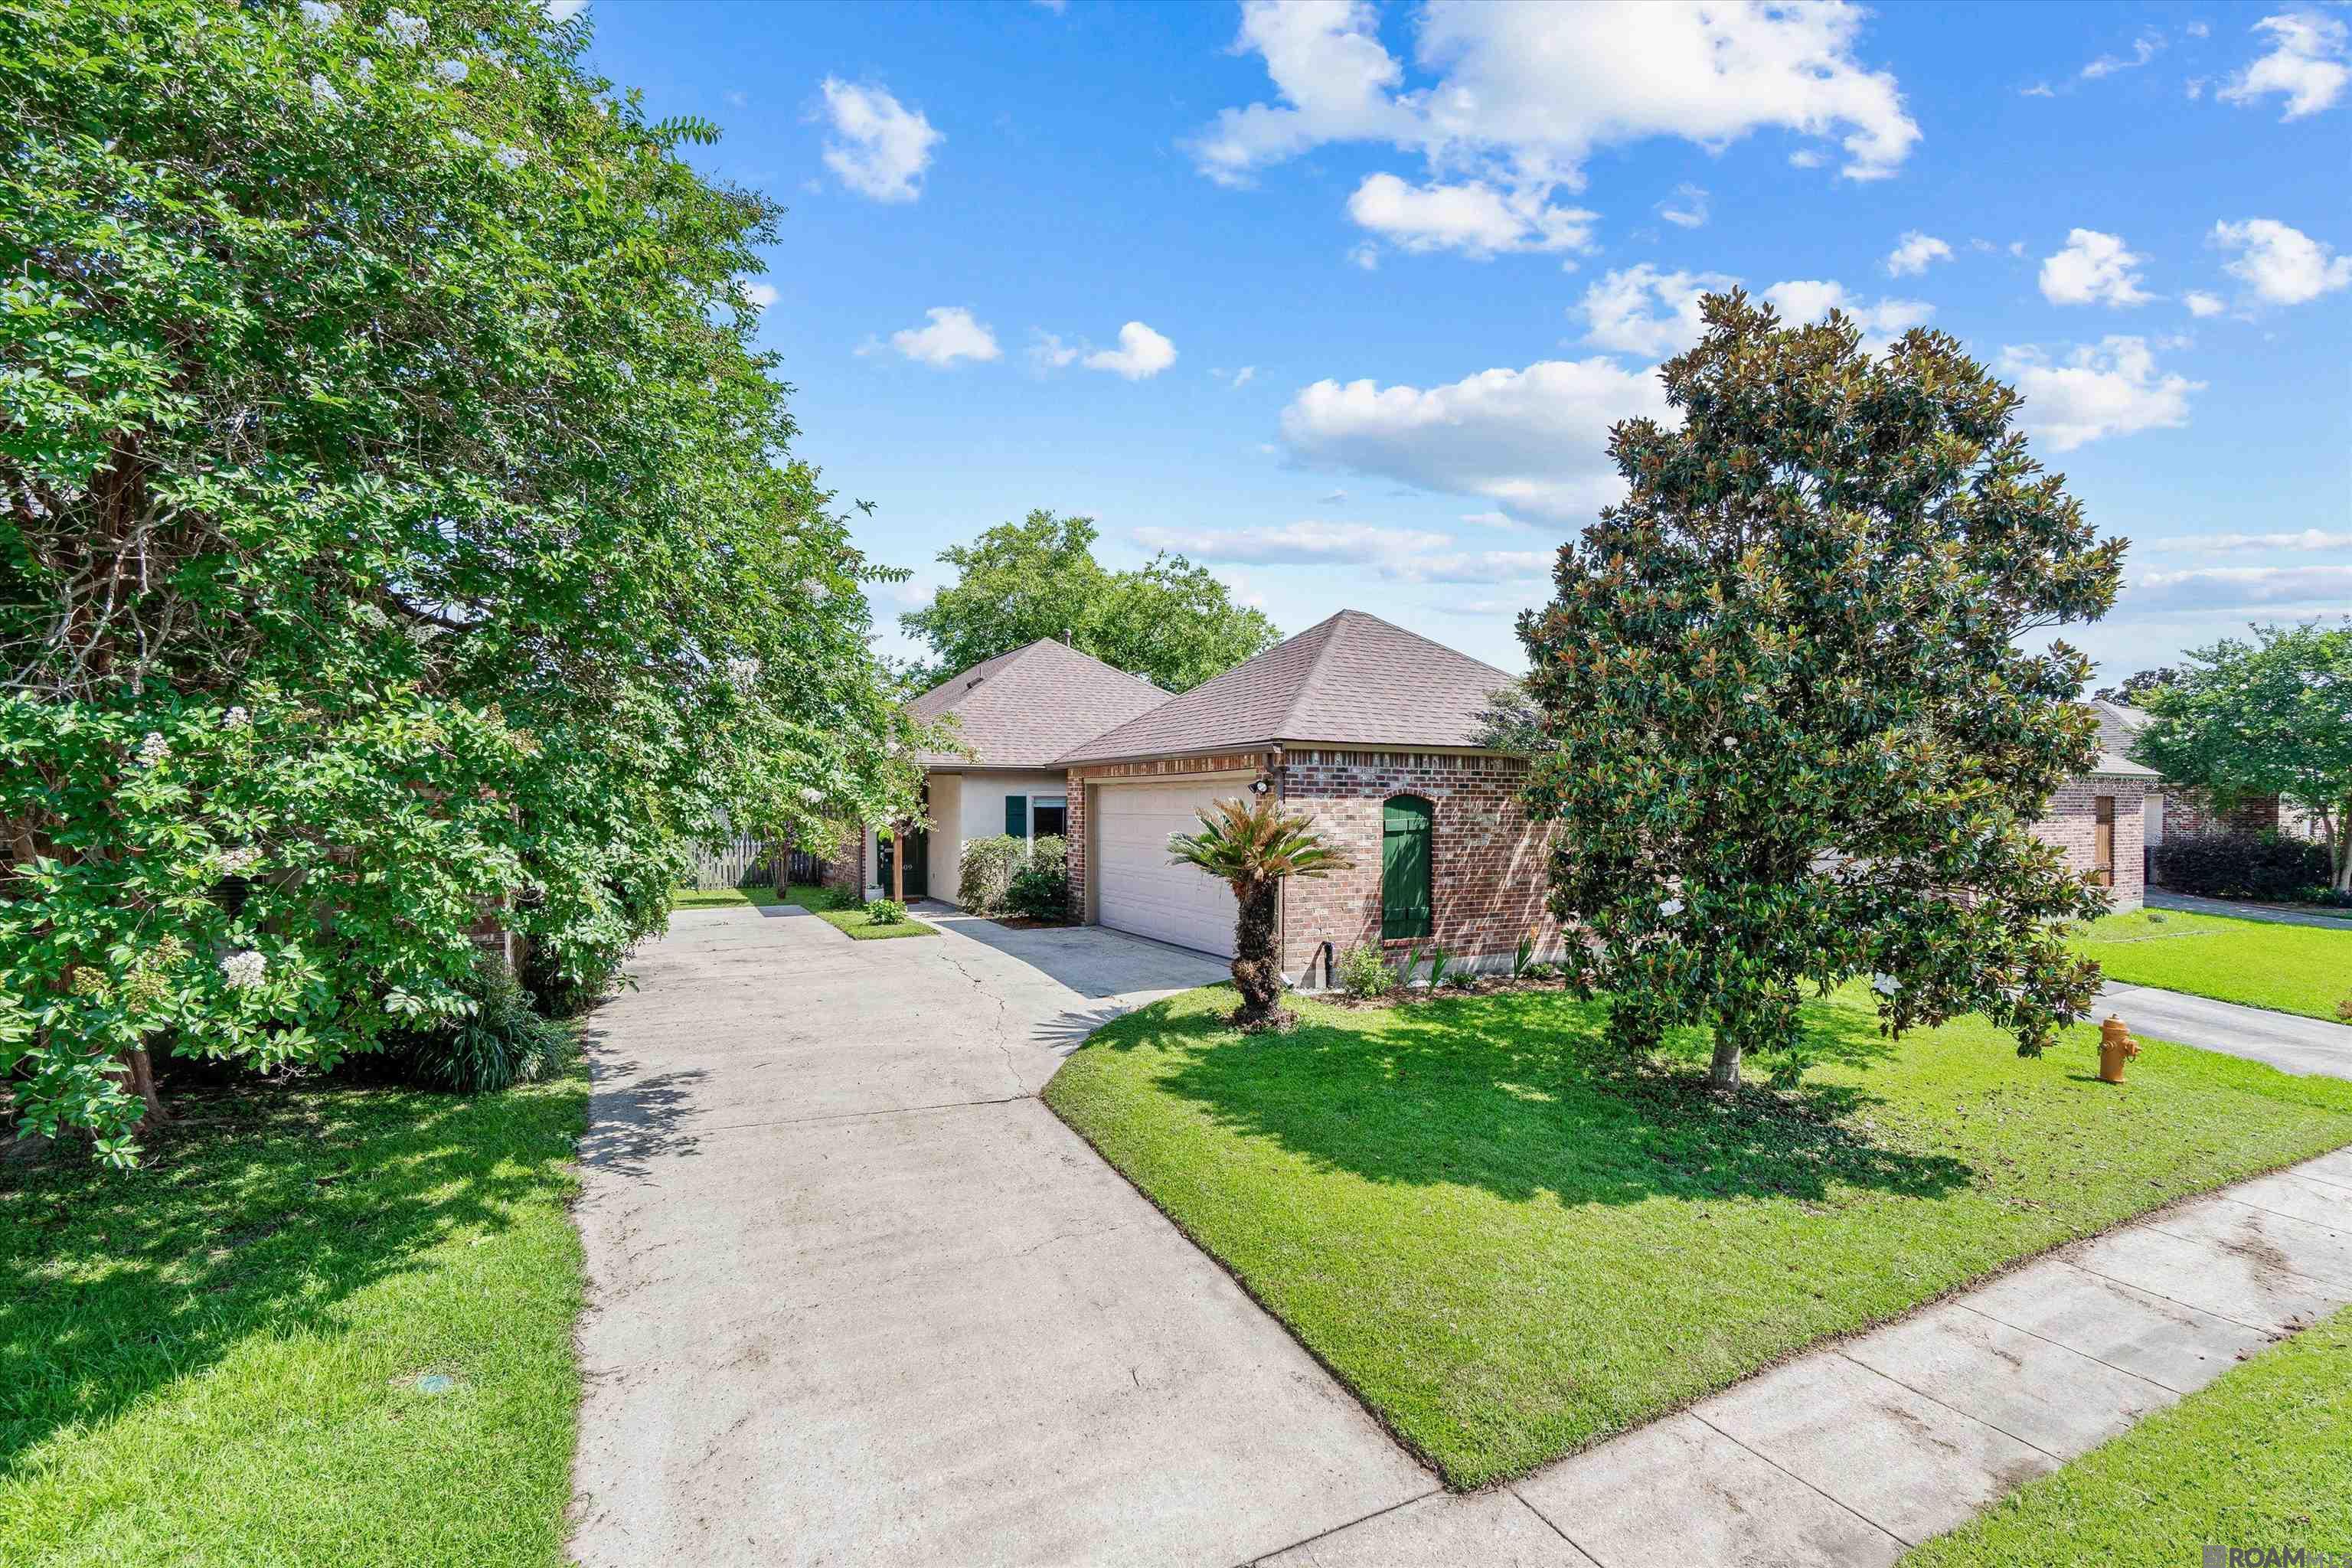
Active
$630,000
3
bds
|
2
ba
|
2,427
sqft
|
built
2002
1020 Cyril Ave, Baton Rouge, LA 70806
$-1,505
Cash flow
-12.5%
Cash-on-Cash Return
3.4%
Cap rate
0.4%
Rent to Value Ratio
Active
$370,000
4
bds
|
2
ba
|
2,315
sqft
|
built
1985
5487 Hagerstown Dr, Baton Rouge, LA 70817
$-282
Cash flow
-4.0%
Cash-on-Cash Return
5.4%
Cap rate
0.6%
Rent to Value Ratio
Active
$350,000
4
bds
|
3
ba
|
2,159
sqft
|
built
2021
13930 Keever Ave, Baton Rouge, LA 70817
$37
Cash flow
0.6%
Cash-on-Cash Return
6.4%
Cap rate
0.8%
Rent to Value Ratio
Active
$1,330,000
4
bds
|
5
ba
|
4,464
sqft
|
built
2007
4509 Bluebonnet Rd, Baton Rouge, LA 70809
$-2,687
Cash flow
-10.5%
Cash-on-Cash Return
3.9%
Cap rate
0.5%
Rent to Value Ratio
Pending
$115,000
3
bds
|
2
ba
|
1,687
sqft
|
built
1959
347 Nassau Dr, Baton Rouge, LA 70815
$502
Cash flow
22.8%
Cash-on-Cash Return
11.5%
Cap rate
1.4%
Rent to Value Ratio
Active
$44,900
2
bds
|
1
ba
|
757
sqft
|
built
1985
2760 N Foster Dr, Baton Rouge, LA 70805
$828
Cash flow
21.5%
Cash-on-Cash Return
22.1%
Cap rate
2.7%
Rent to Value Ratio
Active
$85,000
bds
|
0
ba
|
3,150
sqft
|
built
1118 Convention St, Baton Rouge, LA 70802
$797
Cash flow
48.9%
Cash-on-Cash Return
17.5%
Cap rate
2.1%
Rent to Value Ratio

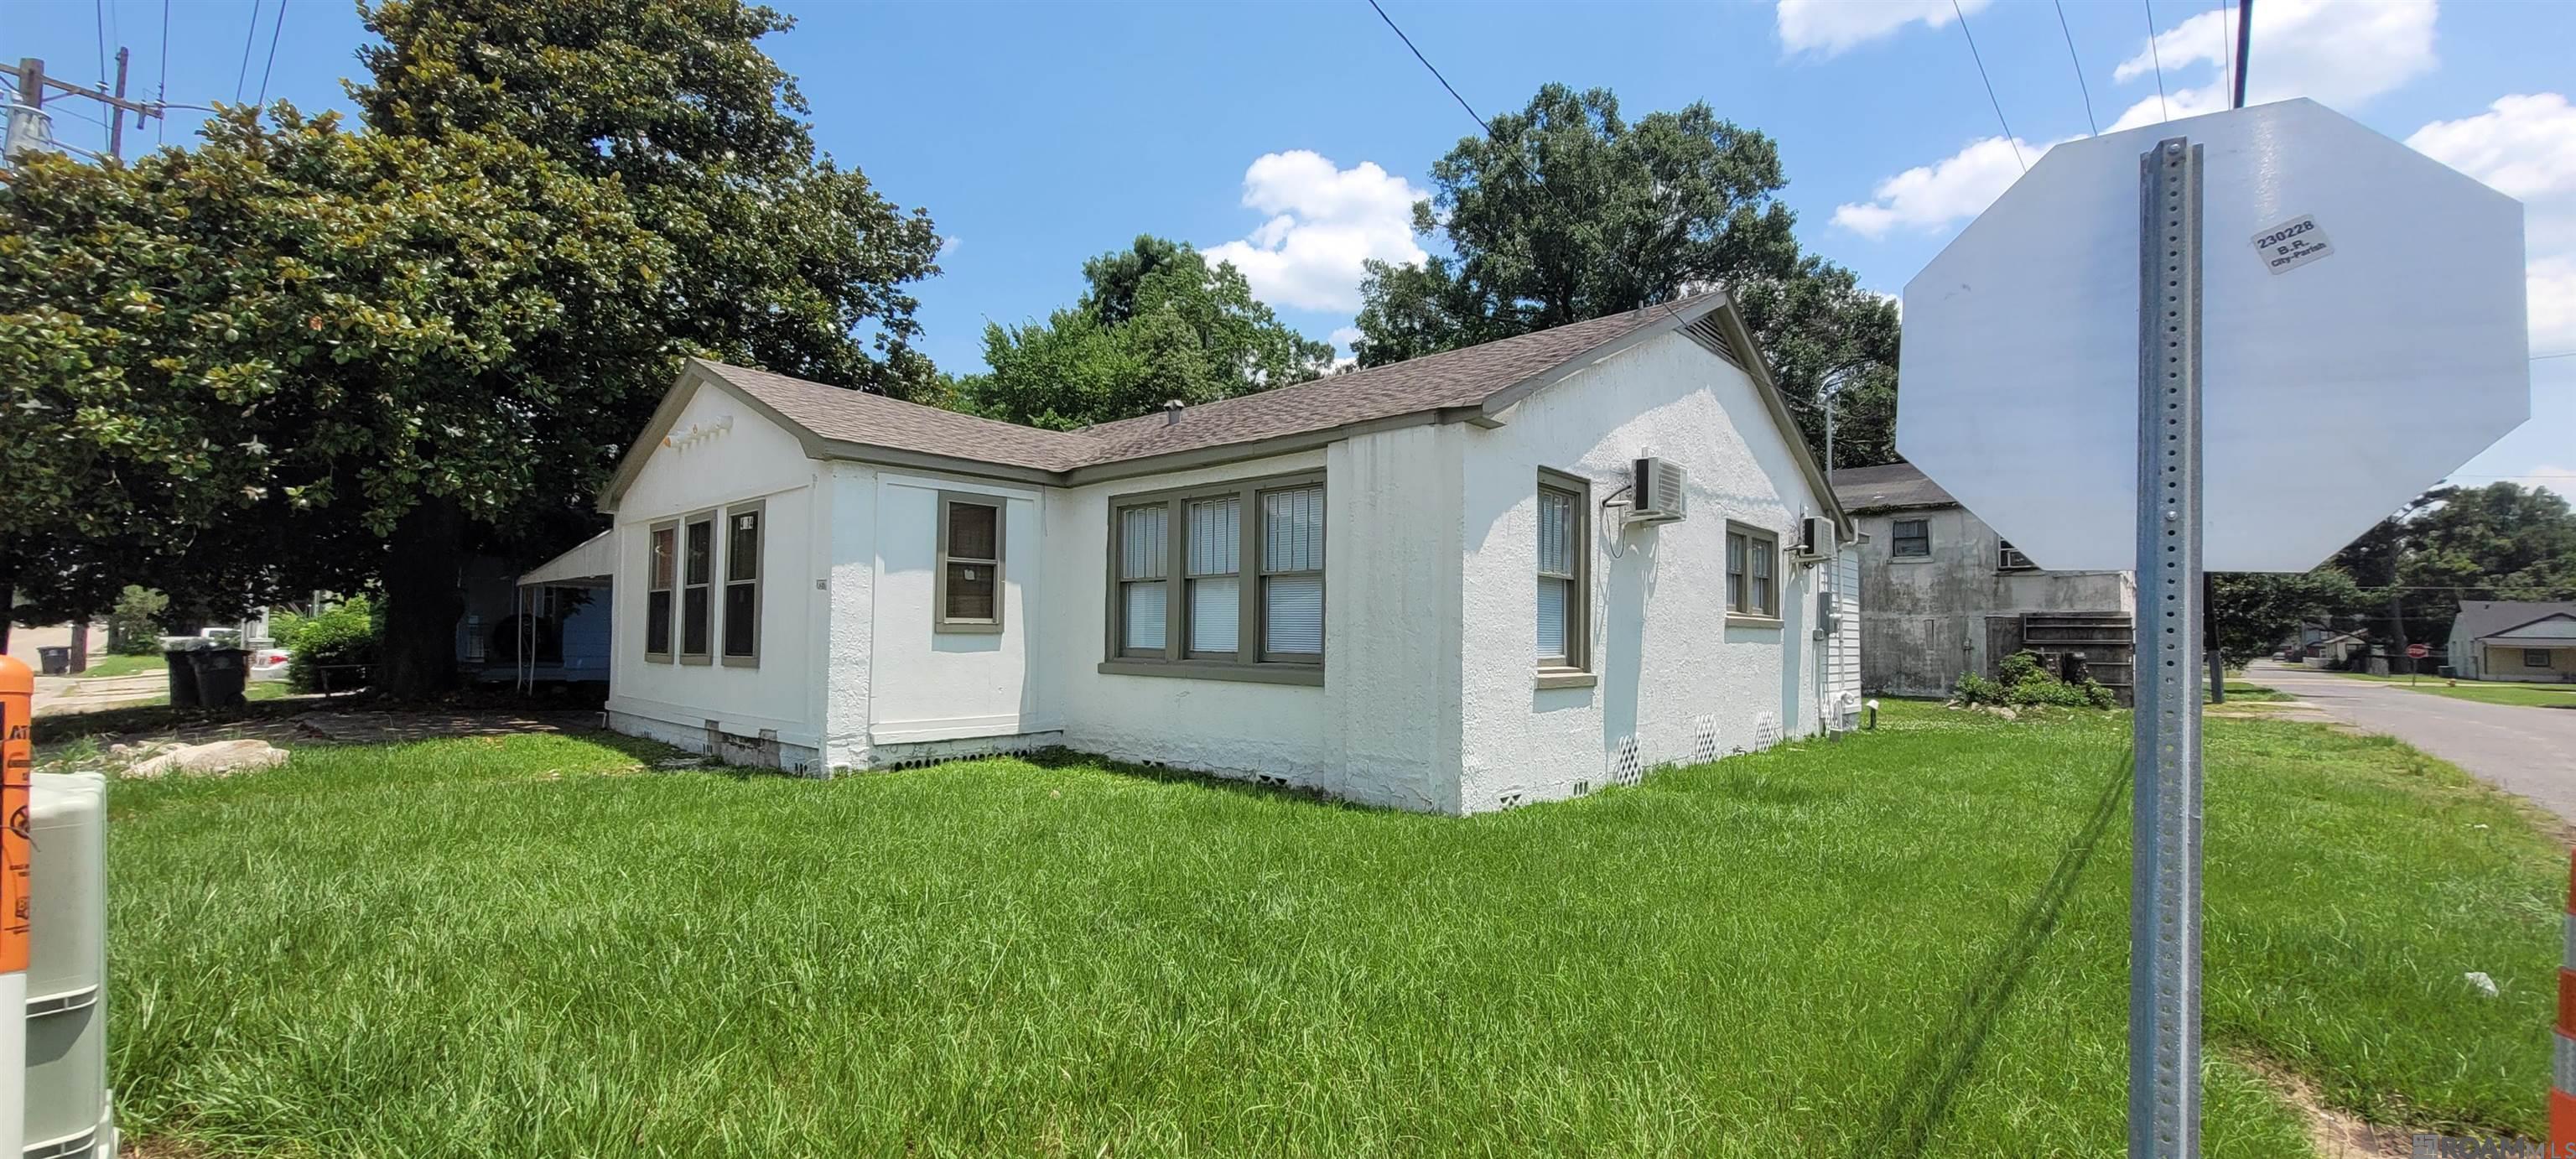
Active
$24,999
2
bds
|
1
ba
|
800
sqft
|
built
1980
1510 N Acadian Thruway E, Baton Rouge, LA 70802
$759
Cash flow
35.4%
Cash-on-Cash Return
36.4%
Cap rate
4.4%
Rent to Value Ratio

Active
$749,900
5
bds
|
5
ba
|
3,746
sqft
|
built
2006
3126 Laurel Plantation Ave, Baton Rouge, LA 70820
$-851
Cash flow
-5.9%
Cash-on-Cash Return
4.9%
Cap rate
0.6%
Rent to Value Ratio
Active
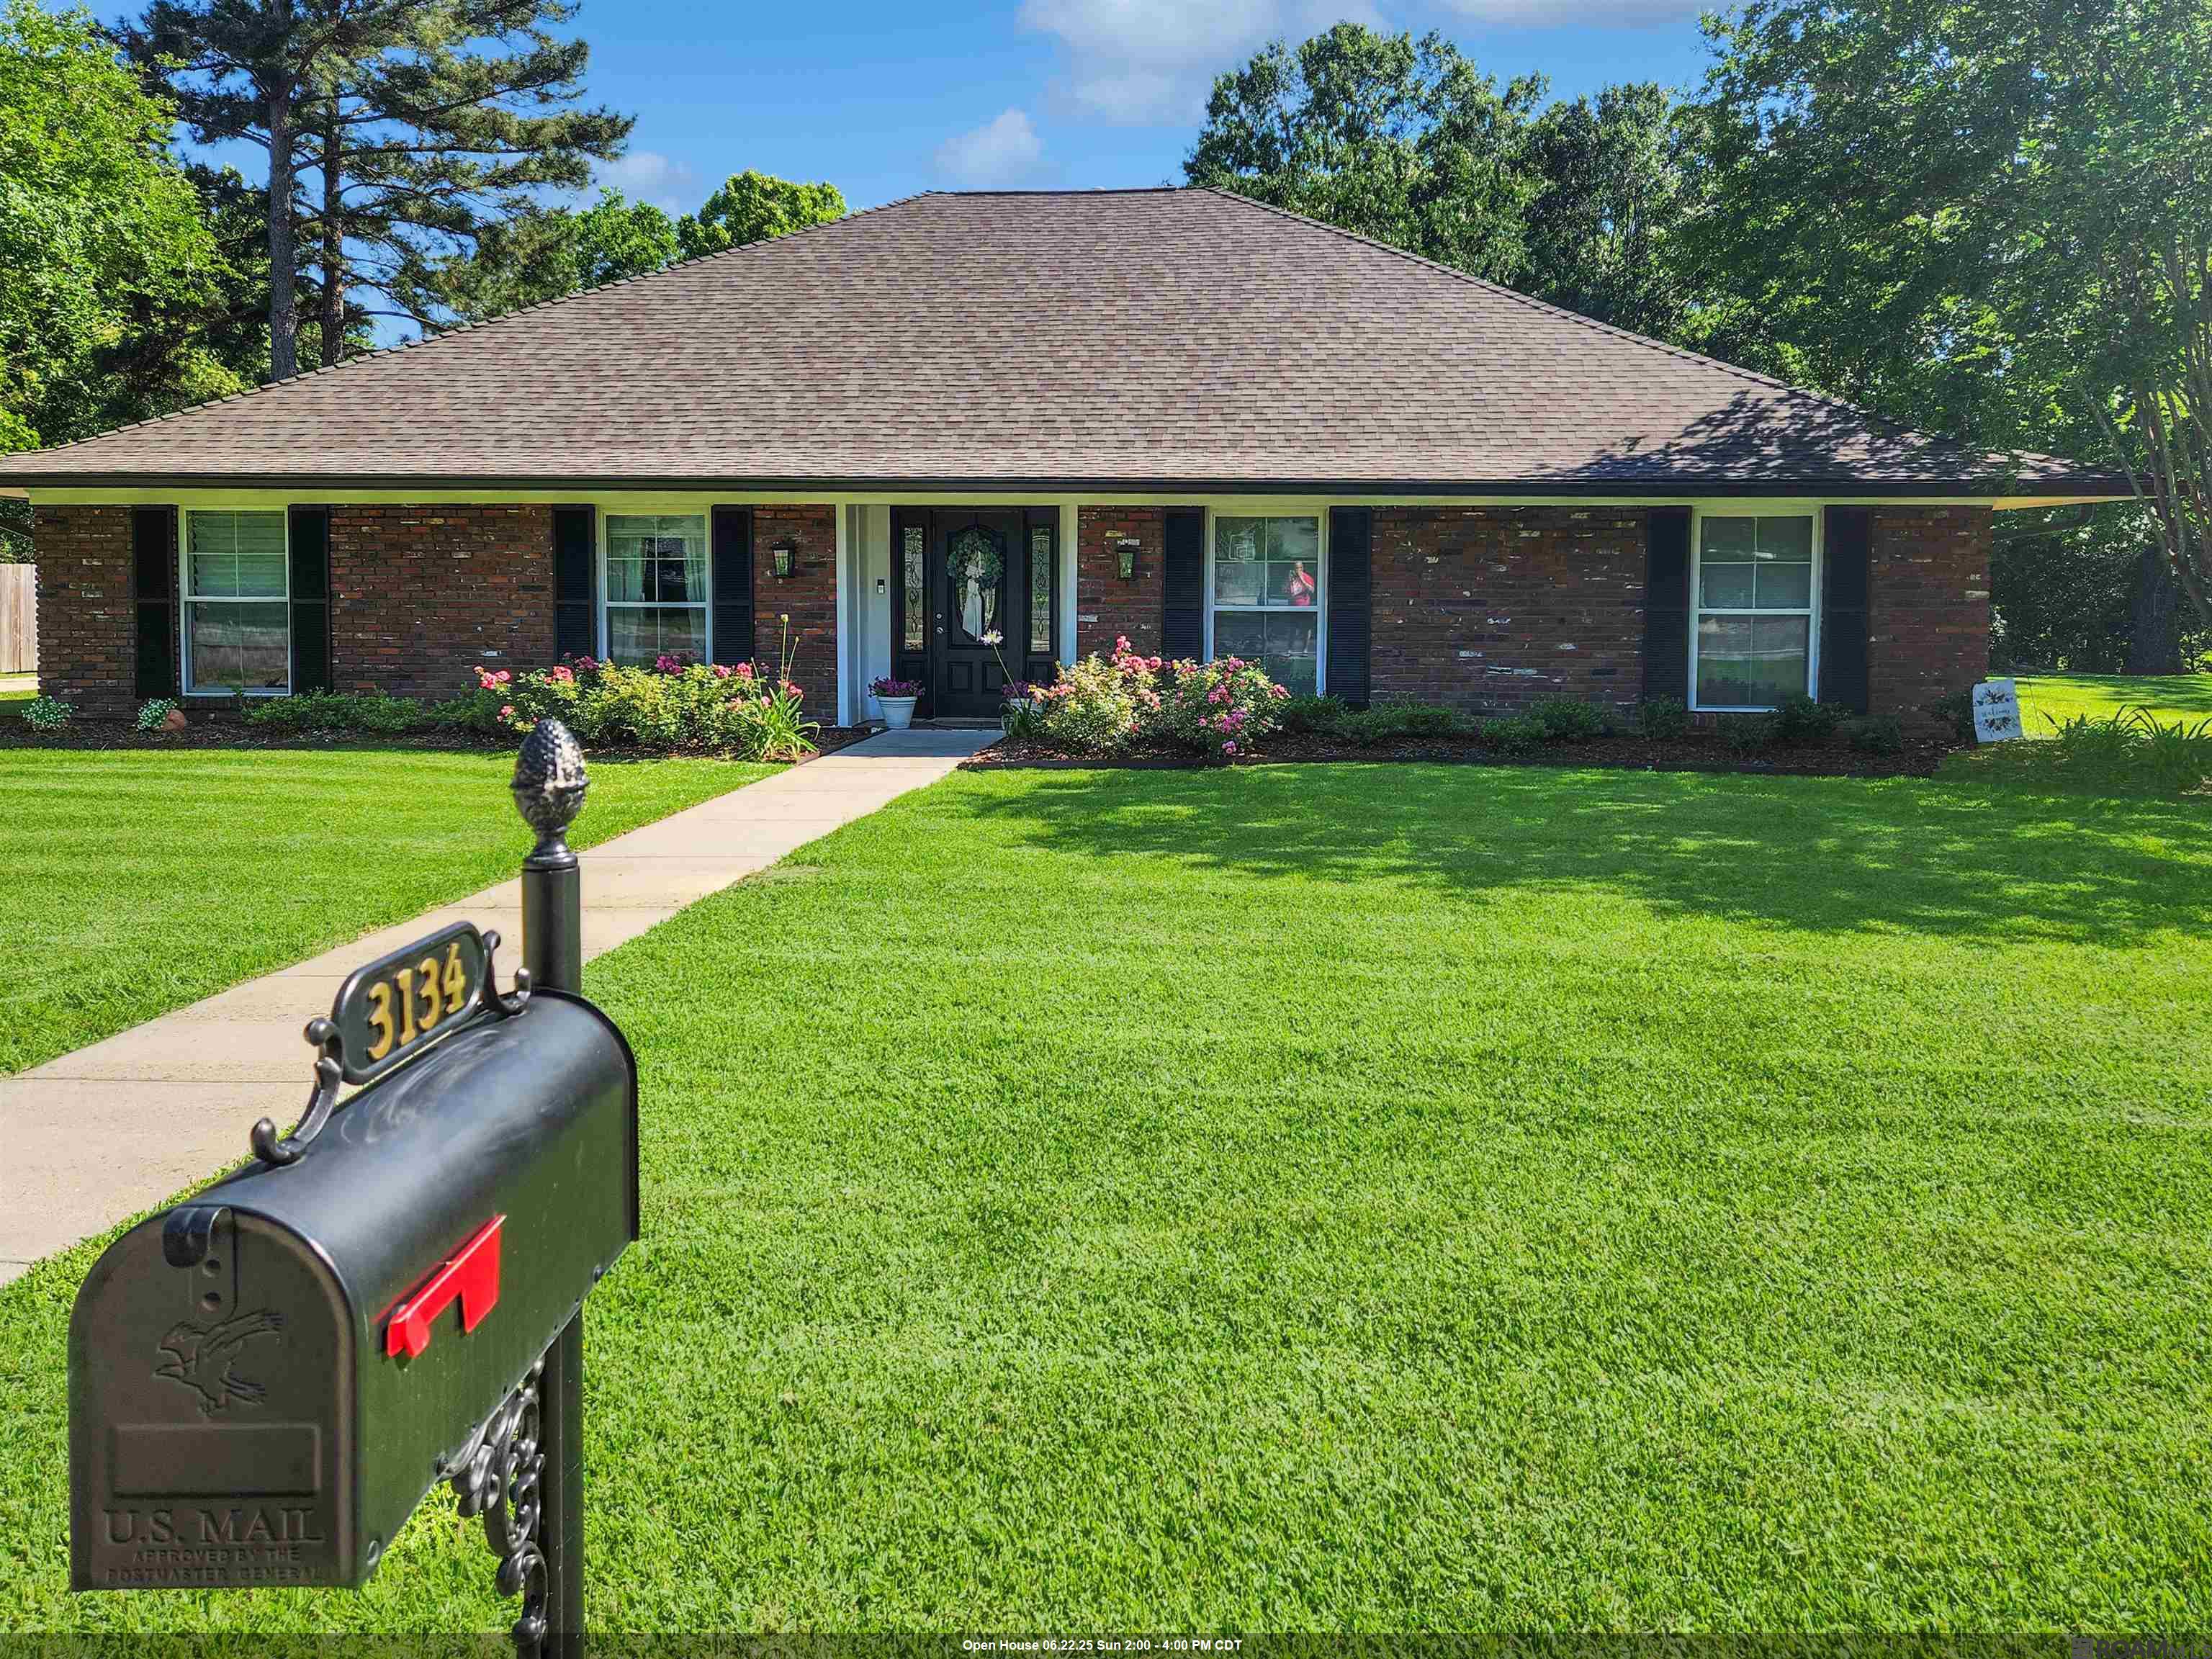
$370,000
4
bds
|
3
ba
|
2,815
sqft
|
built
1975
3134 Woodland Ridge Blvd, Baton Rouge, LA 70816
$-19
Cash flow
-0.3%
Cash-on-Cash Return
6.2%
Cap rate
0.8%
Rent to Value Ratio
Active
$260,000
3
bds
|
3
ba
|
2,087
sqft
|
built
1968
1658 S Elaine Dr, Baton Rouge, LA 70815
$18
Cash flow
0.4%
Cash-on-Cash Return
6.4%
Cap rate
0.8%
Rent to Value Ratio
Active
$519,000
4
bds
|
3
ba
|
2,300
sqft
|
built
2023
4355 Boulonnais Ave, Baton Rouge, LA 70820
$2
Cash flow
0.0%
Cash-on-Cash Return
6.3%
Cap rate
0.8%
Rent to Value Ratio

Active
$325,000
4
bds
|
3
ba
|
2,173
sqft
|
built
1977
11111 Tynewood Ave, Baton Rouge, LA 70818
$-10
Cash flow
-0.2%
Cash-on-Cash Return
6.2%
Cap rate
0.8%
Rent to Value Ratio
Active
$129,900
3
bds
|
2
ba
|
2,016
sqft
|
built
1955
574 Louise St, Baton Rouge, LA 70802
$286
Cash flow
11.5%
Cash-on-Cash Return
8.9%
Cap rate
1.1%
Rent to Value Ratio
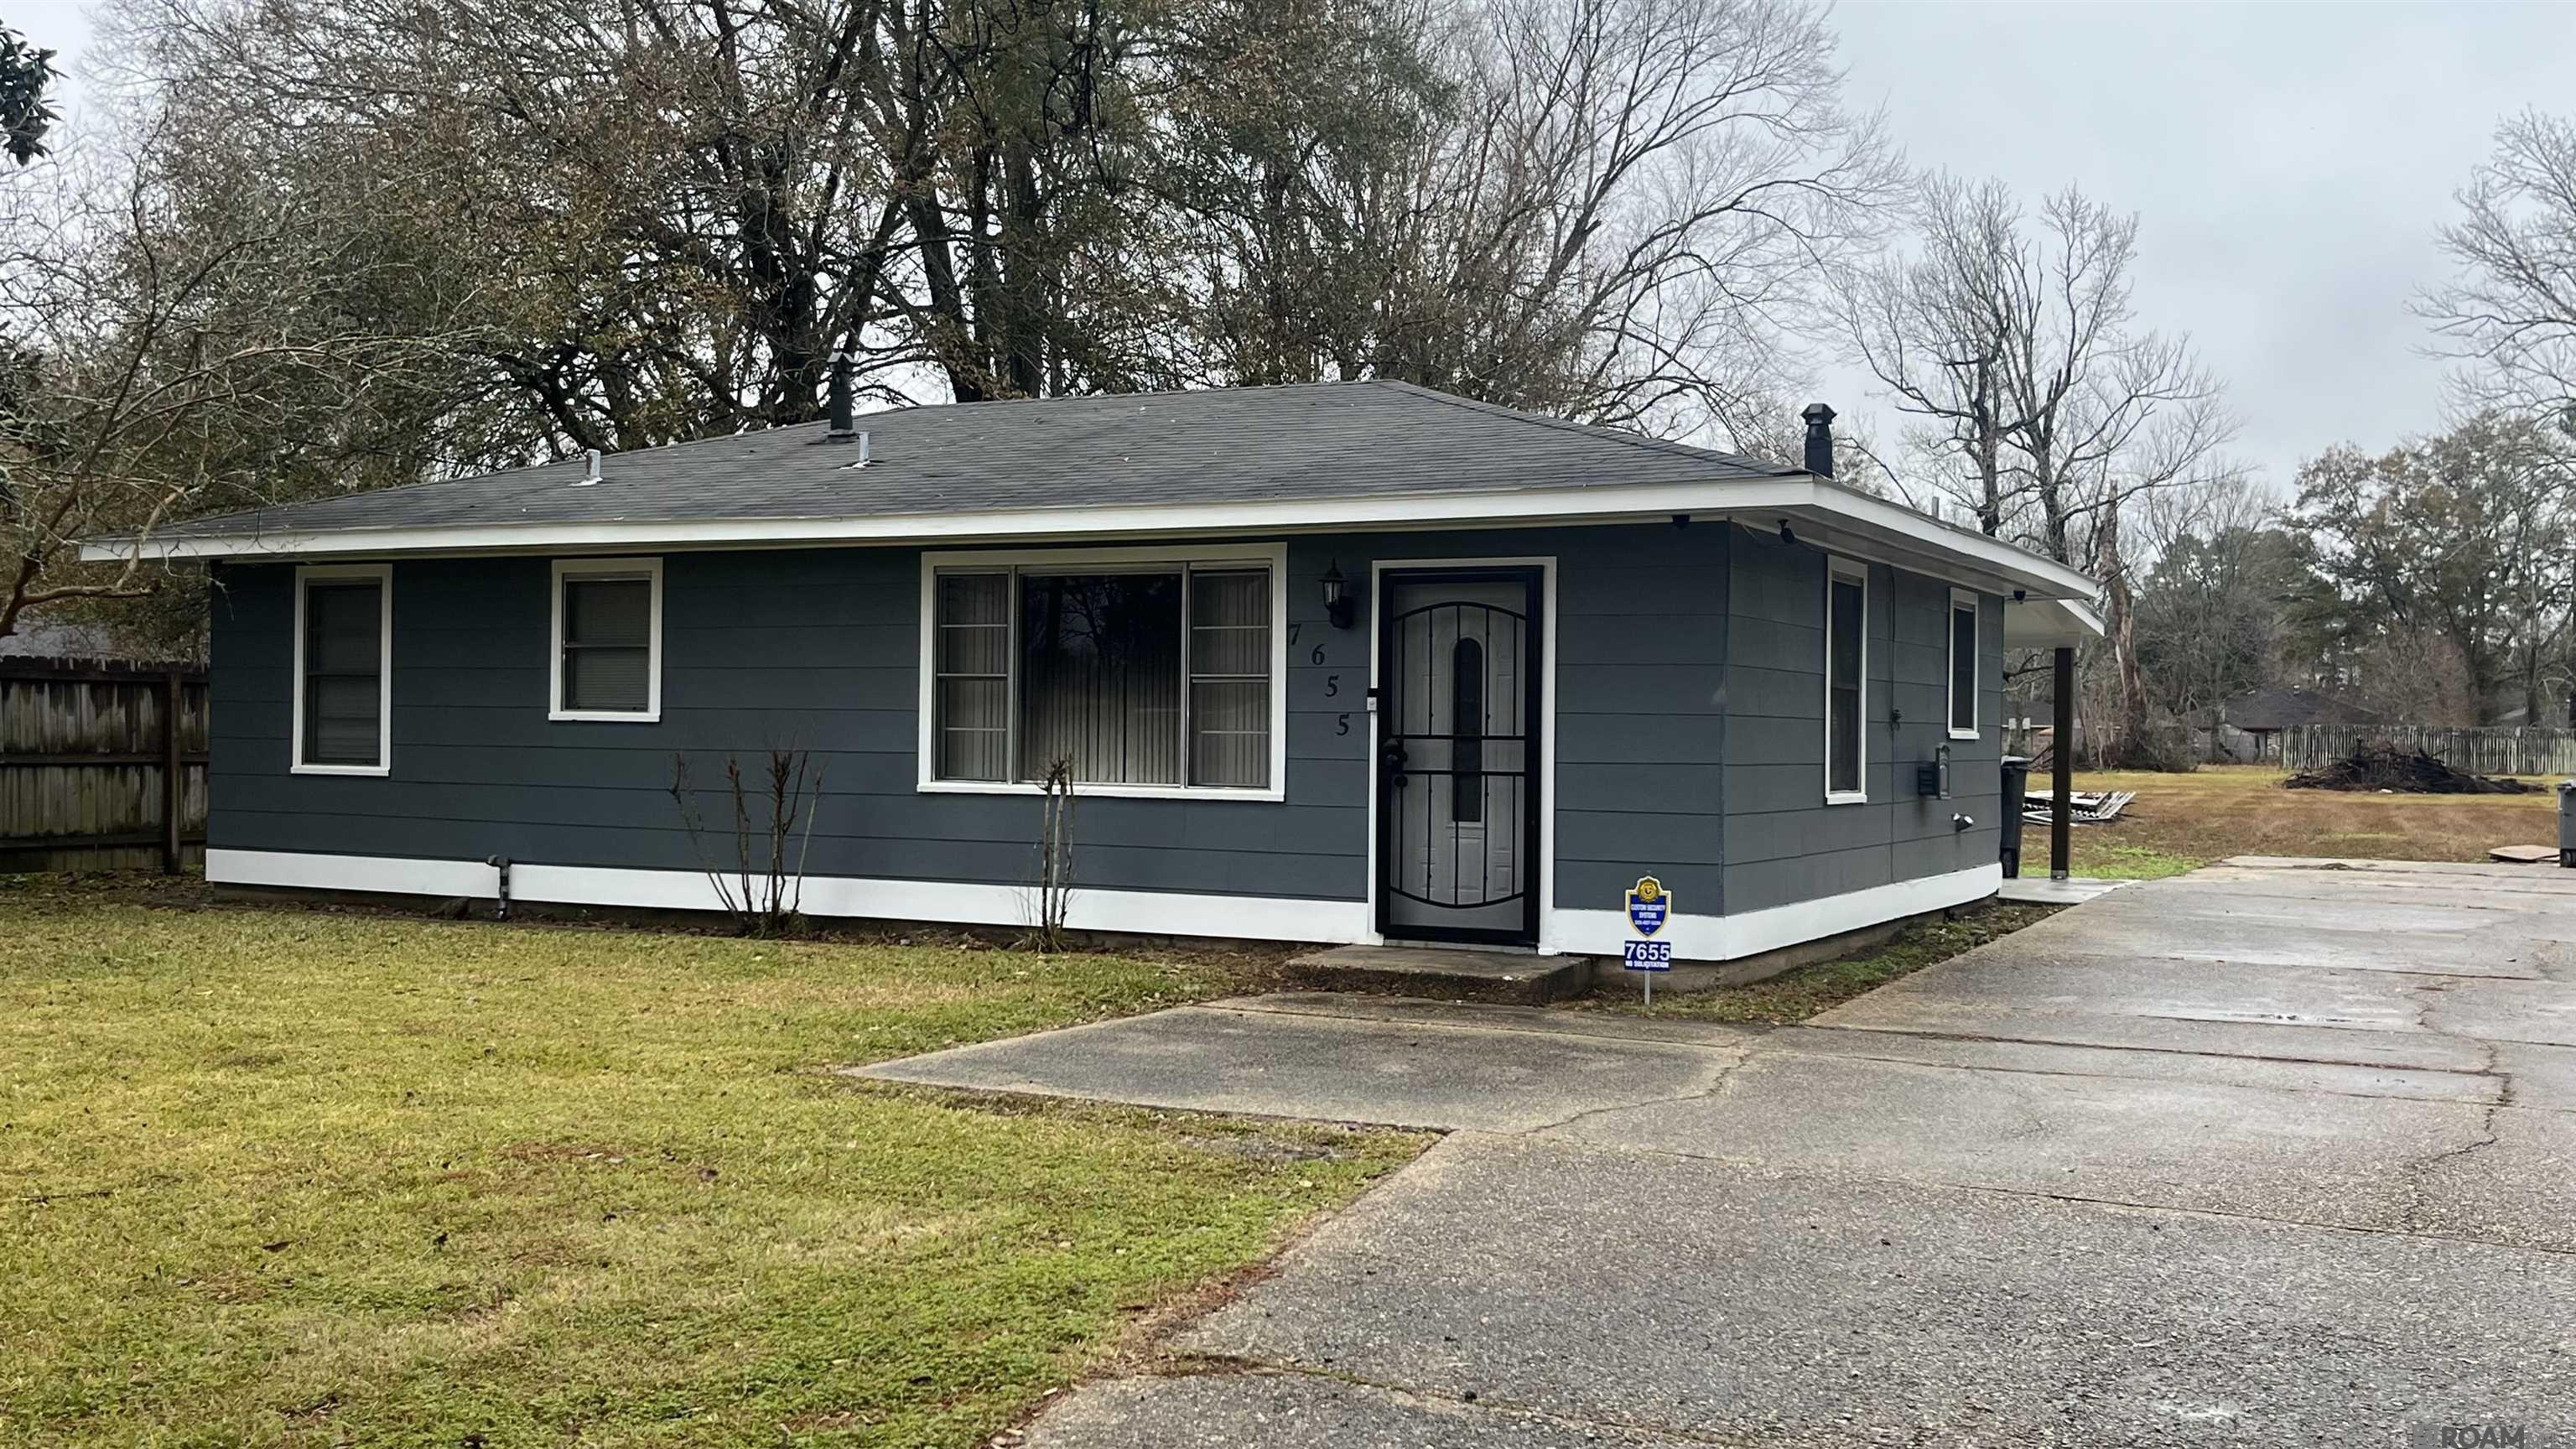
Active
$210,000
3
bds
|
1
ba
|
1,238
sqft
|
built
1950
7655 Hanks Dr, Baton Rouge, LA 70812
$-134
Cash flow
-3.3%
Cash-on-Cash Return
5.5%
Cap rate
0.7%
Rent to Value Ratio
Active
$220,000
4
bds
|
2
ba
|
1,994
sqft
|
built
1967
12360 Warwick Ave, Baton Rouge, LA 70815
$224
Cash flow
5.3%
Cash-on-Cash Return
7.5%
Cap rate
0.9%
Rent to Value Ratio
Active
$1,495,000
5
bds
|
4
ba
|
5,849
sqft
|
built
2005
2005 Laurel Lakes Ave, Baton Rouge, LA 70820
$-3,638
Cash flow
-12.7%
Cash-on-Cash Return
3.4%
Cap rate
0.4%
Rent to Value Ratio
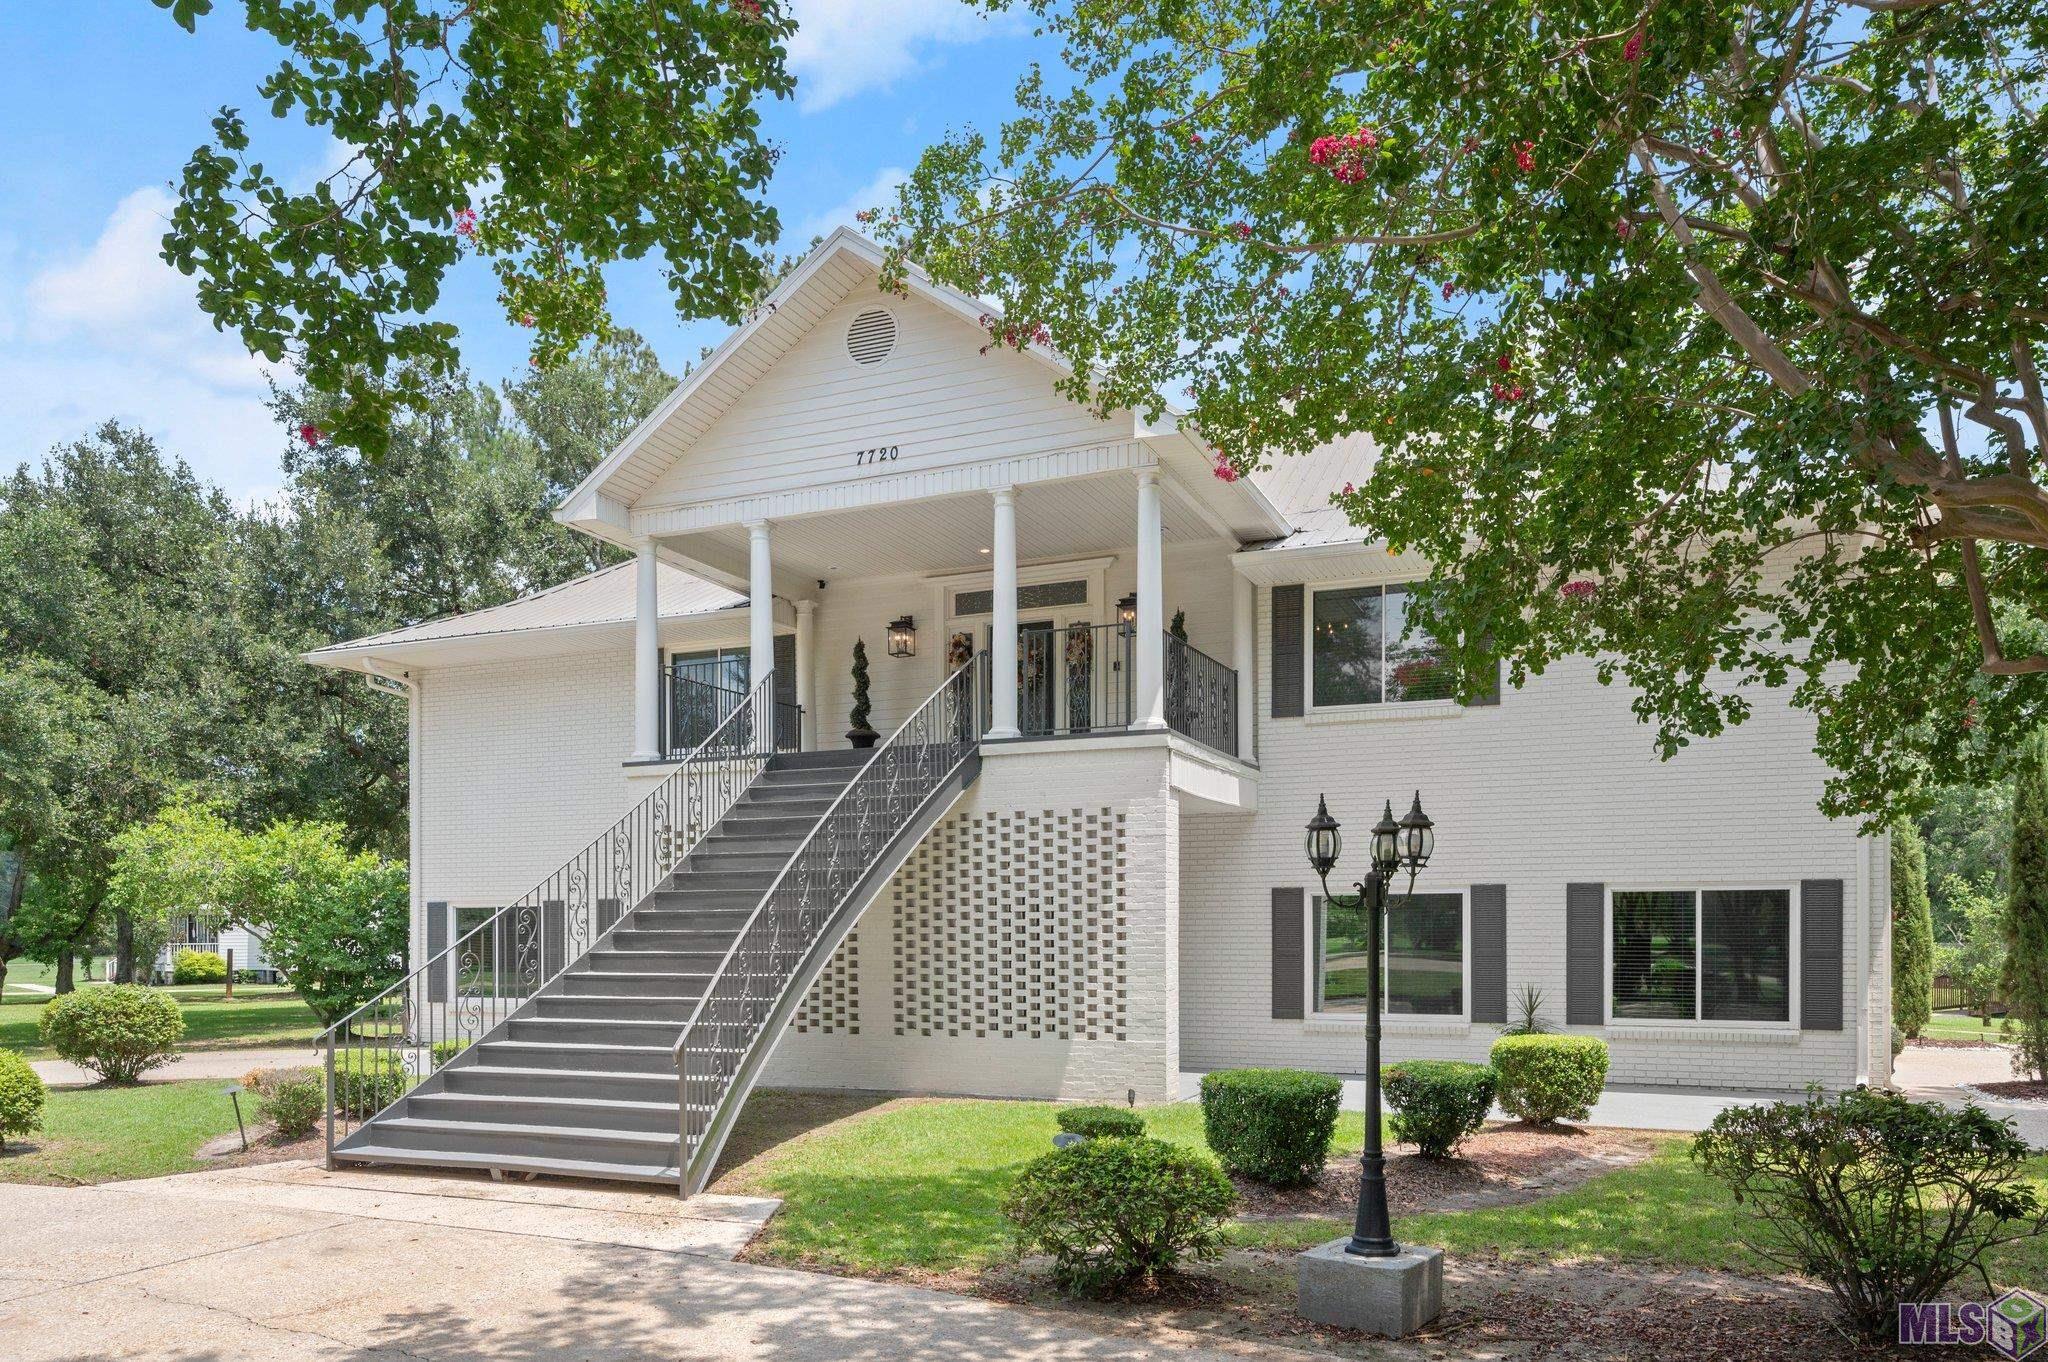
Active
$737,700
5
bds
|
4
ba
|
4,001
sqft
|
built
1986
7720 Brett Pl, Baton Rouge, LA 70818
$-758
Cash flow
-5.4%
Cash-on-Cash Return
5.1%
Cap rate
0.6%
Rent to Value Ratio
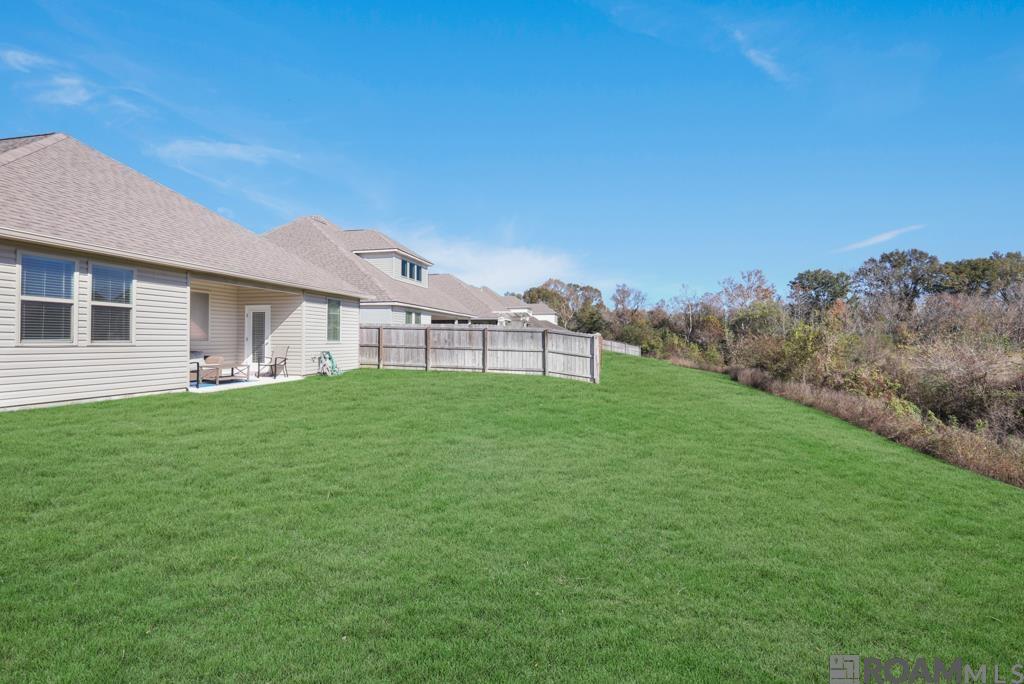
Active
$289,000
4
bds
|
2
ba
|
1,706
sqft
|
built
2021
4433 Mendocino Way, Baton Rouge, LA 70817
$-198
Cash flow
-3.6%
Cash-on-Cash Return
5.5%
Cap rate
0.7%
Rent to Value Ratio
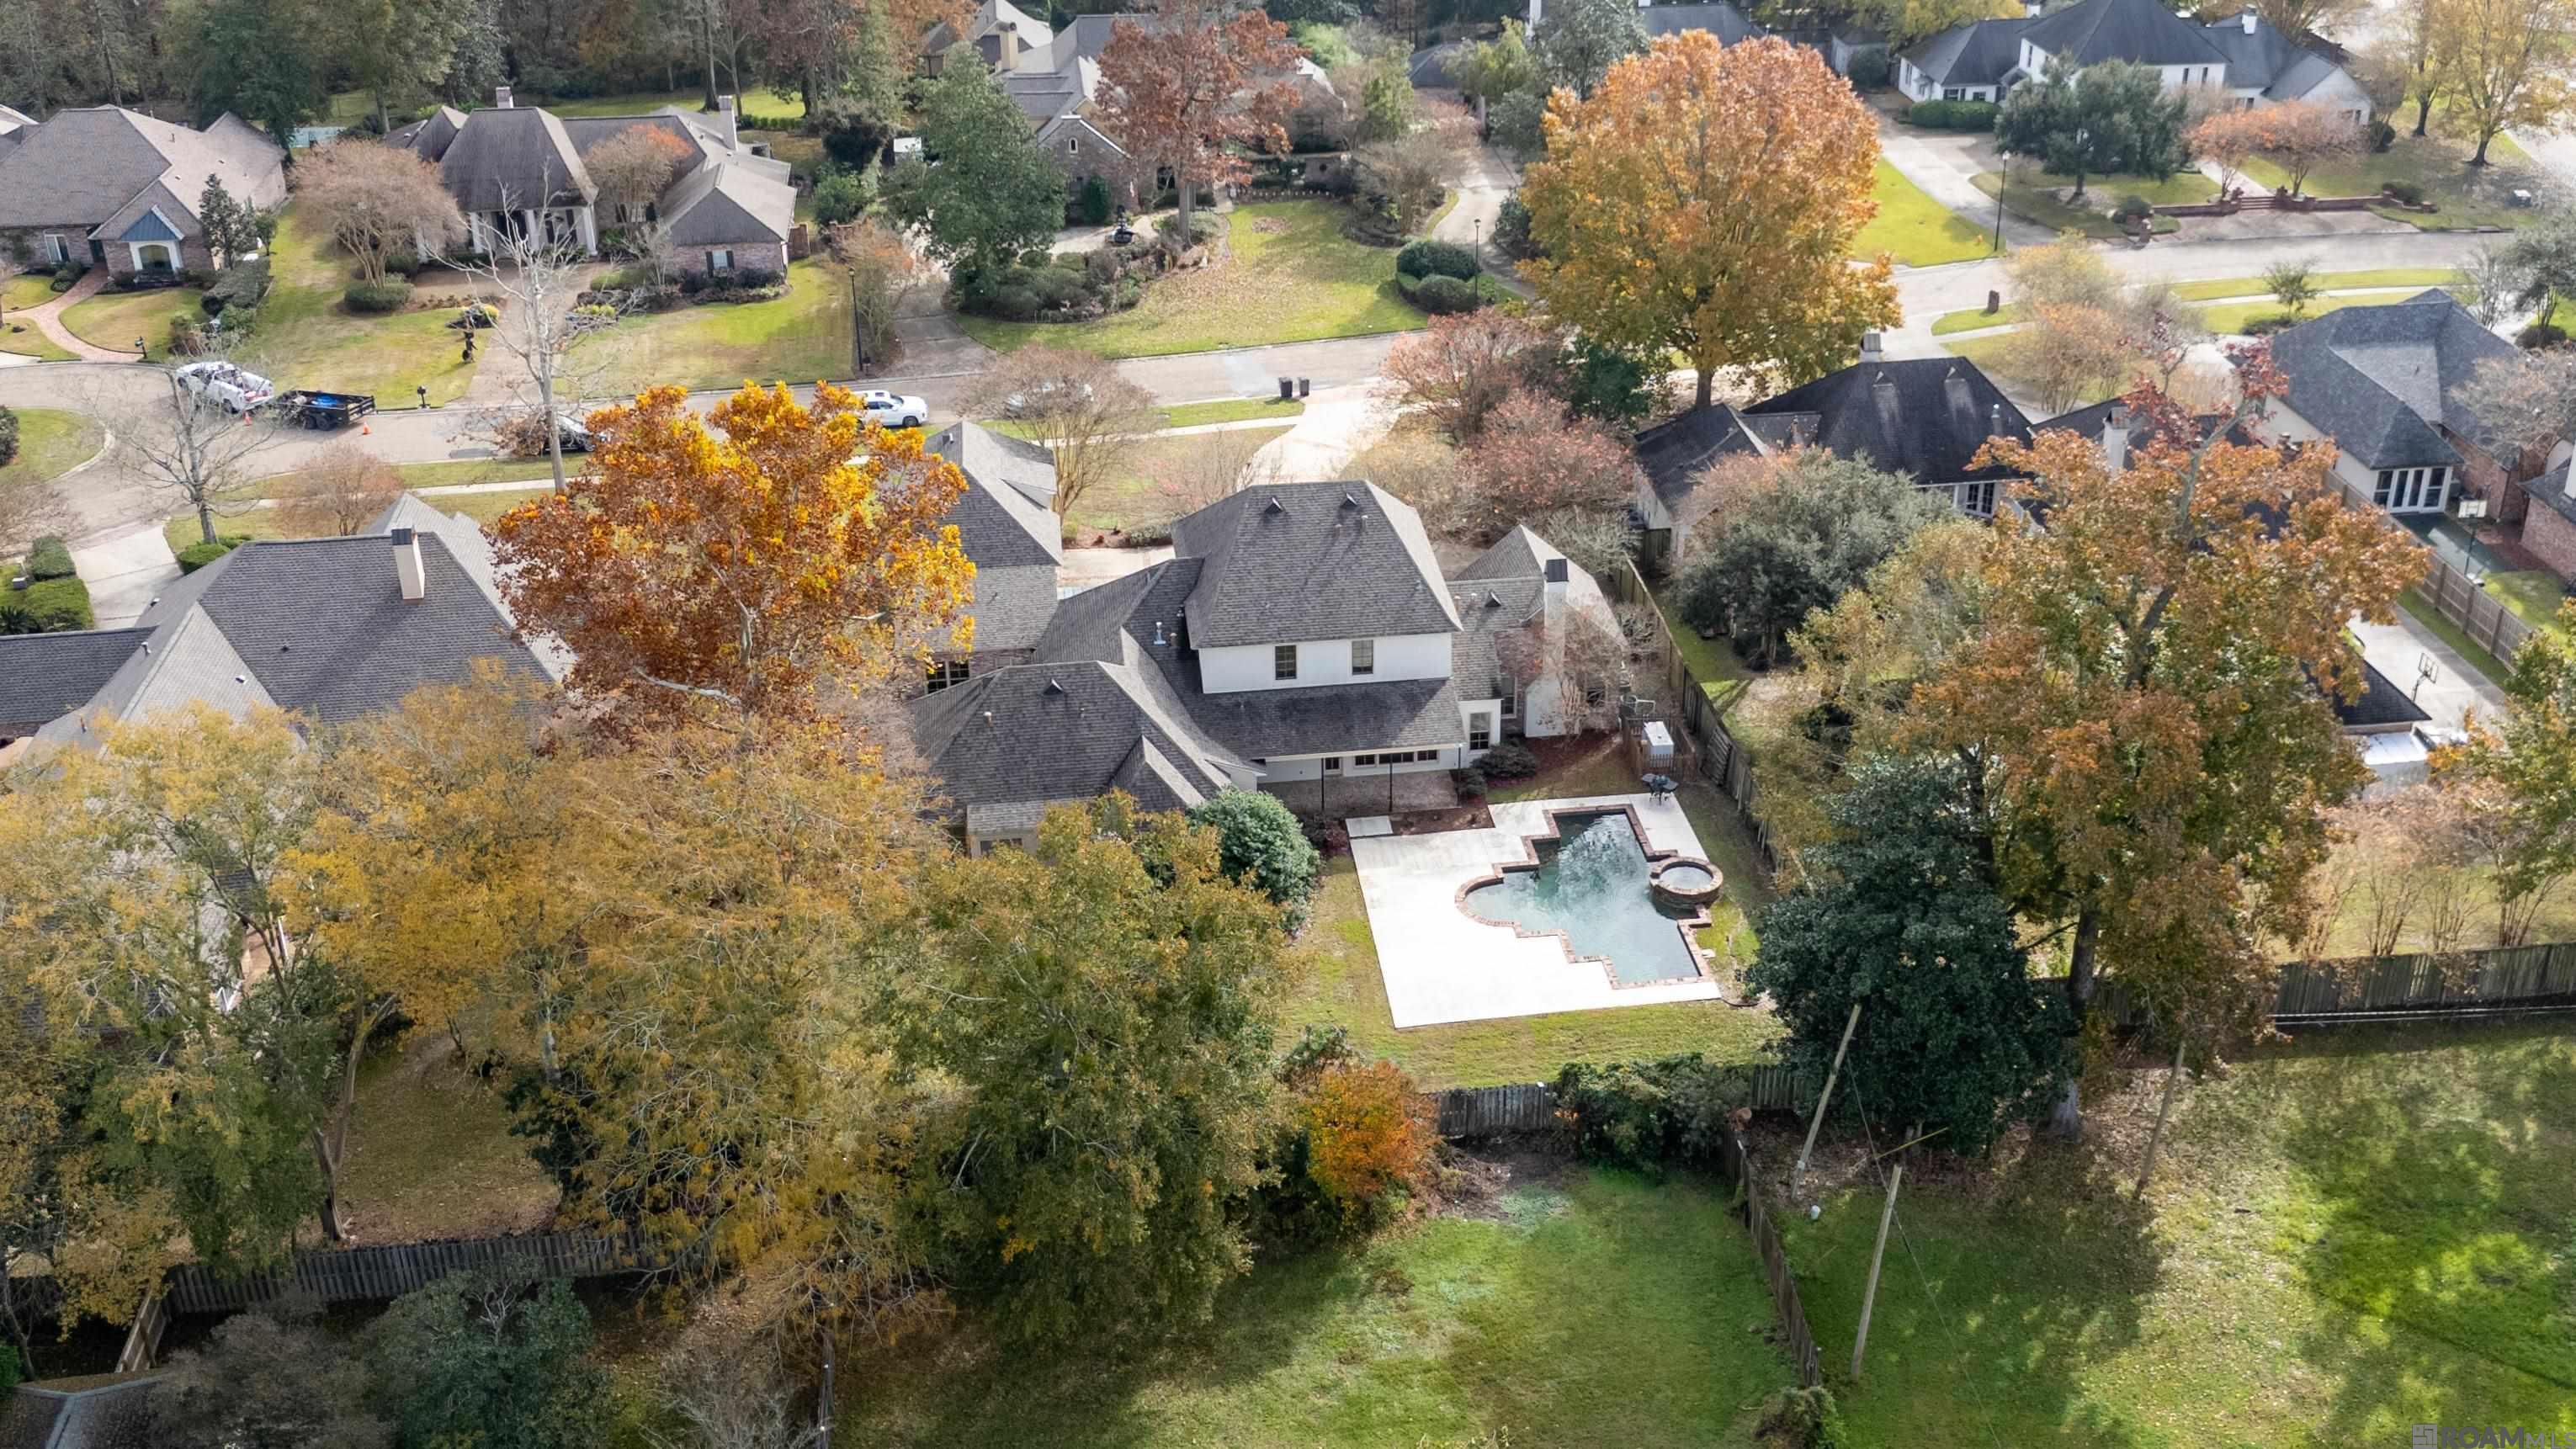
Active
$1,750,000
6
bds
|
8
ba
|
6,151
sqft
|
built
1997
837 Myrtle View Dr, Baton Rouge, LA 70810
$-4,748
Cash flow
-14.2%
Cash-on-Cash Return
3.0%
Cap rate
0.4%
Rent to Value Ratio
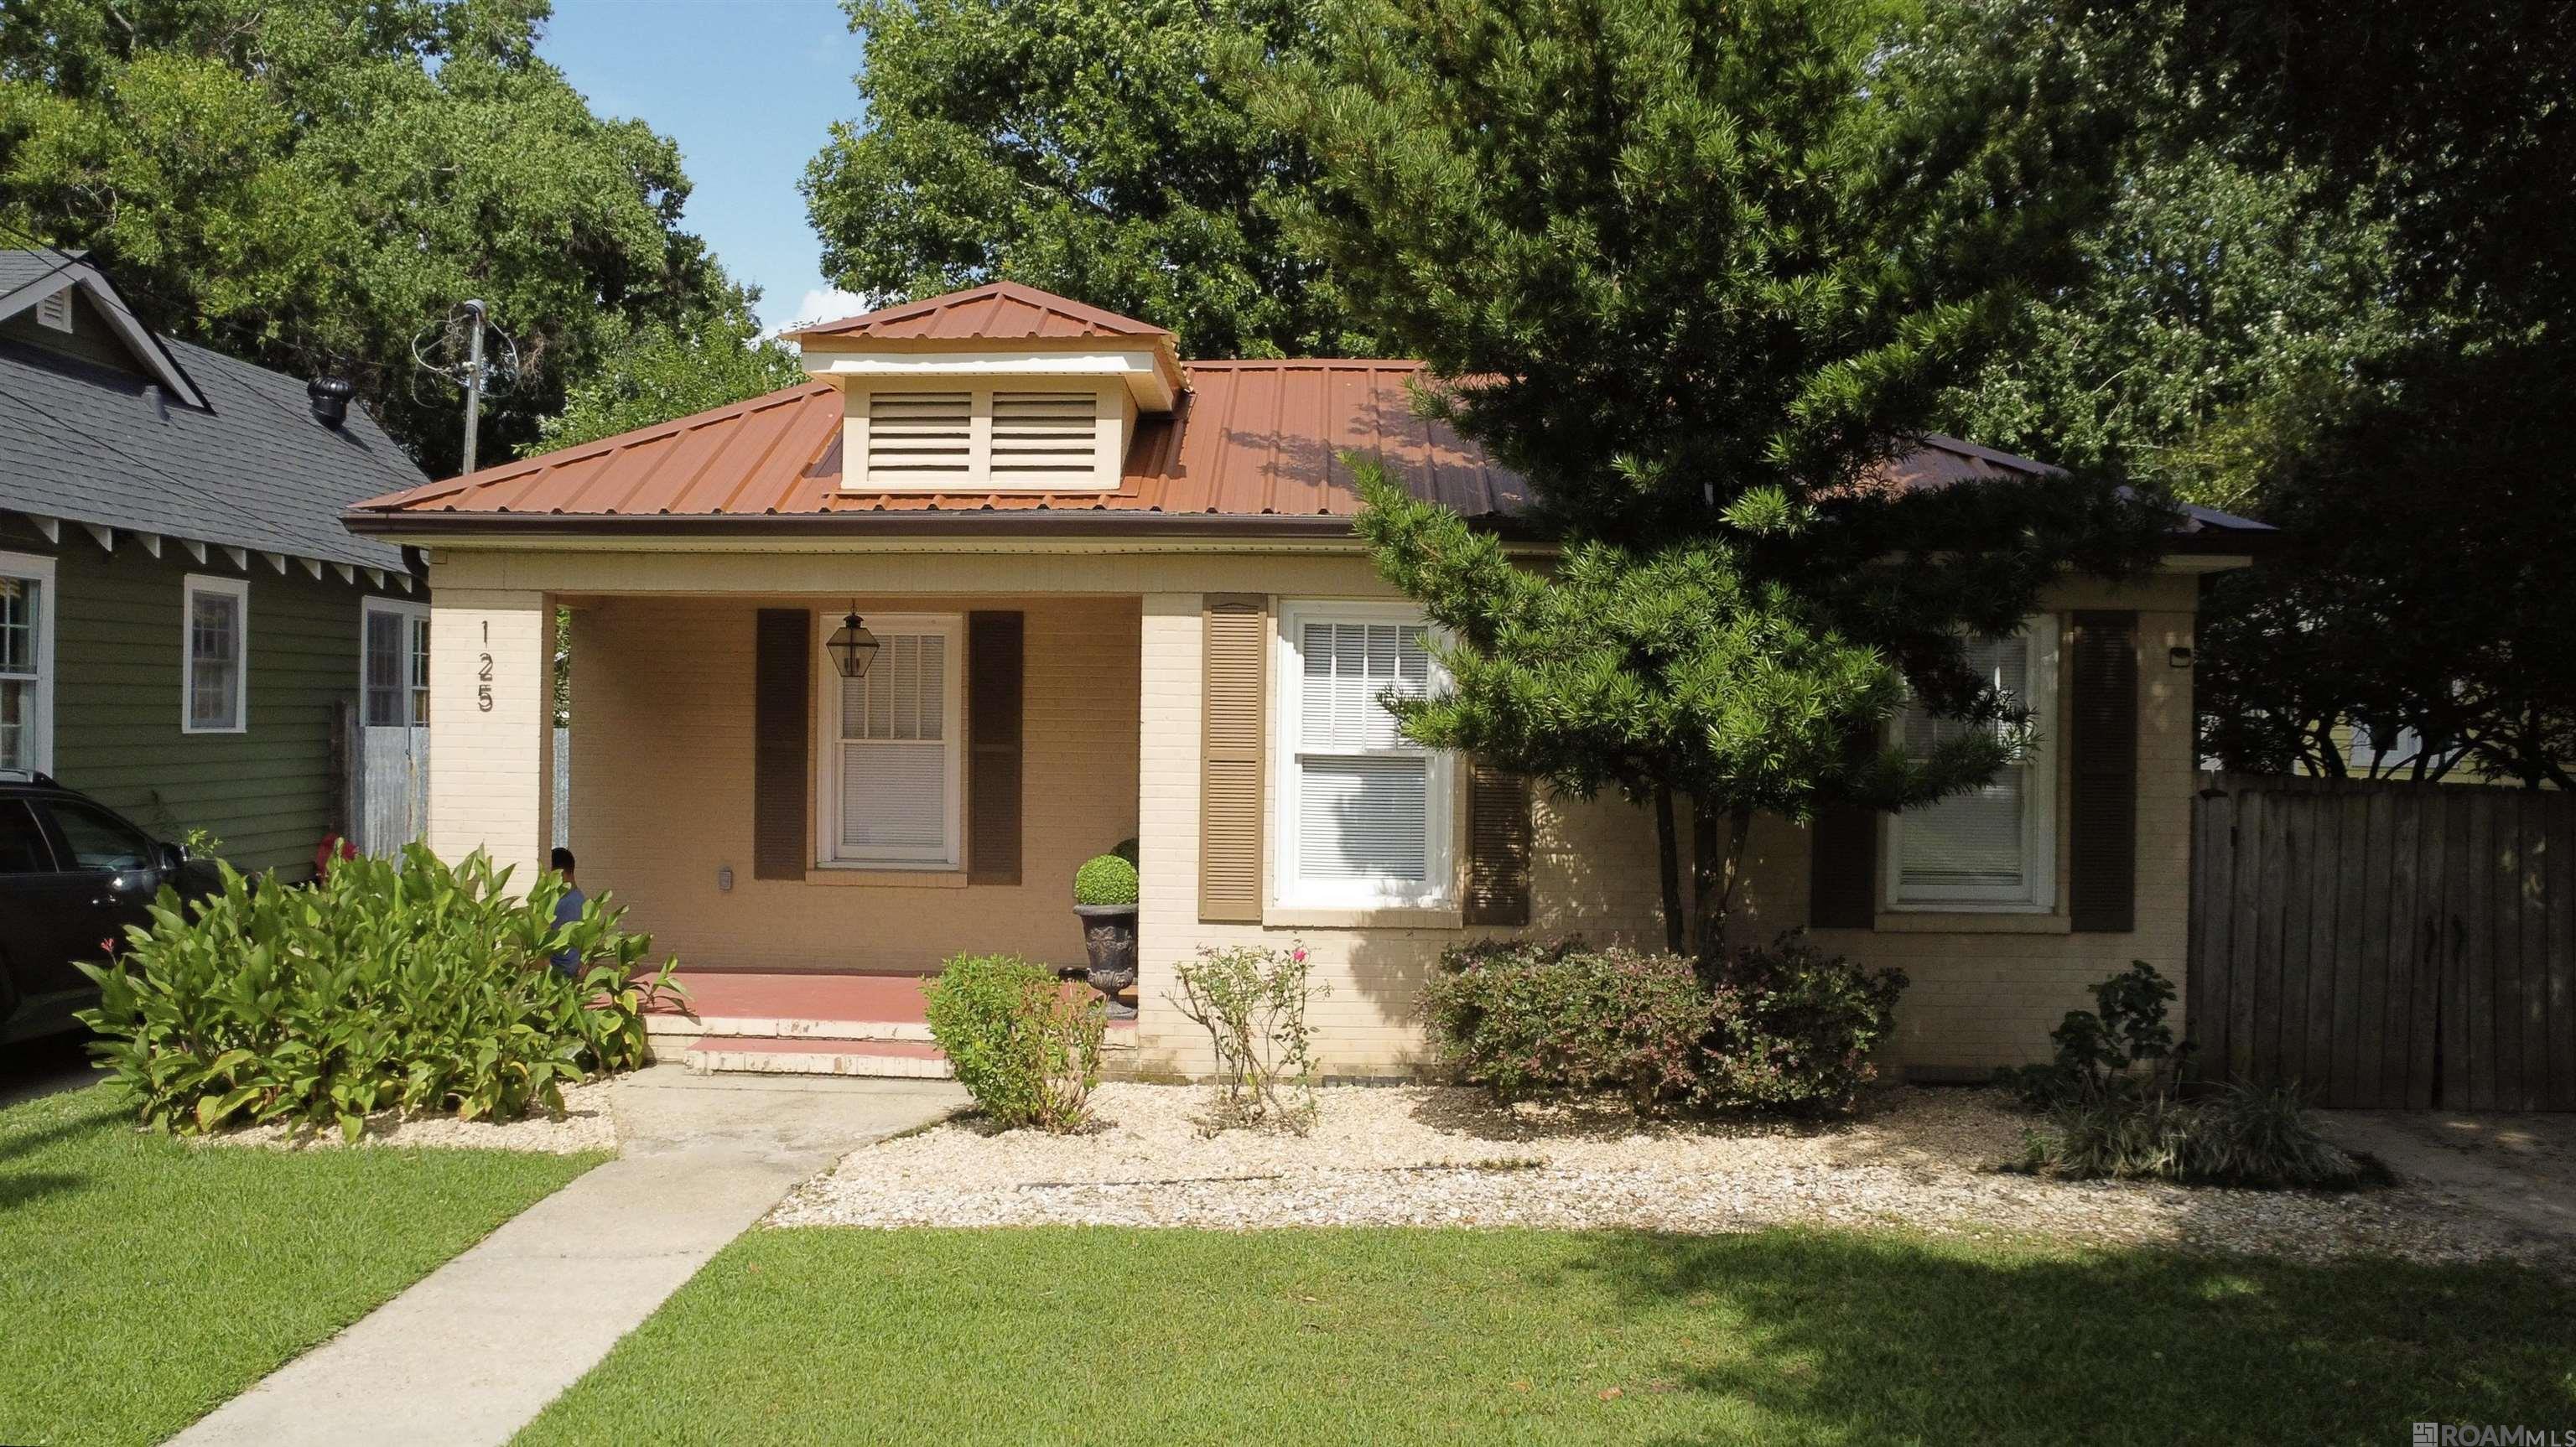
Active
$255,000
2
bds
|
1
ba
|
1,240
sqft
|
built
1970
125 Hearthstone Dr, Baton Rouge, LA 70806
$-93
Cash flow
-1.9%
Cash-on-Cash Return
5.8%
Cap rate
0.7%
Rent to Value Ratio

Active
$590,000
2
bds
|
3
ba
|
3,230
sqft
|
built
1981
45 Jamestowne Ct, Baton Rouge, LA 70809
$-1,619
Cash flow
-14.3%
Cash-on-Cash Return
3.0%
Cap rate
0.5%
Rent to Value Ratio
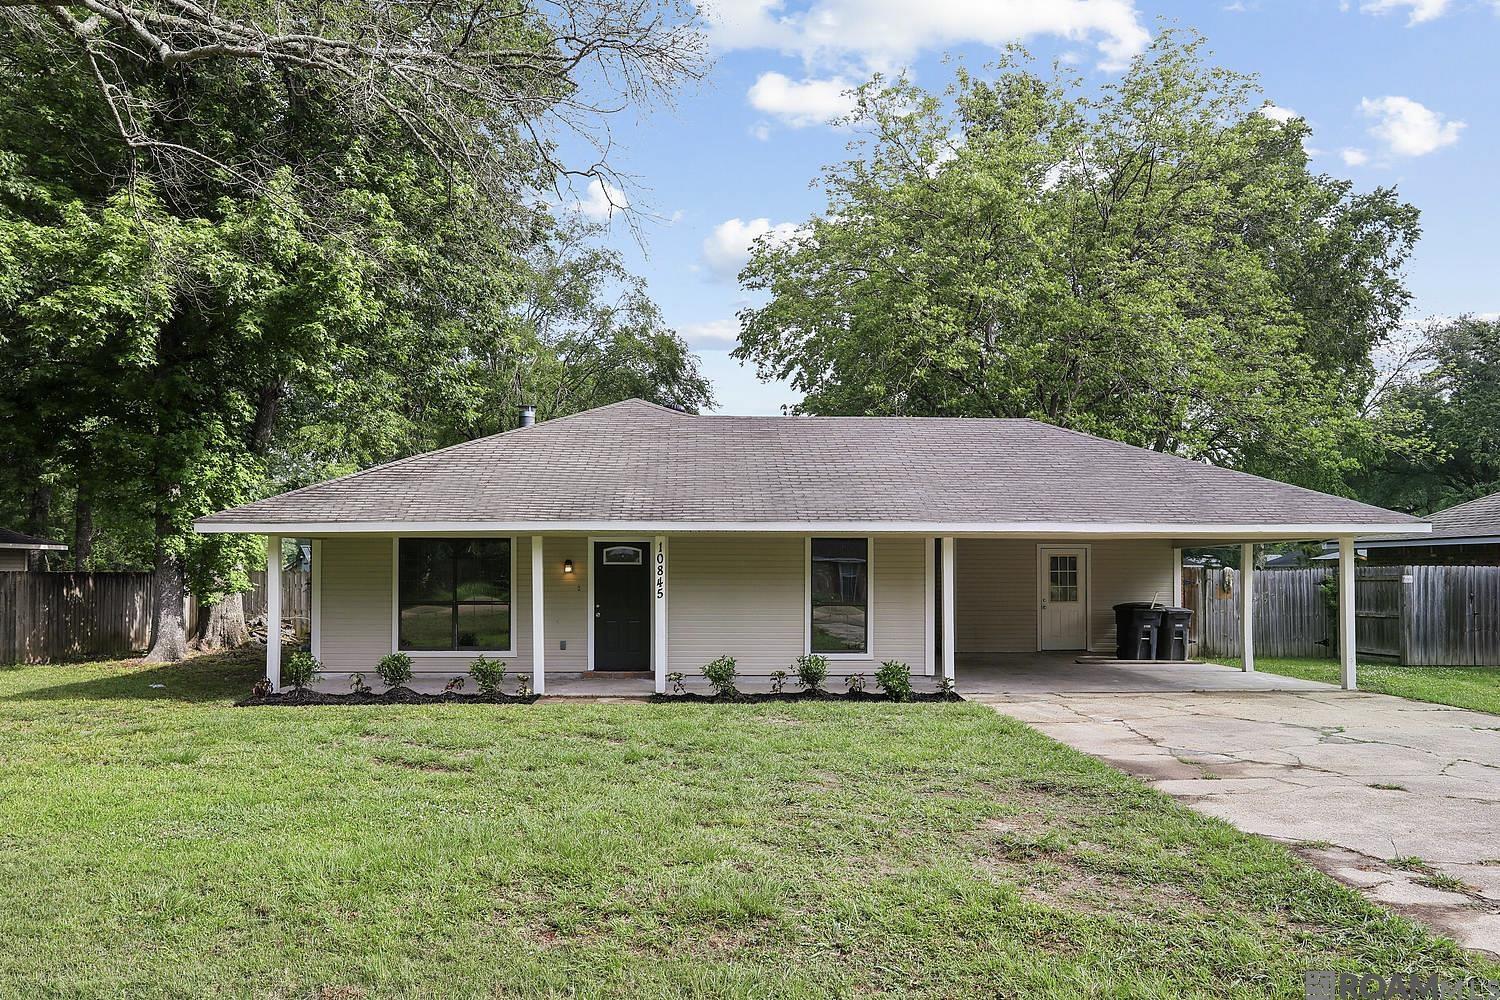
Active
$240,000
3
bds
|
2
ba
|
1,468
sqft
|
built
1979
10845 Ida Ave, Baton Rouge, LA 70818
$-84
Cash flow
-1.8%
Cash-on-Cash Return
5.9%
Cap rate
0.7%
Rent to Value Ratio
Active
$394,000
4
bds
|
3
ba
|
2,144
sqft
|
built
2010
14625 Grapevine Dr, Baton Rouge, LA 70818
$-166
Cash flow
-2.2%
Cash-on-Cash Return
5.8%
Cap rate
0.7%
Rent to Value Ratio
Active
$1,050,000
5
bds
|
6
ba
|
4,939
sqft
|
built
2006
19728 Southern Hills Ave, Baton Rouge, LA 70809
$-1,202
Cash flow
-6.0%
Cash-on-Cash Return
4.9%
Cap rate
0.6%
Rent to Value Ratio
Active
$4,995,000
6
bds
|
7
ba
|
8,204
sqft
|
built
2000
19614 S Muirfield Cir, Baton Rouge, LA 70810
$-22,085
Cash flow
-23.1%
Cash-on-Cash Return
1.0%
Cap rate
0.1%
Rent to Value Ratio
Active
$892,000
4
bds
|
4
ba
|
3,282
sqft
|
built
2013
11444 Cypress Barn Dr, Baton Rouge, LA 70810
$-932
Cash flow
-5.5%
Cash-on-Cash Return
5.0%
Cap rate
0.6%
Rent to Value Ratio
Active
$1,275,000
4
bds
|
5
ba
|
5,088
sqft
|
built
2006
5806 Highland Rd, Baton Rouge, LA 70808
$-2,192
Cash flow
-9.0%
Cash-on-Cash Return
4.2%
Cap rate
0.5%
Rent to Value Ratio
Active
$453,000
4
bds
|
3
ba
|
2,625
sqft
|
built
1991
2030 Oakcliff Dr, Baton Rouge, LA 70810
$-450
Cash flow
-5.2%
Cash-on-Cash Return
5.1%
Cap rate
0.6%
Rent to Value Ratio