Birmingham, AL Investment Properties for Sale
Browse homes for sale and investment properties in Birmingham, AL. Refine your search by price, property type, or more.
Best cash flowing properties in Birmingham, AL
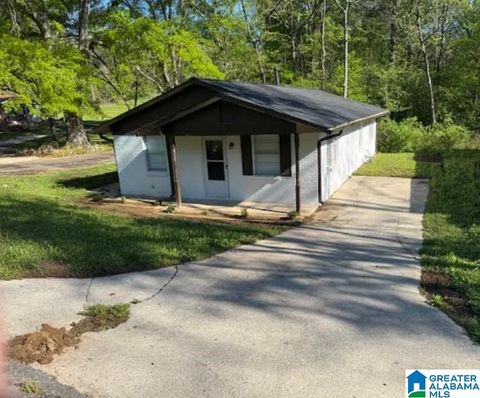
Active
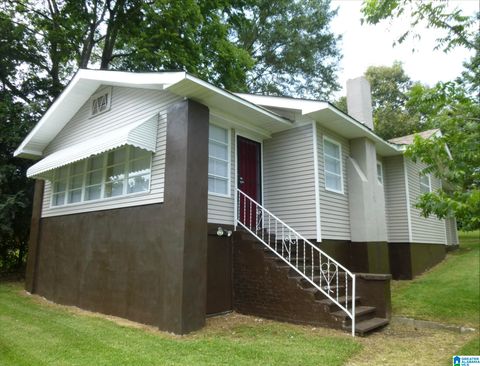
$59,000
3
bds
|
0
ba
|
1,443
sqft
|
built
1920
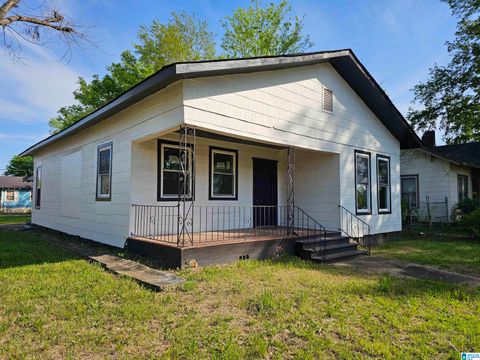
440 12th St W, Birmingham, AL 35208
$966
Cash flow
19.1%
Cash-on-Cash Return
19.6%
Cap rate
2.4%
Rent to Value Ratio
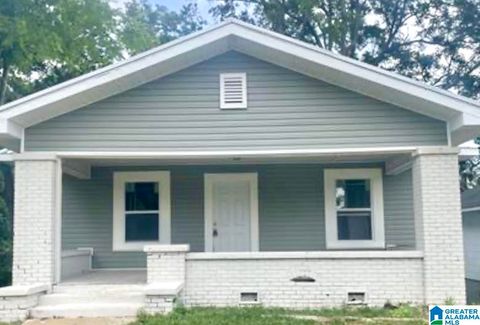
Active
$21,800
3
bds
|
0
ba
|
1,368
sqft
|
built
1930
2416 30th Street Ensley, Birmingham, AL 35208
$897
Cash flow
47.9%
Cash-on-Cash Return
49.4%
Cap rate
6.0%
Rent to Value Ratio
838 out of 960 properties for sale in Birmingham, AL
Limited Results Shown
Create a free account, or log in to reveal all property listings and enjoy the complete experience.

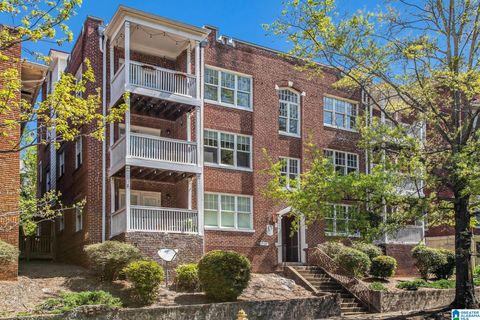
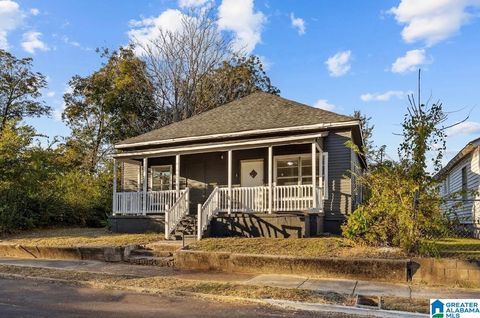
Active
$127,500
3
bds
|
0
ba
|
1,006
sqft
|
built
1959
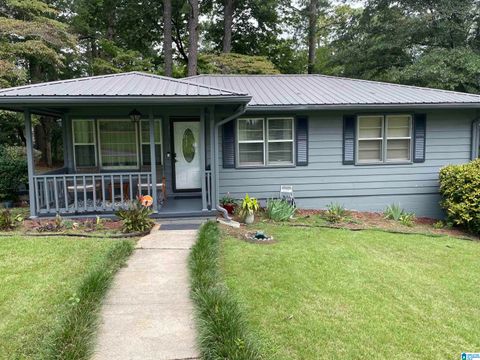
600 Barclay Ln, Birmingham, AL 35206
$93
Cash flow
3.8%
Cash-on-Cash Return
7.1%
Cap rate
0.9%
Rent to Value Ratio
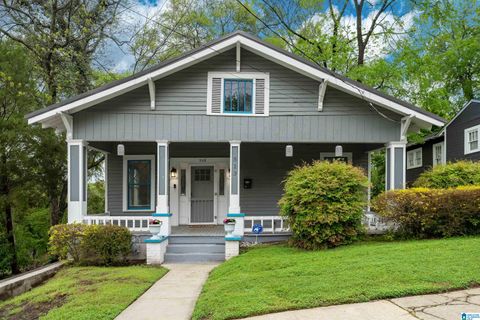
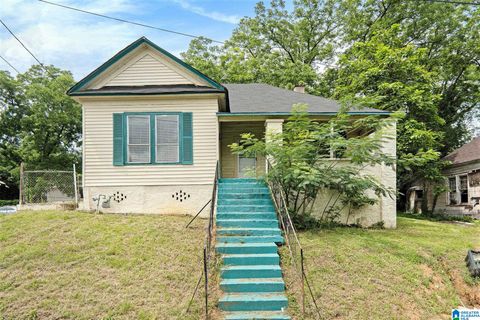
Active
$56,900
2
bds
|
0
ba
|
927
sqft
|
built
1949
8200 Rugby Ave, Birmingham, AL 35206
$759
Cash flow
15.5%
Cash-on-Cash Return
16.0%
Cap rate
1.9%
Rent to Value Ratio
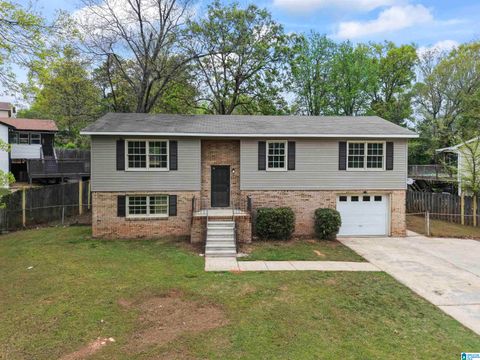
Active
$240,000
2
bds
|
0
ba
|
1,750
sqft
|
built
1996
2009 Westridge Dr, Birmingham, AL 35235
$-30
Cash flow
-0.7%
Cash-on-Cash Return
6.1%
Cap rate
0.8%
Rent to Value Ratio
Active
$599,900
3
bds
|
0
ba
|
2,847
sqft
|
built
1984
5000 Cameron Rd, Birmingham, AL 35242
$-734
Cash flow
-6.4%
Cash-on-Cash Return
4.8%
Cap rate
0.6%
Rent to Value Ratio
Active
$405,000
5
bds
|
0
ba
|
4,017
sqft
|
built
1972
1044 6th Pl W, Birmingham, AL 35204
$-665
Cash flow
-8.6%
Cash-on-Cash Return
4.3%
Cap rate
0.5%
Rent to Value Ratio
Active
$187,900
4
bds
|
0
ba
|
1,632
sqft
|
built
1974
987 Chichester Dr, Birmingham, AL 35214
$-153
Cash flow
-4.2%
Cash-on-Cash Return
5.3%
Cap rate
0.6%
Rent to Value Ratio
Active
$79,000
3
bds
|
0
ba
|
884
sqft
|
built
1925
3510 Avenue C, Birmingham, AL 35218
$278
Cash flow
18.4%
Cash-on-Cash Return
10.5%
Cap rate
1.3%
Rent to Value Ratio
Active
$117,500
3
bds
|
0
ba
|
1,580
sqft
|
built
1925
4255 Pulaski St, Birmingham, AL 35217
$353
Cash flow
15.7%
Cash-on-Cash Return
9.9%
Cap rate
1.2%
Rent to Value Ratio
Active
$99,000
3
bds
|
0
ba
|
1,040
sqft
|
built
1952
2038 Woodrow Dr, Birmingham, AL 35217
$311
Cash flow
16.4%
Cash-on-Cash Return
10.0%
Cap rate
1.2%
Rent to Value Ratio
Active
$169,900
3
bds
|
0
ba
|
1,632
sqft
|
built
1935
1644 42nd Street Ensley, Birmingham, AL 35208
$79
Cash flow
2.4%
Cash-on-Cash Return
6.8%
Cap rate
0.8%
Rent to Value Ratio
Active
$40,000
2
bds
|
0
ba
|
1,084
sqft
|
built
1920
2722 33rd Ave N, Birmingham, AL 35207
$552
Cash flow
16.1%
Cash-on-Cash Return
16.6%
Cap rate
2.0%
Rent to Value Ratio
Active
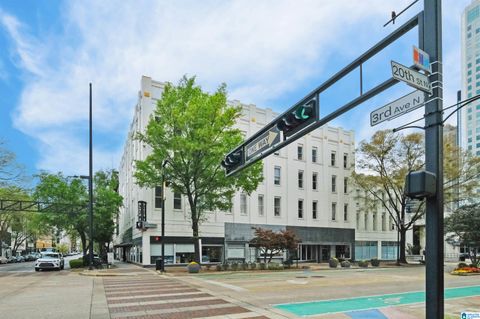
$339,900
1
bds
|
0
ba
|
1,046
sqft
|
built
2021
300 20th St N, Birmingham, AL 35203
$-736
Cash flow
-11.3%
Cash-on-Cash Return
3.7%
Cap rate
0.6%
Rent to Value Ratio
Active
$155,000
3
bds
|
0
ba
|
1,151
sqft
|
built
1950
827 Hillcrest Rd, Birmingham, AL 35235
$157
Cash flow
5.3%
Cash-on-Cash Return
7.5%
Cap rate
0.9%
Rent to Value Ratio

Active
$320,000
3
bds
|
0
ba
|
1,204
sqft
|
built
1951
5605 7th Ave S, Birmingham, AL 35212
$-153
Cash flow
-2.5%
Cash-on-Cash Return
5.7%
Cap rate
0.7%
Rent to Value Ratio
Active
$139,000
3
bds
|
0
ba
|
1,893
sqft
|
built
1960
9801 Redcliff Rd, Birmingham, AL 35215
$240
Cash flow
9.0%
Cash-on-Cash Return
8.3%
Cap rate
1.0%
Rent to Value Ratio
Active
$89,750
3
bds
|
0
ba
|
1,008
sqft
|
built
2004
621 Bell Ave, Birmingham, AL 35217
$221
Cash flow
12.8%
Cash-on-Cash Return
9.2%
Cap rate
1.1%
Rent to Value Ratio
Active
$97,000
4
bds
|
0
ba
|
1,509
sqft
|
built
1930
1701 Avenue I, Birmingham, AL 35218
$253
Cash flow
13.6%
Cash-on-Cash Return
9.4%
Cap rate
1.1%
Rent to Value Ratio
Active
$154,000
3
bds
|
0
ba
|
1,265
sqft
|
built
2007
3 Holt Ave, Birmingham, AL 35214
$231
Cash flow
7.8%
Cash-on-Cash Return
8.1%
Cap rate
1.0%
Rent to Value Ratio

Active
$175,000
3
bds
|
0
ba
|
2,937
sqft
|
built
1996
1908 Live Oak Trce, Birmingham, AL 35235
$190
Cash flow
5.7%
Cash-on-Cash Return
7.6%
Cap rate
0.9%
Rent to Value Ratio
Active
$165,000
3
bds
|
0
ba
|
1,134
sqft
|
built
1957
6636 Avenue N, Birmingham, AL 35228
$-33
Cash flow
-1.0%
Cash-on-Cash Return
6.0%
Cap rate
0.7%
Rent to Value Ratio

Active
$329,000
1
bds
|
0
ba
|
895
sqft
|
built
2007
2226 1st Ave S, Birmingham, AL 35233
$-407
Cash flow
-6.5%
Cash-on-Cash Return
4.8%
Cap rate
0.6%
Rent to Value Ratio
Active
$133,000
3
bds
|
0
ba
|
1,450
sqft
|
built
1962
901 Hagwood Rd, Birmingham, AL 35235
$272
Cash flow
10.7%
Cash-on-Cash Return
8.7%
Cap rate
1.1%
Rent to Value Ratio
Active
$158,000
3
bds
|
0
ba
|
1,159
sqft
|
built
1982
438 Henry St, Birmingham, AL 35214
$72
Cash flow
2.4%
Cash-on-Cash Return
6.8%
Cap rate
0.8%
Rent to Value Ratio

Active
$385,000
2
bds
|
0
ba
|
1,281
sqft
|
built
1987
2730 Caldwell Ave S, Birmingham, AL 35205
$-285
Cash flow
-3.9%
Cash-on-Cash Return
5.4%
Cap rate
0.6%
Rent to Value Ratio
Active
$198,000
1
bds
|
0
ba
|
764
sqft
|
built
1920
1105 26th St S, Birmingham, AL 35205
$-68
Cash flow
-1.8%
Cash-on-Cash Return
5.9%
Cap rate
0.7%
Rent to Value Ratio

Active
$230,000
3
bds
|
0
ba
|
1,782
sqft
|
built
1982
1104 Springville Rd, Birmingham, AL 35215
$-403
Cash flow
-9.1%
Cash-on-Cash Return
4.2%
Cap rate
0.5%
Rent to Value Ratio
Active
$299,900
3
bds
|
0
ba
|
1,460
sqft
|
built
1925
513 59th St S, Birmingham, AL 35212
$-48
Cash flow
-0.8%
Cash-on-Cash Return
6.1%
Cap rate
0.7%
Rent to Value Ratio

Active
$495,000
5
bds
|
0
ba
|
2,843
sqft
|
built
1900
1730 Cullom St S, Birmingham, AL 35205
$-445
Cash flow
-4.7%
Cash-on-Cash Return
5.2%
Cap rate
0.6%
Rent to Value Ratio
Active
$119,000
4
bds
|
0
ba
|
1,290
sqft
|
built
1925
4301 Court S, Birmingham, AL 35208
$69
Cash flow
3.0%
Cash-on-Cash Return
7.0%
Cap rate
0.8%
Rent to Value Ratio

Active
$135,000
3
bds
|
0
ba
|
1,311
sqft
|
built
1951
6616 4th Ave S, Birmingham, AL 35212
$261
Cash flow
10.1%
Cash-on-Cash Return
8.6%
Cap rate
1.0%
Rent to Value Ratio
Active
$149,900
1
bds
|
0
ba
|
625
sqft
|
built
1974
2625 Highland Ave S, Birmingham, AL 35205
$-362
Cash flow
-12.6%
Cash-on-Cash Return
3.4%
Cap rate
0.7%
Rent to Value Ratio
Active
$109,099
3
bds
|
0
ba
|
841
sqft
|
built
1960
1341 16th Pl SW, Birmingham, AL 35211
$258
Cash flow
12.3%
Cash-on-Cash Return
9.1%
Cap rate
1.1%
Rent to Value Ratio
Active
$80,000
2
bds
|
0
ba
|
1,006
sqft
|
built
1950
783 80th St S, Birmingham, AL 35206
$341
Cash flow
22.2%
Cash-on-Cash Return
11.4%
Cap rate
1.4%
Rent to Value Ratio
Active
$724,999
5
bds
|
0
ba
|
3,972
sqft
|
built
1999
5006 Aberdeen Way, Birmingham, AL 35242
$-1,495
Cash flow
-10.8%
Cash-on-Cash Return
3.8%
Cap rate
0.5%
Rent to Value Ratio
Active
$79,900
3
bds
|
0
ba
|
1,028
sqft
|
built
1930
600 9th Ave, Birmingham, AL 35228
$273
Cash flow
17.8%
Cash-on-Cash Return
10.4%
Cap rate
1.3%
Rent to Value Ratio
Active
$119,000
3
bds
|
0
ba
|
1,051
sqft
|
built
1935
204 5th Way, Birmingham, AL 35214
$69
Cash flow
3.0%
Cash-on-Cash Return
7.0%
Cap rate
0.8%
Rent to Value Ratio
Active
$110,000
4
bds
|
0
ba
|
1,380
sqft
|
built
1910
4316 6th Ave, Birmingham, AL 35224
$185
Cash flow
8.8%
Cash-on-Cash Return
8.3%
Cap rate
1.0%
Rent to Value Ratio
Active
$194,900
3
bds
|
0
ba
|
1,692
sqft
|
built
1974
1700 Maralyn Dr, Birmingham, AL 35235
$86
Cash flow
2.3%
Cash-on-Cash Return
6.8%
Cap rate
0.8%
Rent to Value Ratio