Bixby, OK Investment Properties for Sale
Browse homes for sale and investment properties in Bixby, OK. Refine your search by price, property type, or more.
Best cash flowing properties in Bixby, OK
Active
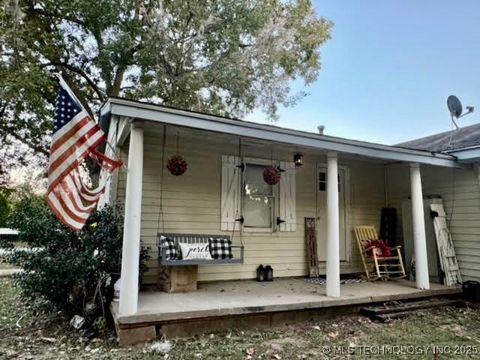
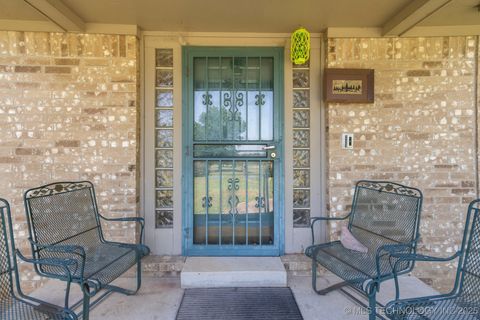
$185,000
2
bds
|
1
ba
|
940
sqft
|
built
1940
16510 E 165th St S, Bixby, OK 74008
$-32
Cash flow
-0.9%
Cash-on-Cash Return
5.5%
Cap rate
0.7%
Rent to Value Ratio
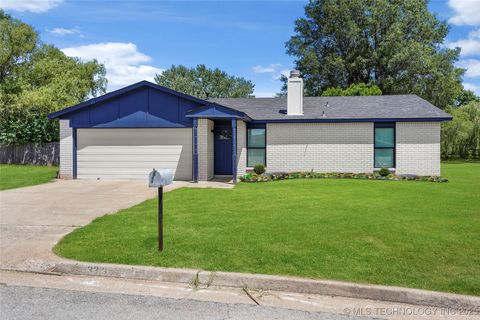
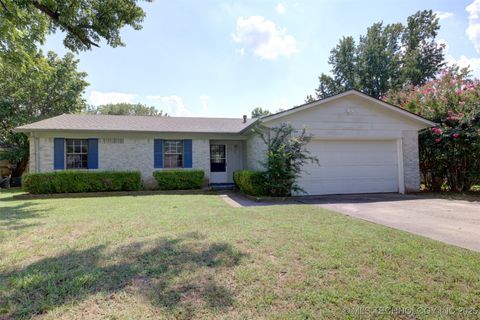
Active
$229,500
3
bds
|
2
ba
|
1,251
sqft
|
built
1979
13313 S 85th East Ave, Bixby, OK 74008
$-70
Cash flow
-1.6%
Cash-on-Cash Return
5.3%
Cap rate
0.7%
Rent to Value Ratio
89 out of 169 properties for sale in Bixby, OK
Limited Results Shown
Create a free account, or log in to reveal all property listings and enjoy the complete experience.
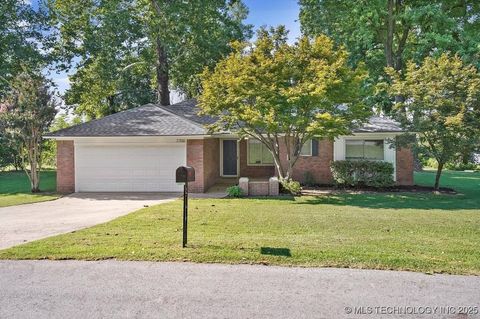
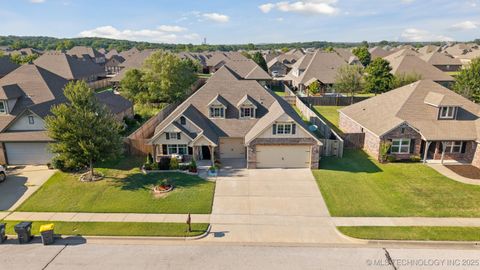
Active
$260,000
3
bds
|
2
ba
|
1,462
sqft
|
built
1973
7700 E 118th St S, Bixby, OK 74008
$-315
Cash flow
-6.3%
Cash-on-Cash Return
4.2%
Cap rate
0.6%
Rent to Value Ratio
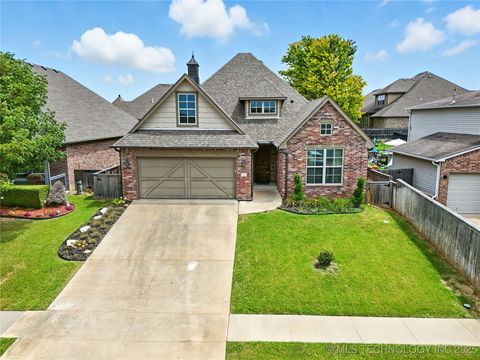
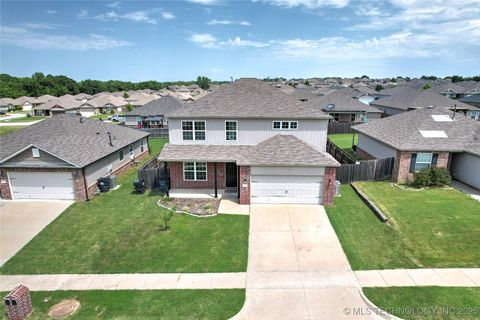
Active
$310,000
3
bds
|
2
ba
|
1,731
sqft
|
built
2017
14625 S Toledo Pl, Bixby, OK 74008
$-427
Cash flow
-7.2%
Cash-on-Cash Return
4.0%
Cap rate
0.7%
Rent to Value Ratio
Active
$2,250,000
4
bds
|
4
ba
|
3,806
sqft
|
built
1991
2290 E 151st St S, Bixby, OK 74008
$-9,065
Cash flow
-21.0%
Cash-on-Cash Return
0.8%
Cap rate
0.1%
Rent to Value Ratio
Active
$285,000
4
bds
|
3
ba
|
2,367
sqft
|
built
2016
5837 E 148th St S, Bixby, OK 74008
$-132
Cash flow
-2.4%
Cash-on-Cash Return
5.1%
Cap rate
0.8%
Rent to Value Ratio
Active
$337,500
4
bds
|
2
ba
|
1,976
sqft
|
built
2012
2029 E 133rd Pl S, Bixby, OK 74008
$-369
Cash flow
-5.7%
Cash-on-Cash Return
4.4%
Cap rate
0.7%
Rent to Value Ratio
Active
$193,977
3
bds
|
2
ba
|
1,112
sqft
|
built
1975
32 W Rachel St, Bixby, OK 74008
$-97
Cash flow
-2.6%
Cash-on-Cash Return
5.1%
Cap rate
0.7%
Rent to Value Ratio
Active
$729,000
4
bds
|
5
ba
|
3,943
sqft
|
built
2014
6683 E 122nd Pl S, Bixby, OK 74008
$-1,311
Cash flow
-9.4%
Cash-on-Cash Return
3.5%
Cap rate
0.6%
Rent to Value Ratio
Active
$330,000
4
bds
|
2
ba
|
1,961
sqft
|
built
2010
2003 E 133rd Ct, Bixby, OK 74008
$-437
Cash flow
-6.9%
Cash-on-Cash Return
4.1%
Cap rate
0.6%
Rent to Value Ratio
Active
$214,900
3
bds
|
2
ba
|
1,294
sqft
|
built
1958
8421 E 133rd St S, Bixby, OK 74008
$-168
Cash flow
-4.1%
Cash-on-Cash Return
4.7%
Cap rate
0.7%
Rent to Value Ratio
Active
$769,900
5
bds
|
6
ba
|
5,363
sqft
|
built
2007
7207 E 112th Pl S, Bixby, OK 74008
$-1,398
Cash flow
-9.5%
Cash-on-Cash Return
3.5%
Cap rate
0.6%
Rent to Value Ratio
Active
$624,900
5
bds
|
4
ba
|
3,552
sqft
|
built
2022
14460 S College Ave, Bixby, OK 74008
$-789
Cash flow
-6.6%
Cash-on-Cash Return
4.2%
Cap rate
0.6%
Rent to Value Ratio
Active
$369,900
4
bds
|
2
ba
|
2,230
sqft
|
built
2020
5934 E 143rd St S, Bixby, OK 74008
$-449
Cash flow
-6.3%
Cash-on-Cash Return
4.2%
Cap rate
0.7%
Rent to Value Ratio
Active
$399,000
5
bds
|
3
ba
|
2,533
sqft
|
built
2017
14751 S Urbana Ave, Bixby, OK 74008
$-704
Cash flow
-9.2%
Cash-on-Cash Return
3.6%
Cap rate
0.6%
Rent to Value Ratio
Active
$330,000
3
bds
|
2
ba
|
1,933
sqft
|
built
2018
3838 E 144th St S, Bixby, OK 74008
$-545
Cash flow
-8.6%
Cash-on-Cash Return
3.7%
Cap rate
0.6%
Rent to Value Ratio
Active
$420,000
4
bds
|
3
ba
|
2,938
sqft
|
built
2011
3140 E 143rd St S, Bixby, OK 74008
$-442
Cash flow
-5.5%
Cash-on-Cash Return
4.4%
Cap rate
0.7%
Rent to Value Ratio
Active
$529,900
5
bds
|
4
ba
|
2,835
sqft
|
built
2023
12233 S 102nd East Ave, Bixby, OK 74008
$-1,246
Cash flow
-12.3%
Cash-on-Cash Return
2.9%
Cap rate
0.5%
Rent to Value Ratio
Active
$349,900
3
bds
|
2
ba
|
2,028
sqft
|
built
2017
13176 S 92nd East Ave, Bixby, OK 74008
$-493
Cash flow
-7.4%
Cash-on-Cash Return
4.0%
Cap rate
0.6%
Rent to Value Ratio
Active
$429,500
3
bds
|
3
ba
|
2,240
sqft
|
built
2019
5521 E 121st Pl S, Bixby, OK 74008
$-734
Cash flow
-8.9%
Cash-on-Cash Return
3.6%
Cap rate
0.6%
Rent to Value Ratio
Active
$515,000
5
bds
|
3
ba
|
3,356
sqft
|
built
2015
6807 E 125th St S, Bixby, OK 74008
$-1,002
Cash flow
-10.2%
Cash-on-Cash Return
3.3%
Cap rate
0.6%
Rent to Value Ratio
Active
$423,000
5
bds
|
3
ba
|
2,960
sqft
|
built
2008
13408 S 20th Ct, Bixby, OK 74008
$-637
Cash flow
-7.9%
Cash-on-Cash Return
3.9%
Cap rate
0.6%
Rent to Value Ratio
Active
$290,000
3
bds
|
2
ba
|
1,590
sqft
|
built
2011
8731 E 136th St S, Bixby, OK 74008
$-462
Cash flow
-8.3%
Cash-on-Cash Return
3.8%
Cap rate
0.6%
Rent to Value Ratio
Active
$675,000
5
bds
|
4
ba
|
4,222
sqft
|
built
2016
6624 E 133rd St S, Bixby, OK 74008
$-1,763
Cash flow
-13.6%
Cash-on-Cash Return
2.5%
Cap rate
0.5%
Rent to Value Ratio
Active
$444,900
4
bds
|
4
ba
|
2,713
sqft
|
built
2023
16153 S 90th East Ave, Bixby, OK 74008
$-203
Cash flow
-2.4%
Cash-on-Cash Return
5.1%
Cap rate
0.6%
Rent to Value Ratio
Active
$375,000
3
bds
|
3
ba
|
2,535
sqft
|
built
1999
10306 E 114th Pl S, Bixby, OK 74008
$-752
Cash flow
-10.5%
Cash-on-Cash Return
3.3%
Cap rate
0.5%
Rent to Value Ratio
Active
$281,900
3
bds
|
2
ba
|
1,550
sqft
|
built
2002
8431 E 126th St S, Bixby, OK 74008
$-394
Cash flow
-7.3%
Cash-on-Cash Return
4.0%
Cap rate
0.6%
Rent to Value Ratio
Active
$514,900
4
bds
|
3
ba
|
2,665
sqft
|
built
2018
11919 S 68th East Ave, Bixby, OK 74008
$-867
Cash flow
-8.8%
Cash-on-Cash Return
3.7%
Cap rate
0.6%
Rent to Value Ratio
Active
$735,000
4
bds
|
5
ba
|
3,858
sqft
|
built
2023
6621 E 153rd St S, Bixby, OK 74008
$-1,108
Cash flow
-7.9%
Cash-on-Cash Return
3.9%
Cap rate
0.6%
Rent to Value Ratio
Active
$420,000
5
bds
|
3
ba
|
3,044
sqft
|
built
2005
3261 E 145th Pl S, Bixby, OK 74008
$-492
Cash flow
-6.1%
Cash-on-Cash Return
4.3%
Cap rate
0.7%
Rent to Value Ratio
Active
$265,000
3
bds
|
2
ba
|
1,763
sqft
|
built
1979
11611 S 100th East Ave, Bixby, OK 74008
$-297
Cash flow
-5.8%
Cash-on-Cash Return
4.3%
Cap rate
0.6%
Rent to Value Ratio

Active
$349,000
2
bds
|
2
ba
|
1,941
sqft
|
built
1976
14250 E 202nd St S, Bixby, OK 74008
$-574
Cash flow
-8.6%
Cash-on-Cash Return
3.7%
Cap rate
0.5%
Rent to Value Ratio

Active
$274,000
3
bds
|
2
ba
|
1,584
sqft
|
built
2015
6022 E 148th St S, Bixby, OK 74008
$-336
Cash flow
-6.4%
Cash-on-Cash Return
4.2%
Cap rate
0.7%
Rent to Value Ratio
Active
$768,500
4
bds
|
6
ba
|
5,325
sqft
|
built
2004
6805 E 115th Pl S, Bixby, OK 74008
$-1,830
Cash flow
-12.4%
Cash-on-Cash Return
2.8%
Cap rate
0.5%
Rent to Value Ratio
Active
$699,900
4
bds
|
4
ba
|
4,892
sqft
|
built
2007
11170 S 72nd East Ave, Bixby, OK 74008
$-1,076
Cash flow
-8.0%
Cash-on-Cash Return
3.8%
Cap rate
0.6%
Rent to Value Ratio

Active
$350,000
4
bds
|
2
ba
|
2,017
sqft
|
built
2022
7117 E 154th Pl S, Bixby, OK 74008
$-598
Cash flow
-8.9%
Cash-on-Cash Return
3.6%
Cap rate
0.6%
Rent to Value Ratio
Active
$537,500
4
bds
|
3
ba
|
2,608
sqft
|
built
2024
12631 S Granite Ave, Bixby, OK 74008
$-361
Cash flow
-3.5%
Cash-on-Cash Return
4.9%
Cap rate
0.7%
Rent to Value Ratio
Active
$470,000
4
bds
|
3
ba
|
2,820
sqft
|
built
2022
2035 E 138th Pl S, Bixby, OK 74008
$-518
Cash flow
-5.8%
Cash-on-Cash Return
4.4%
Cap rate
0.7%
Rent to Value Ratio
Active
$745,000
4
bds
|
5
ba
|
4,782
sqft
|
built
2000
13706 S 18th St, Bixby, OK 74008
$-1,267
Cash flow
-8.9%
Cash-on-Cash Return
3.6%
Cap rate
0.5%
Rent to Value Ratio
Active
$540,000
4
bds
|
3
ba
|
2,984
sqft
|
built
2019
5312 E 124th Pl S, Bixby, OK 74008
$-700
Cash flow
-6.8%
Cash-on-Cash Return
4.1%
Cap rate
0.6%
Rent to Value Ratio