Bixby, OK Investment Properties for Sale
Browse homes for sale and investment properties in Bixby, OK. Refine your search by price, property type, or more.
Best cash flowing properties in Bixby, OK
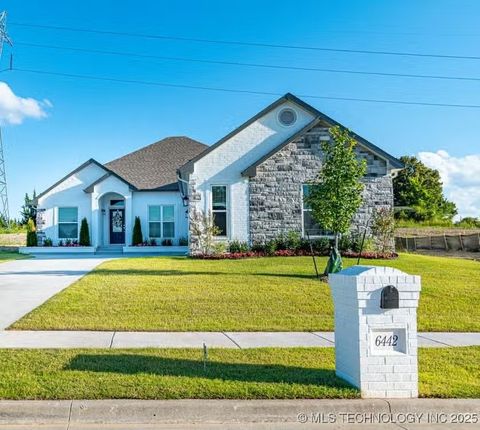
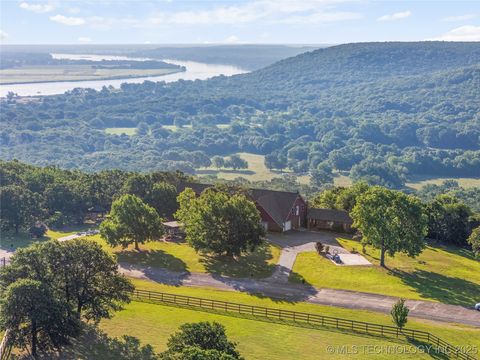
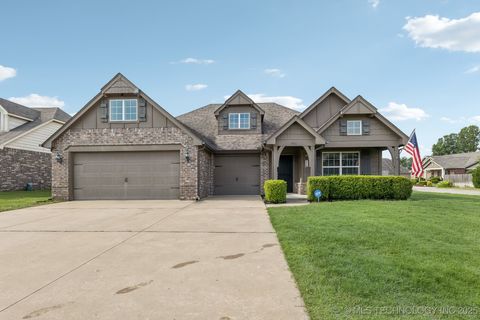
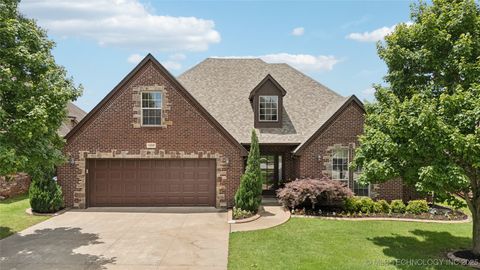
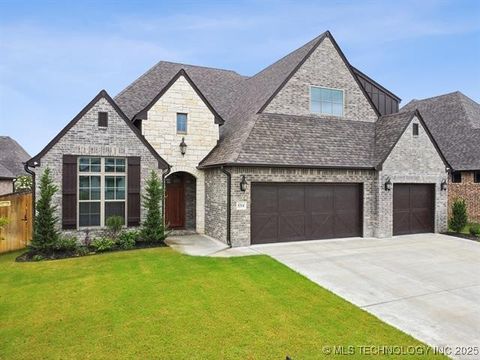
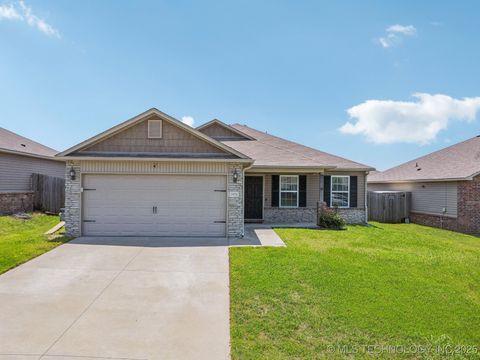
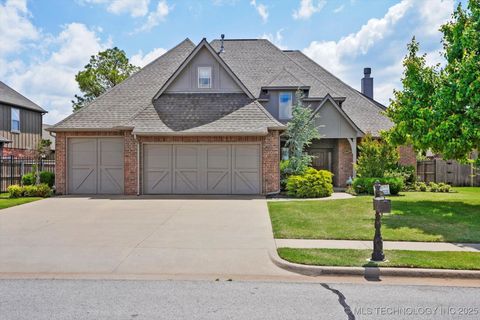
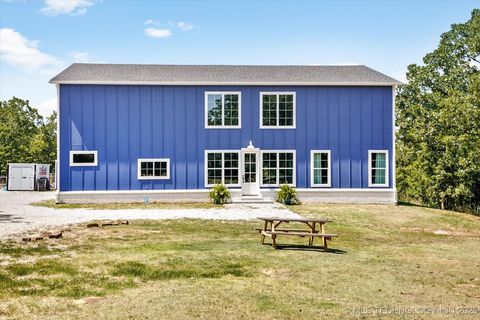
Active
$349,990
4
bds
|
2
ba
|
2,054
sqft
|
built
2019
6442 E 148th St S, Bixby, OK 74008
$36
Cash flow
0.5%
Cash-on-Cash Return
5.8%
Cap rate
0.7%
Rent to Value Ratio
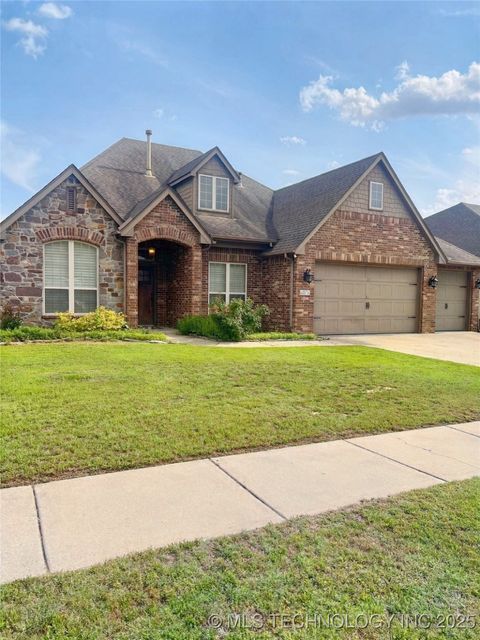
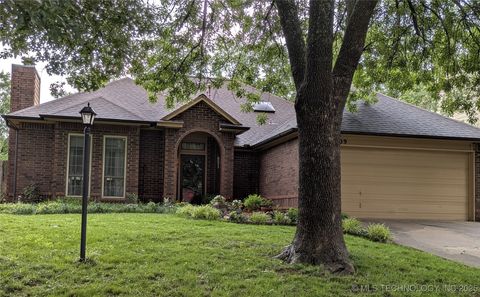
Active
$299,000
3
bds
|
3
ba
|
3,843
sqft
|
built
1999
15303 E 157th St S, Bixby, OK 74008
$21
Cash flow
0.4%
Cash-on-Cash Return
5.8%
Cap rate
0.8%
Rent to Value Ratio
112 out of 206 properties for sale in Bixby, OK
Limited Results Shown
Create a free account, or log in to reveal all property listings and enjoy the complete experience.
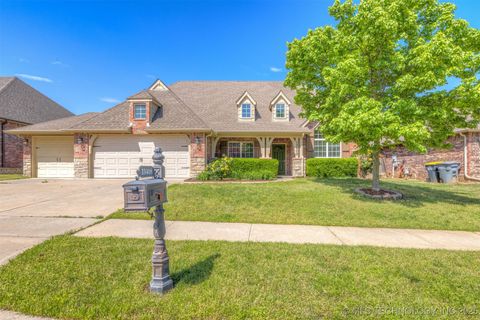
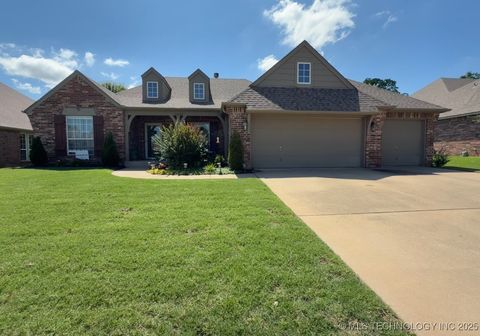
Active
$339,900
3
bds
|
2
ba
|
1,890
sqft
|
built
2021
9516 E 131st Pl S, Bixby, OK 74008
$-440
Cash flow
-6.8%
Cash-on-Cash Return
4.1%
Cap rate
0.6%
Rent to Value Ratio
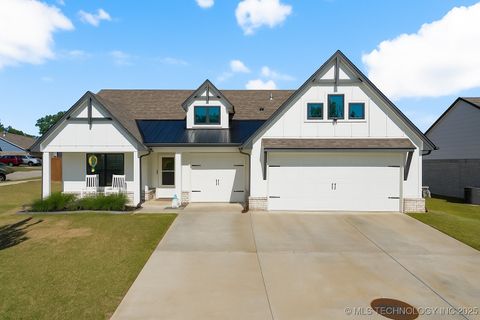
Active
$420,000
5
bds
|
3
ba
|
2,664
sqft
|
built
2005
12916 E 181st St S, Bixby, OK 74008
$-693
Cash flow
-8.6%
Cash-on-Cash Return
3.7%
Cap rate
0.6%
Rent to Value Ratio
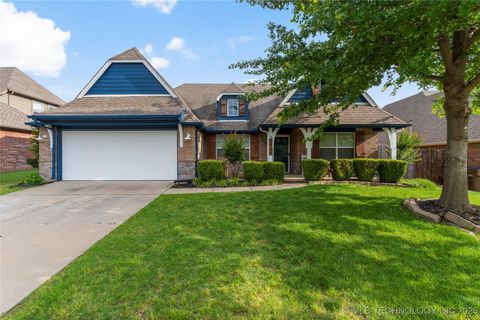
Active
$750,000
4
bds
|
5
ba
|
6,009
sqft
|
built
1979
17304 E 176th St S, Bixby, OK 74008
$-1,149
Cash flow
-8.0%
Cash-on-Cash Return
3.8%
Cap rate
0.5%
Rent to Value Ratio
Active
$439,000
6
bds
|
3
ba
|
2,947
sqft
|
built
2010
13408 S 19th Pl, Bixby, OK 74008
$-823
Cash flow
-9.8%
Cash-on-Cash Return
3.4%
Cap rate
0.6%
Rent to Value Ratio
Active
$335,000
4
bds
|
2
ba
|
1,800
sqft
|
built
2020
14315 S Harvard Ave, Bixby, OK 74008
$-591
Cash flow
-9.2%
Cash-on-Cash Return
3.6%
Cap rate
0.6%
Rent to Value Ratio
Active
$349,900
4
bds
|
2
ba
|
2,167
sqft
|
built
2010
1908 E 133rd Ct, Bixby, OK 74008
$-471
Cash flow
-7.0%
Cash-on-Cash Return
4.1%
Cap rate
0.6%
Rent to Value Ratio
Active
$324,900
3
bds
|
2
ba
|
1,925
sqft
|
built
2012
9036 E 139th St S, Bixby, OK 74008
$-431
Cash flow
-6.9%
Cash-on-Cash Return
4.1%
Cap rate
0.6%
Rent to Value Ratio
Active
$583,900
5
bds
|
4
ba
|
3,590
sqft
|
built
2018
12215 S Granite Ave E, Bixby, OK 74008
$-1,321
Cash flow
-11.8%
Cash-on-Cash Return
3.0%
Cap rate
0.5%
Rent to Value Ratio
Active
$399,000
3
bds
|
4
ba
|
2,298
sqft
|
built
1997
12920 E 183rd St S, Bixby, OK 74008
$-683
Cash flow
-8.9%
Cash-on-Cash Return
3.6%
Cap rate
0.6%
Rent to Value Ratio
Active
$299,000
3
bds
|
3
ba
|
3,843
sqft
|
built
1999
15303 E 157th St S, Bixby, OK 74008
$21
Cash flow
0.4%
Cash-on-Cash Return
5.8%
Cap rate
0.8%
Rent to Value Ratio
Active
$875,000
4
bds
|
5
ba
|
5,170
sqft
|
built
2014
6623 E 134th Pl S, Bixby, OK 74008
$-1,926
Cash flow
-11.5%
Cash-on-Cash Return
3.0%
Cap rate
0.5%
Rent to Value Ratio
Active
$415,000
4
bds
|
3
ba
|
2,940
sqft
|
built
2005
14538 S Urbana Ct, Bixby, OK 74008
$-413
Cash flow
-5.2%
Cash-on-Cash Return
4.5%
Cap rate
0.7%
Rent to Value Ratio
Active
$448,900
4
bds
|
3
ba
|
2,950
sqft
|
built
2009
6076 E 143rd Pl S, Bixby, OK 74008
$-723
Cash flow
-8.4%
Cash-on-Cash Return
3.7%
Cap rate
0.6%
Rent to Value Ratio
Active
$357,000
3
bds
|
2
ba
|
2,228
sqft
|
built
2004
11828 S 73rd East Ave, Bixby, OK 74008
$-538
Cash flow
-7.9%
Cash-on-Cash Return
3.9%
Cap rate
0.6%
Rent to Value Ratio
Active
$345,000
4
bds
|
2
ba
|
1,970
sqft
|
built
2007
4675 E 144th Pl S, Bixby, OK 74008
$-561
Cash flow
-8.5%
Cash-on-Cash Return
3.7%
Cap rate
0.6%
Rent to Value Ratio
Active
$579,900
4
bds
|
4
ba
|
3,349
sqft
|
built
2022
5314 E 125th St S, Bixby, OK 74008
$-1,100
Cash flow
-9.9%
Cash-on-Cash Return
3.4%
Cap rate
0.6%
Rent to Value Ratio
Active
$268,000
3
bds
|
2
ba
|
1,545
sqft
|
built
2017
5752 E 147th St S, Bixby, OK 74008
$-311
Cash flow
-6.1%
Cash-on-Cash Return
4.3%
Cap rate
0.7%
Rent to Value Ratio
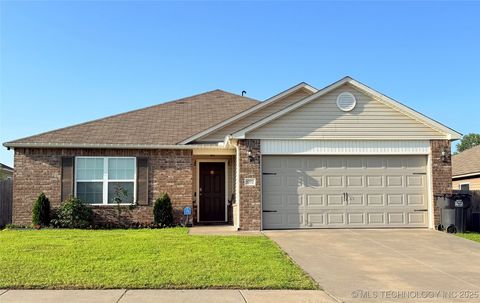
Active
$399,997
5
bds
|
4
ba
|
2,503
sqft
|
built
2021
6426 E 148th St S, Bixby, OK 74008
$-542
Cash flow
-7.1%
Cash-on-Cash Return
4.1%
Cap rate
0.7%
Rent to Value Ratio
Active
$445,000
4
bds
|
4
ba
|
3,145
sqft
|
built
2013
14285 S Lakewood Ave, Bixby, OK 74008
$-563
Cash flow
-6.6%
Cash-on-Cash Return
4.2%
Cap rate
0.7%
Rent to Value Ratio
Active
$230,000
3
bds
|
2
ba
|
1,340
sqft
|
built
2017
5976 E 147th Pl S, Bixby, OK 74008
$-92
Cash flow
-2.1%
Cash-on-Cash Return
5.2%
Cap rate
0.8%
Rent to Value Ratio
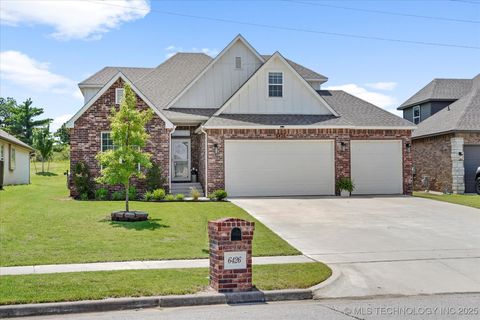
Active
$349,990
4
bds
|
2
ba
|
2,054
sqft
|
built
2019
6442 E 148th St S, Bixby, OK 74008
$36
Cash flow
0.5%
Cash-on-Cash Return
5.8%
Cap rate
0.7%
Rent to Value Ratio
Active
$1,220,000
3
bds
|
4
ba
|
3,706
sqft
|
built
2007
2923 E 134th St S, Bixby, OK 74008
$-4,051
Cash flow
-17.3%
Cash-on-Cash Return
1.7%
Cap rate
0.3%
Rent to Value Ratio
Active
$240,000
3
bds
|
3
ba
|
1,832
sqft
|
built
1980
15051 E 202nd St S, Bixby, OK 74008
$-201
Cash flow
-4.4%
Cash-on-Cash Return
4.7%
Cap rate
0.7%
Rent to Value Ratio
Active
$520,000
4
bds
|
3
ba
|
0
sqft
|
built
2008
3176 E 146th Pl S, Bixby, OK 74008
$-798
Cash flow
-8.0%
Cash-on-Cash Return
3.8%
Cap rate
0.6%
Rent to Value Ratio
Active
$449,900
4
bds
|
4
ba
|
3,125
sqft
|
built
2003
11715 S 93rd East Ave, Bixby, OK 74008
$-612
Cash flow
-7.1%
Cash-on-Cash Return
4.0%
Cap rate
0.6%
Rent to Value Ratio
Active
$307,900
3
bds
|
2
ba
|
1,923
sqft
|
built
2002
4610 E 142nd St S, Bixby, OK 74008
$-355
Cash flow
-6.0%
Cash-on-Cash Return
4.3%
Cap rate
0.6%
Rent to Value Ratio
Active
$449,000
4
bds
|
3
ba
|
2,680
sqft
|
built
2022
13657 S 21st Ct E, Bixby, OK 74008
$-290
Cash flow
-3.4%
Cash-on-Cash Return
4.9%
Cap rate
0.7%
Rent to Value Ratio
Active
$649,000
3
bds
|
5
ba
|
3,835
sqft
|
built
2013
14444 S 50th East Ave, Bixby, OK 74008
$-749
Cash flow
-6.0%
Cash-on-Cash Return
4.3%
Cap rate
0.6%
Rent to Value Ratio
Active
$447,500
3
bds
|
2
ba
|
2,100
sqft
|
built
2021
10215 E 121st Pl S, Bixby, OK 74008
$-1,074
Cash flow
-12.5%
Cash-on-Cash Return
2.8%
Cap rate
0.5%
Rent to Value Ratio
Active
$1,150,000
5
bds
|
5
ba
|
4,829
sqft
|
built
2024
5508 E 127th St S, Bixby, OK 74008
$-4,382
Cash flow
-19.9%
Cash-on-Cash Return
1.1%
Cap rate
0.3%
Rent to Value Ratio
Active
$415,000
4
bds
|
4
ba
|
3,233
sqft
|
built
2005
14550 S Urbana Ct, Bixby, OK 74008
$-694
Cash flow
-8.7%
Cash-on-Cash Return
3.7%
Cap rate
0.6%
Rent to Value Ratio
Active
$995,000
5
bds
|
5
ba
|
4,986
sqft
|
built
2001
11406 S 69th East Ave, Bixby, OK 74008
$-1,585
Cash flow
-8.3%
Cash-on-Cash Return
3.8%
Cap rate
0.6%
Rent to Value Ratio
Active
$550,000
4
bds
|
5
ba
|
3,476
sqft
|
built
2012
12643 S 67th East Ave, Bixby, OK 74008
$-1,213
Cash flow
-11.5%
Cash-on-Cash Return
3.0%
Cap rate
0.5%
Rent to Value Ratio
Active
$278,500
3
bds
|
2
ba
|
1,967
sqft
|
built
1988
11309 S 107th East Ave, Bixby, OK 74008
$-285
Cash flow
-5.3%
Cash-on-Cash Return
4.5%
Cap rate
0.6%
Rent to Value Ratio
Active
$468,000
4
bds
|
3
ba
|
2,740
sqft
|
built
2022
13859 S 21st Ct E, Bixby, OK 74008
$-711
Cash flow
-7.9%
Cash-on-Cash Return
3.9%
Cap rate
0.5%
Rent to Value Ratio
Active
$565,000
4
bds
|
4
ba
|
2,657
sqft
|
built
2022
2978 E 146th St S, Bixby, OK 74008
$-1,090
Cash flow
-10.1%
Cash-on-Cash Return
3.4%
Cap rate
0.6%
Rent to Value Ratio
Active
$565,000
5
bds
|
3
ba
|
3,829
sqft
|
built
2022
14215 E 208th St S, Bixby, OK 74008
$-281
Cash flow
-2.6%
Cash-on-Cash Return
5.1%
Cap rate
0.6%
Rent to Value Ratio
Active
$565,000
4
bds
|
4
ba
|
3,605
sqft
|
built
2018
12464 S 105th East Ave, Bixby, OK 74008
$-612
Cash flow
-5.7%
Cash-on-Cash Return
4.4%
Cap rate
0.7%
Rent to Value Ratio
Active
$535,000
3
bds
|
2
ba
|
1,696
sqft
|
built
1971
16522 S Peoria Ave, Bixby, OK 74008
$-1,502
Cash flow
-14.6%
Cash-on-Cash Return
2.3%
Cap rate
0.3%
Rent to Value Ratio
Active
$2,250,000
4
bds
|
5
ba
|
5,606
sqft
|
built
1999
3511 E 181st St S, Bixby, OK 74008
$-9,264
Cash flow
-21.5%
Cash-on-Cash Return
0.7%
Cap rate
0.2%
Rent to Value Ratio