Bixby, OK Investment Properties for Sale
Browse homes for sale and investment properties in Bixby, OK. Refine your search by price, property type, or more.
Best cash flowing properties in Bixby, OK
Active
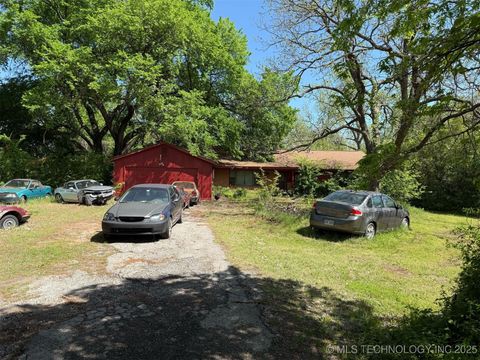
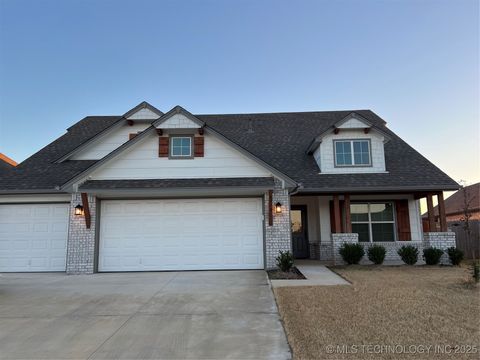
$159,999
5
bds
|
4
ba
|
2,921
sqft
|
built
1964
8721 E 171st St S, Bixby, OK 74008
$481
Cash flow
15.7%
Cash-on-Cash Return
9.3%
Cap rate
1.3%
Rent to Value Ratio
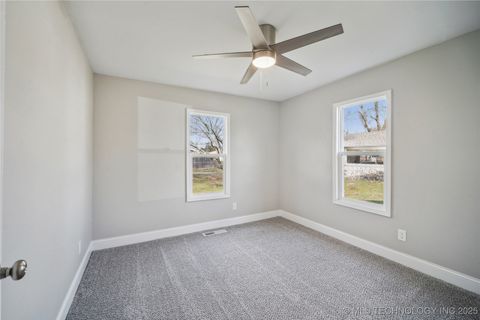
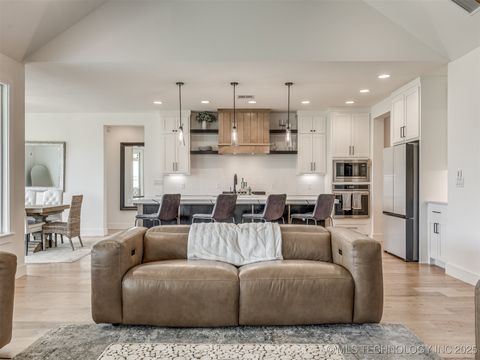
Active
$218,000
3
bds
|
2
ba
|
1,566
sqft
|
built
1955
8301 E 133rd St S, Bixby, OK 74008
$-2
Cash flow
0.0%
Cash-on-Cash Return
5.7%
Cap rate
0.7%
Rent to Value Ratio
131 out of 193 properties for sale in Bixby, OK
Limited Results Shown
Create a free account, or log in to reveal all property listings and enjoy the complete experience.
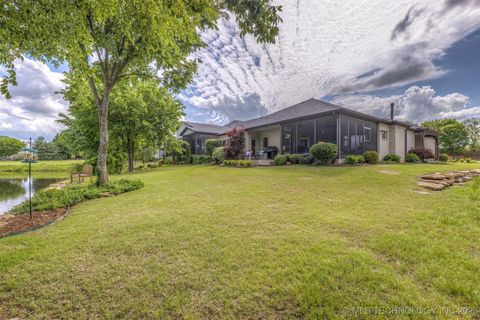
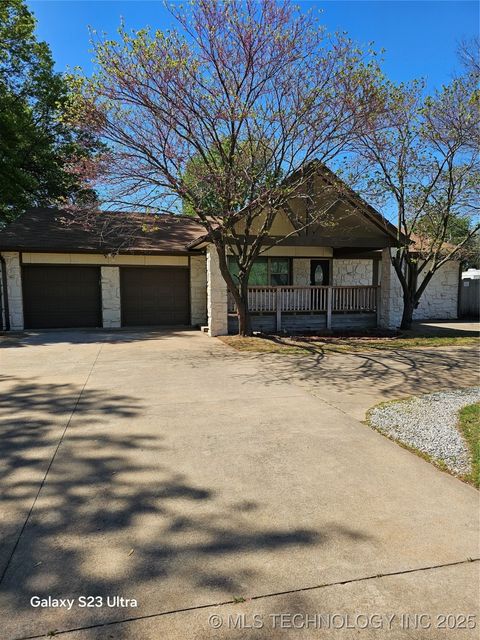
Active
$498,000
2
bds
|
2
ba
|
2,083
sqft
|
built
2018
12905 S 27th St, Bixby, OK 74008
$-1,035
Cash flow
-10.8%
Cash-on-Cash Return
3.2%
Cap rate
0.5%
Rent to Value Ratio
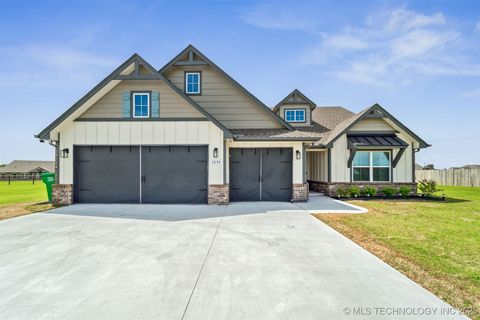
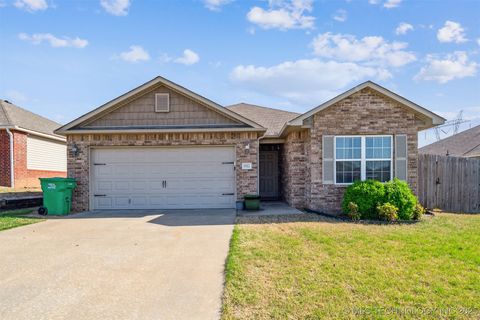
Active
$449,975
3
bds
|
3
ba
|
2,309
sqft
|
built
2023
3494 E 155th St S, Bixby, OK 74008
$-701
Cash flow
-8.1%
Cash-on-Cash Return
3.8%
Cap rate
0.6%
Rent to Value Ratio
Active
$567,900
4
bds
|
3
ba
|
2,841
sqft
|
built
2022
12509 S 102nd East Ave, Bixby, OK 74008
$-1,470
Cash flow
-13.5%
Cash-on-Cash Return
2.6%
Cap rate
0.5%
Rent to Value Ratio

Active
$965,000
4
bds
|
5
ba
|
4,181
sqft
|
built
2022
2611 E 136th St S, Bixby, OK 74008
$-3,275
Cash flow
-17.7%
Cash-on-Cash Return
1.6%
Cap rate
0.3%
Rent to Value Ratio
Active
$799,900
4
bds
|
4
ba
|
3,379
sqft
|
built
2022
13641 S 27th St, Bixby, OK 74008
$-2,341
Cash flow
-15.3%
Cash-on-Cash Return
2.2%
Cap rate
0.4%
Rent to Value Ratio
Active
$489,000
4
bds
|
4
ba
|
3,058
sqft
|
built
2016
13816 S 23rd Pl, Bixby, OK 74008
$-689
Cash flow
-7.4%
Cash-on-Cash Return
4.0%
Cap rate
0.7%
Rent to Value Ratio
Active
$289,900
3
bds
|
2
ba
|
1,741
sqft
|
built
2007
13323 S 21st St, Bixby, OK 74008
$-479
Cash flow
-8.6%
Cash-on-Cash Return
3.7%
Cap rate
0.6%
Rent to Value Ratio
Active
$525,000
4
bds
|
3
ba
|
2,490
sqft
|
built
2022
13722 S 20th Pl E, Bixby, OK 74008
$-393
Cash flow
-3.9%
Cash-on-Cash Return
4.8%
Cap rate
0.7%
Rent to Value Ratio
Active
$224,000
3
bds
|
2
ba
|
1,139
sqft
|
built
2018
5974 E 146th Pl S, Bixby, OK 74008
$-155
Cash flow
-3.6%
Cash-on-Cash Return
4.8%
Cap rate
0.7%
Rent to Value Ratio
Active
$485,000
4
bds
|
3
ba
|
3,171
sqft
|
built
2016
7056 E 124th St S, Bixby, OK 74008
$-845
Cash flow
-9.1%
Cash-on-Cash Return
3.6%
Cap rate
0.6%
Rent to Value Ratio
Active
$495,000
5
bds
|
4
ba
|
2,512
sqft
|
built
2023
5916 E 127th St S, Bixby, OK 74008
$-606
Cash flow
-6.4%
Cash-on-Cash Return
4.2%
Cap rate
0.5%
Rent to Value Ratio
Active
$245,000
3
bds
|
2
ba
|
1,467
sqft
|
built
2015
5736 E 148th St S, Bixby, OK 74008
$-173
Cash flow
-3.7%
Cash-on-Cash Return
4.8%
Cap rate
0.7%
Rent to Value Ratio
Active
$319,000
3
bds
|
2
ba
|
1,717
sqft
|
built
2019
9409 E 131st Pl S, Bixby, OK 74008
$-1,033
Cash flow
-16.9%
Cash-on-Cash Return
1.8%
Cap rate
0.6%
Rent to Value Ratio
Active
$320,000
3
bds
|
2
ba
|
2,139
sqft
|
built
2003
11717 S 96th East Pl, Bixby, OK 74008
$-493
Cash flow
-8.0%
Cash-on-Cash Return
3.8%
Cap rate
0.6%
Rent to Value Ratio
Active
$625,000
4
bds
|
5
ba
|
4,350
sqft
|
built
2002
6619 E 114th St S, Bixby, OK 74008
$-1,204
Cash flow
-10.1%
Cash-on-Cash Return
3.4%
Cap rate
0.6%
Rent to Value Ratio
Active
$369,000
4
bds
|
2
ba
|
2,048
sqft
|
built
2021
6370 E 124th Ct S, Bixby, OK 74008
$-638
Cash flow
-9.0%
Cash-on-Cash Return
3.6%
Cap rate
0.6%
Rent to Value Ratio
Active
$515,000
4
bds
|
3
ba
|
2,627
sqft
|
built
2022
3005 E 146th Pl S, Bixby, OK 74008
$-684
Cash flow
-6.9%
Cash-on-Cash Return
4.1%
Cap rate
0.7%
Rent to Value Ratio
Active
$350,000
4
bds
|
2
ba
|
1,961
sqft
|
built
1985
8512 E 121st St S, Bixby, OK 74008
$-625
Cash flow
-9.3%
Cash-on-Cash Return
3.5%
Cap rate
0.5%
Rent to Value Ratio
Active
$229,000
3
bds
|
2
ba
|
1,321
sqft
|
built
2016
5922 E 148th Pl S, Bixby, OK 74008
$-208
Cash flow
-4.7%
Cash-on-Cash Return
4.6%
Cap rate
0.7%
Rent to Value Ratio
Active
$535,000
5
bds
|
3
ba
|
3,356
sqft
|
built
2015
6807 E 125th St S, Bixby, OK 74008
$-1,097
Cash flow
-10.7%
Cash-on-Cash Return
3.2%
Cap rate
0.5%
Rent to Value Ratio
Active
$515,000
5
bds
|
3
ba
|
2,856
sqft
|
built
2020
12517 S Kingston Ave, Bixby, OK 74008
$-1,001
Cash flow
-10.1%
Cash-on-Cash Return
3.3%
Cap rate
0.5%
Rent to Value Ratio
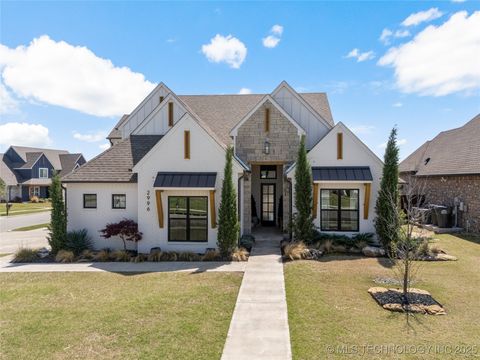
Active
$599,000
4
bds
|
4
ba
|
2,877
sqft
|
built
2020
2996 E 142nd Ct S, Bixby, OK 74008
$-1,231
Cash flow
-10.7%
Cash-on-Cash Return
3.2%
Cap rate
0.5%
Rent to Value Ratio
Active
$324,900
3
bds
|
3
ba
|
2,599
sqft
|
built
1994
2141 E 140th Pl S, Bixby, OK 74008
$-364
Cash flow
-5.8%
Cash-on-Cash Return
4.3%
Cap rate
0.6%
Rent to Value Ratio
Active
$565,000
4
bds
|
4
ba
|
2,918
sqft
|
built
2022
13634 S 20th Pl E, Bixby, OK 74008
$-817
Cash flow
-7.5%
Cash-on-Cash Return
3.9%
Cap rate
0.6%
Rent to Value Ratio
Active
$389,500
4
bds
|
3
ba
|
2,861
sqft
|
built
2000
11715 S 94th East Ave, Bixby, OK 74008
$-476
Cash flow
-6.4%
Cash-on-Cash Return
4.2%
Cap rate
0.6%
Rent to Value Ratio
Active
$1,500,000
4
bds
|
6
ba
|
6,200
sqft
|
built
2010
1580 E 151st St S, Bixby, OK 74008
$-4,221
Cash flow
-14.7%
Cash-on-Cash Return
2.3%
Cap rate
0.3%
Rent to Value Ratio
Active
$349,000
4
bds
|
3
ba
|
1,898
sqft
|
built
2022
13119 S 72nd East Ave, Bixby, OK 74008
$-543
Cash flow
-8.1%
Cash-on-Cash Return
3.8%
Cap rate
0.7%
Rent to Value Ratio
Active
$538,000
3
bds
|
3
ba
|
2,898
sqft
|
built
2021
12202 S 102nd East Ave, Bixby, OK 74008
$-1,306
Cash flow
-12.7%
Cash-on-Cash Return
2.8%
Cap rate
0.5%
Rent to Value Ratio
Active
$429,000
4
bds
|
3
ba
|
2,201
sqft
|
built
2021
12085 S 68th East Ave, Bixby, OK 74008
$-564
Cash flow
-6.9%
Cash-on-Cash Return
4.1%
Cap rate
0.7%
Rent to Value Ratio
Active
$534,900
4
bds
|
4
ba
|
3,239
sqft
|
built
2021
5519 E 123rd St S, Bixby, OK 74008
$-684
Cash flow
-6.7%
Cash-on-Cash Return
4.1%
Cap rate
0.7%
Rent to Value Ratio
Active
$450,000
6
bds
|
4
ba
|
4,075
sqft
|
built
2001
11727 S 91st East Ave, Bixby, OK 74008
$-695
Cash flow
-8.1%
Cash-on-Cash Return
3.8%
Cap rate
0.6%
Rent to Value Ratio
Active
$445,900
5
bds
|
3
ba
|
2,916
sqft
|
built
2009
1946 E 135th St S, Bixby, OK 74008
$-710
Cash flow
-8.3%
Cash-on-Cash Return
3.8%
Cap rate
0.6%
Rent to Value Ratio
Active
$275,000
2
bds
|
1
ba
|
972
sqft
|
built
1950
14936 S Sheridan Rd, Bixby, OK 74008
$-320
Cash flow
-6.1%
Cash-on-Cash Return
4.3%
Cap rate
0.5%
Rent to Value Ratio
Active
$525,000
5
bds
|
4
ba
|
4,069
sqft
|
built
2006
7296 E 112th Pl S, Bixby, OK 74008
$-1,097
Cash flow
-10.9%
Cash-on-Cash Return
3.2%
Cap rate
0.6%
Rent to Value Ratio
Active
$794,900
4
bds
|
5
ba
|
4,496
sqft
|
built
2010
1721 E 136th Pl S, Bixby, OK 74008
$-1,333
Cash flow
-8.7%
Cash-on-Cash Return
3.7%
Cap rate
0.6%
Rent to Value Ratio
Active
$500,000
4
bds
|
4
ba
|
4,465
sqft
|
built
2000
14322 S 50th East Ave, Bixby, OK 74008
$-632
Cash flow
-6.6%
Cash-on-Cash Return
4.2%
Cap rate
0.6%
Rent to Value Ratio
Active
$330,000
3
bds
|
2
ba
|
1,933
sqft
|
built
2018
3838 E 144th St S, Bixby, OK 74008
$-545
Cash flow
-8.6%
Cash-on-Cash Return
3.7%
Cap rate
0.6%
Rent to Value Ratio
Active
$750,000
5
bds
|
4
ba
|
4,869
sqft
|
built
1995
11202 S 66th East Ave, Bixby, OK 74008
$-1,710
Cash flow
-11.9%
Cash-on-Cash Return
2.9%
Cap rate
0.5%
Rent to Value Ratio