Bolingbrook, IL Investment Properties for Sale
Browse homes for sale and investment properties in Bolingbrook, IL. Refine your search by price, property type, or more.
Best cash flowing properties in Bolingbrook, IL
Active
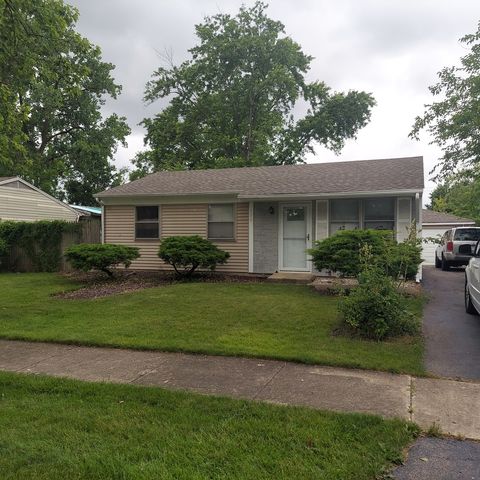
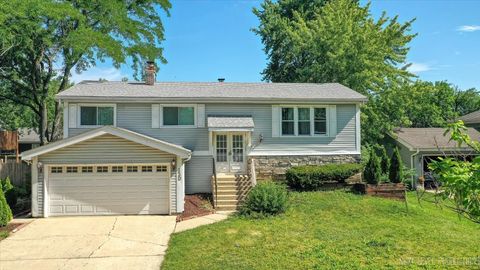
$249,900
2
bds
|
1
ba
|
1,000
sqft
|
built
1972
129 Galewood Dr, Bolingbrook, IL 60440
$137
Cash flow
2.9%
Cash-on-Cash Return
6.3%
Cap rate
1.0%
Rent to Value Ratio
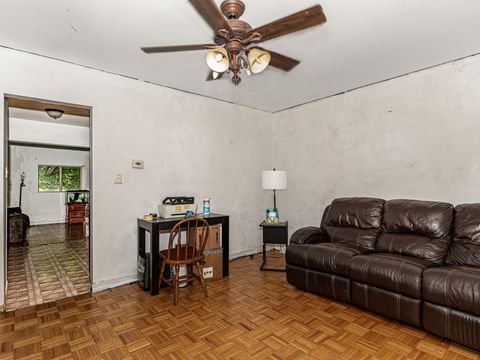
Active
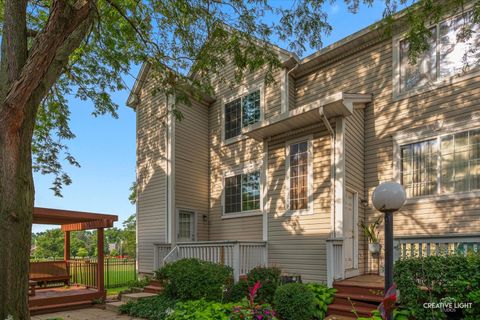
$242,500
3
bds
|
1
ba
|
1,112
sqft
|
built
1970
218 Bedford Rd, Bolingbrook, IL 60440
$132
Cash flow
2.8%
Cash-on-Cash Return
6.3%
Cap rate
1.0%
Rent to Value Ratio
45 out of 62 properties for sale in Bolingbrook, IL
Limited Results Shown
Create a free account, or log in to reveal all property listings and enjoy the complete experience.
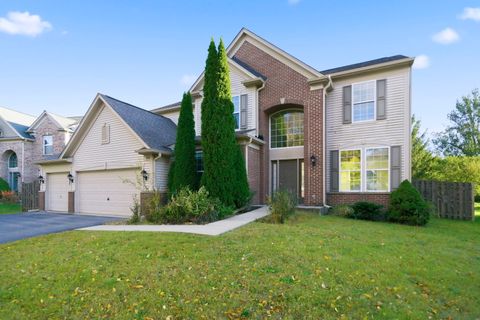
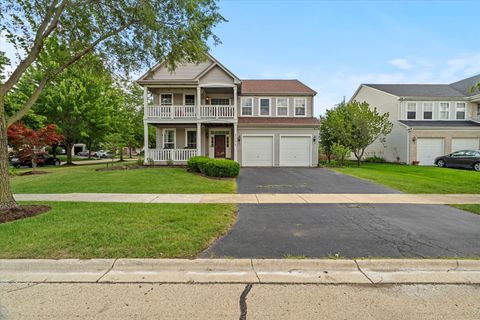
Active
$529,600
4
bds
|
3
ba
|
2,894
sqft
|
built
2005
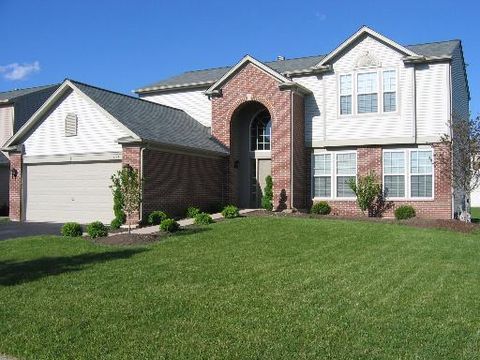
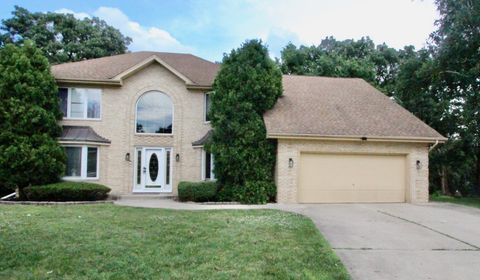
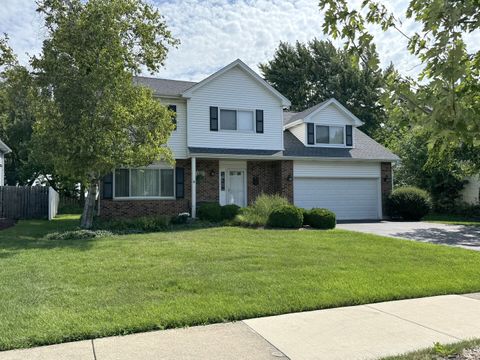
402 Marshall Ash St, Bolingbrook, IL 60490
$-1,743
Cash flow
-17.2%
Cash-on-Cash Return
1.7%
Cap rate
0.6%
Rent to Value Ratio
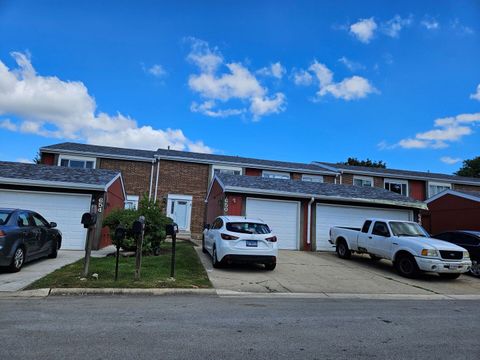
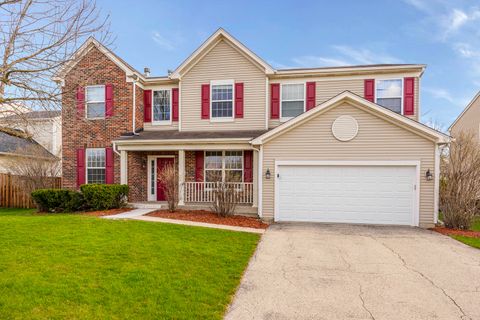
Active
$275,000
3
bds
|
3
ba
|
1,536
sqft
|
built
1974
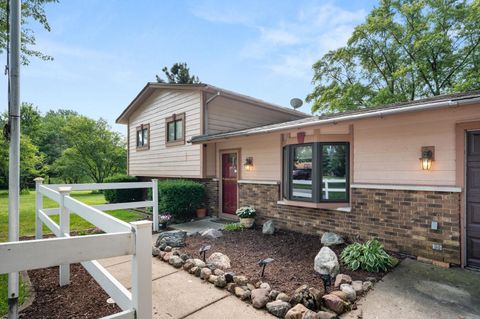
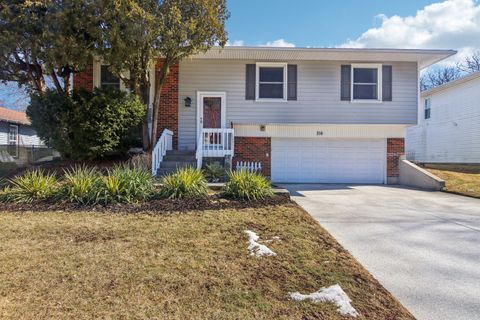
650 Sundance Dr, Bolingbrook, IL 60440
$-305
Cash flow
-5.8%
Cash-on-Cash Return
4.3%
Cap rate
0.9%
Rent to Value Ratio
Active
$270,000
2
bds
|
2
ba
|
1,312
sqft
|
built
1993
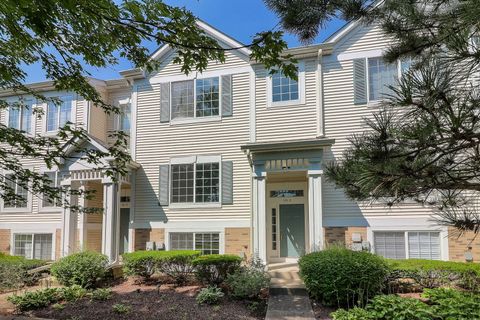
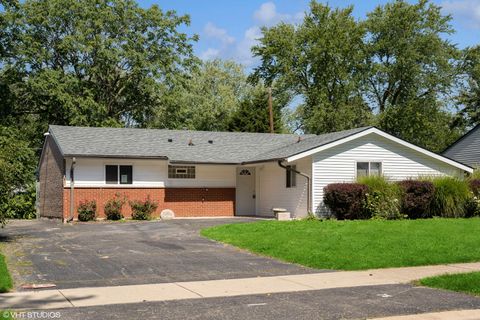
321 Whispering Ct, Bolingbrook, IL 60440
$-240
Cash flow
-4.6%
Cash-on-Cash Return
4.6%
Cap rate
0.9%
Rent to Value Ratio
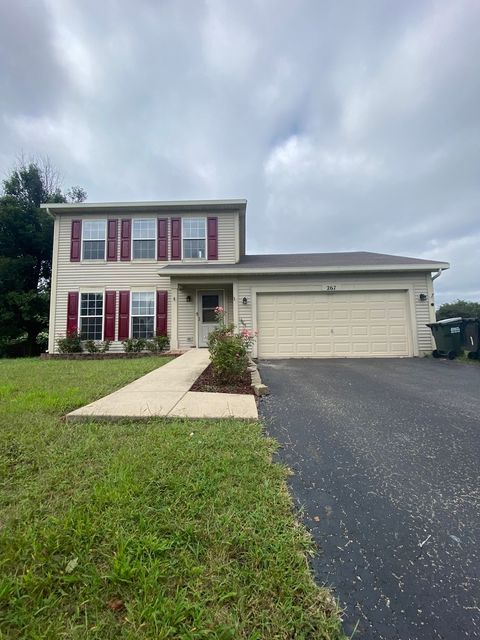
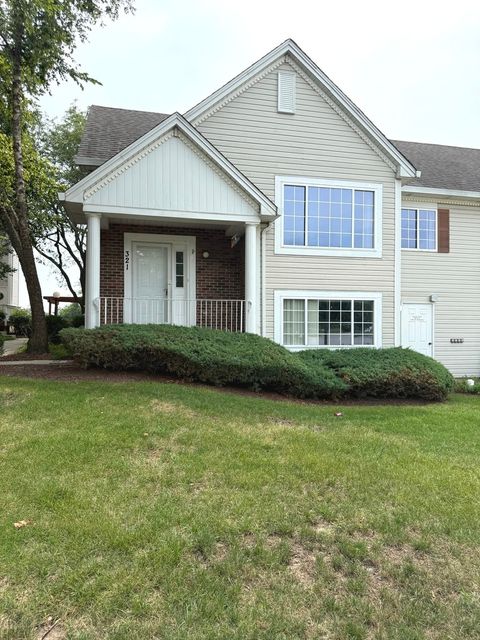
Active
$395,000
3
bds
|
3
ba
|
1,579
sqft
|
built
2003
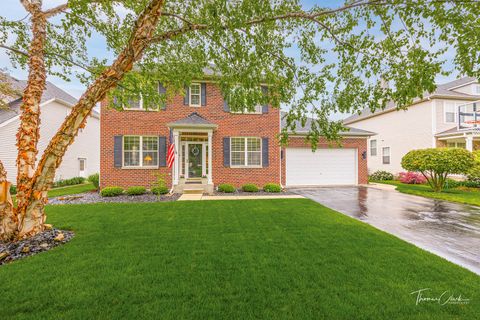
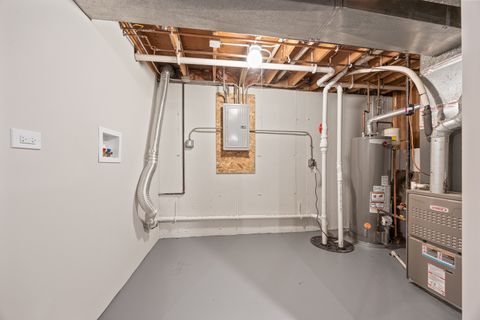
267 Clarendon Ln, Bolingbrook, IL 60440
$-882
Cash flow
-11.6%
Cash-on-Cash Return
3.0%
Cap rate
0.7%
Rent to Value Ratio
Active
$520,000
4
bds
|
4
ba
|
2,593
sqft
|
built
1996
11 Roanoke Ct, Bolingbrook, IL 60440
$-997
Cash flow
-10.0%
Cash-on-Cash Return
3.4%
Cap rate
0.8%
Rent to Value Ratio
Active
$390,000
4
bds
|
2
ba
|
1,700
sqft
|
built
1994
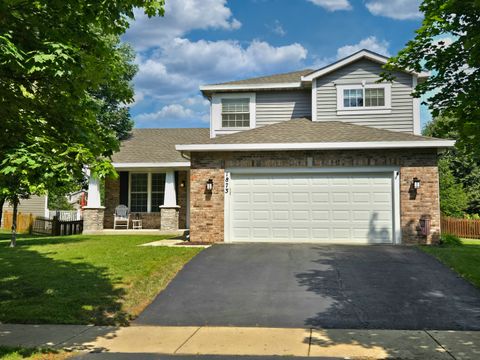
664 Birchwood Dr, Bolingbrook, IL 60490
$-899
Cash flow
-12.0%
Cash-on-Cash Return
2.9%
Cap rate
0.7%
Rent to Value Ratio
Active
$489,000
4
bds
|
3
ba
|
2,267
sqft
|
built
2005
254 S Cranberry St, Bolingbrook, IL 60490
$-1,350
Cash flow
-14.4%
Cash-on-Cash Return
2.4%
Cap rate
0.7%
Rent to Value Ratio
Active
$359,900
3
bds
|
2
ba
|
1,932
sqft
|
built
1964
101 Seabury Rd, Bolingbrook, IL 60440
$-460
Cash flow
-6.7%
Cash-on-Cash Return
4.1%
Cap rate
0.8%
Rent to Value Ratio
Active
$335,000
2
bds
|
3
ba
|
1,798
sqft
|
built
2002
101 Enclave Cir, Bolingbrook, IL 60440
$-545
Cash flow
-8.5%
Cash-on-Cash Return
3.7%
Cap rate
0.8%
Rent to Value Ratio
Active
$524,900
4
bds
|
3
ba
|
2,613
sqft
|
built
2003
725 Delacourte Ave, Bolingbrook, IL 60490
$-1,077
Cash flow
-10.7%
Cash-on-Cash Return
3.2%
Cap rate
0.7%
Rent to Value Ratio
Active
$270,000
3
bds
|
1
ba
|
1,115
sqft
|
built
1961
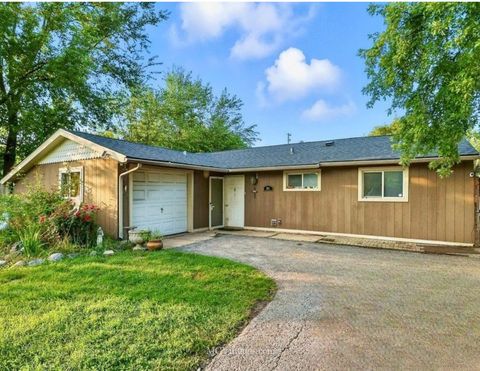
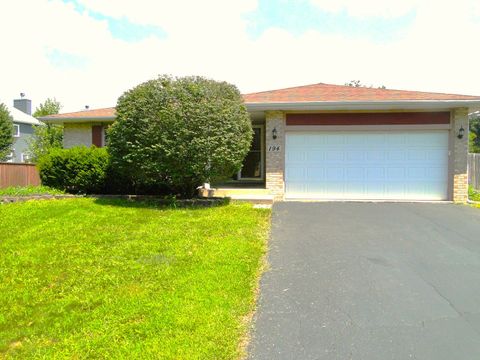
184 Fairwood Dr, Bolingbrook, IL 60440
$-18
Cash flow
-0.3%
Cash-on-Cash Return
5.6%
Cap rate
0.9%
Rent to Value Ratio
Active
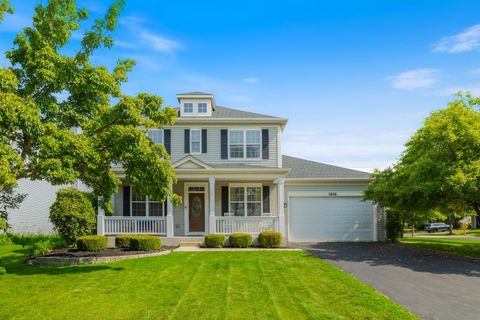
$450,000
3
bds
|
2
ba
|
1,900
sqft
|
built
1993
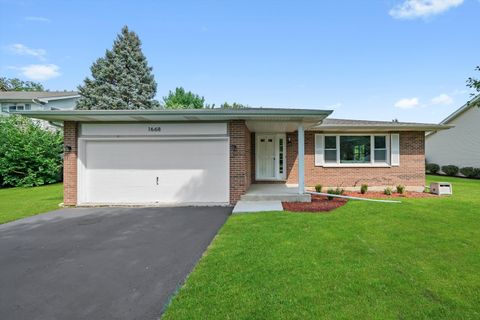
1668 Hidden Valley Dr, Bolingbrook, IL 60490
$-704
Cash flow
-8.2%
Cash-on-Cash Return
3.8%
Cap rate
0.7%
Rent to Value Ratio
Active
$418,000
4
bds
|
3
ba
|
2,613
sqft
|
built
2004
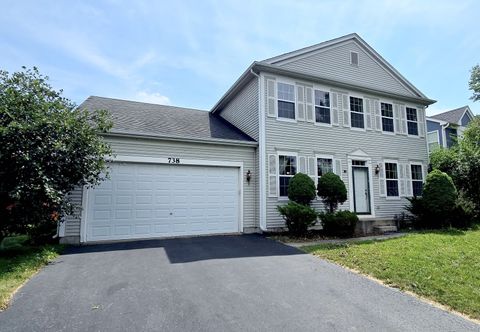
738 Bethel Ave, Bolingbrook, IL 60490
$-476
Cash flow
-5.9%
Cash-on-Cash Return
4.3%
Cap rate
0.9%
Rent to Value Ratio
Active
$399,000
4
bds
|
2
ba
|
1,768
sqft
|
built
1978
109 Commonwealth Dr, Bolingbrook, IL 60440
$-540
Cash flow
-7.1%
Cash-on-Cash Return
4.1%
Cap rate
0.7%
Rent to Value Ratio
Active
$399,900
3
bds
|
2
ba
|
1,981
sqft
|
built
1974
304 N Pinecrest Rd, Bolingbrook, IL 60440
$-615
Cash flow
-8.0%
Cash-on-Cash Return
3.8%
Cap rate
0.7%
Rent to Value Ratio
Active
$540,000
4
bds
|
4
ba
|
2,395
sqft
|
built
2003
1616 Sutton Pl, Bolingbrook, IL 60490
$-1,121
Cash flow
-10.8%
Cash-on-Cash Return
3.2%
Cap rate
0.6%
Rent to Value Ratio
Active
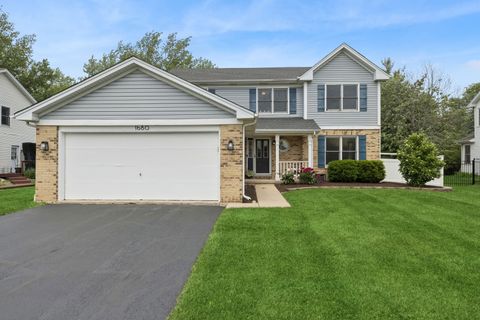
$479,900
4
bds
|
3
ba
|
2,225
sqft
|
built
1993
1680 Hidden Valley Dr, Bolingbrook, IL 60490
$-940
Cash flow
-10.2%
Cash-on-Cash Return
3.3%
Cap rate
0.7%
Rent to Value Ratio
Active
$689,000
4
bds
|
4
ba
|
2,818
sqft
|
built
2000
1424 Sage Dr, Bolingbrook, IL 60490
$-1,673
Cash flow
-12.7%
Cash-on-Cash Return
2.8%
Cap rate
0.6%
Rent to Value Ratio
Active
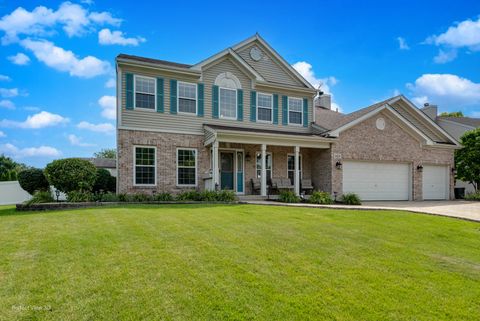
$439,900
3
bds
|
2
ba
|
1,900
sqft
|
built
1995
194 Silverado St, Bolingbrook, IL 60490
$-598
Cash flow
-7.1%
Cash-on-Cash Return
4.0%
Cap rate
0.7%
Rent to Value Ratio
Active
$365,000
4
bds
|
3
ba
|
1,915
sqft
|
built
1971
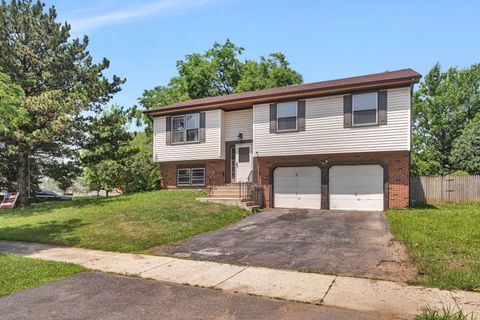
411 Liberty Dr, Bolingbrook, IL 60440
$-442
Cash flow
-6.3%
Cash-on-Cash Return
4.2%
Cap rate
0.8%
Rent to Value Ratio
Active
$625,000
4
bds
|
3
ba
|
2,816
sqft
|
built
1994
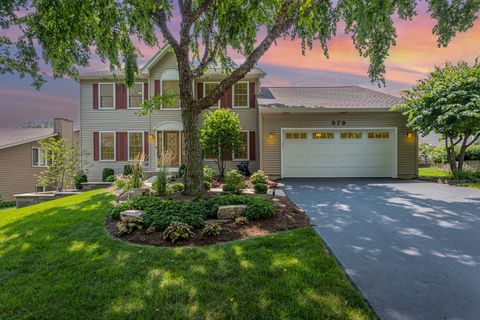
579 Seth St, Bolingbrook, IL 60440
$-1,248
Cash flow
-10.4%
Cash-on-Cash Return
3.3%
Cap rate
0.6%
Rent to Value Ratio
Active
$319,900
3
bds
|
2
ba
|
0
sqft
|
built
1963
192 Vernon Dr, Bolingbrook, IL 60440
$-322
Cash flow
-5.3%
Cash-on-Cash Return
4.5%
Cap rate
0.8%
Rent to Value Ratio
Active
$469,900
4
bds
|
4
ba
|
2,543
sqft
|
built
1995
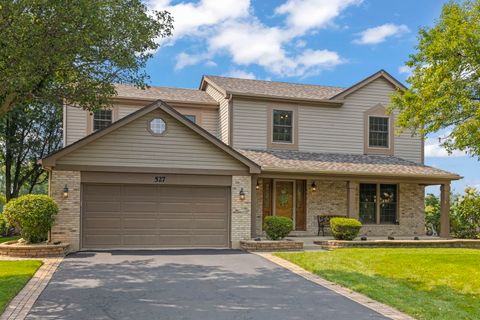
527 Springwood Ln, Bolingbrook, IL 60440
$-853
Cash flow
-9.5%
Cash-on-Cash Return
3.5%
Cap rate
0.7%
Rent to Value Ratio
Active
$360,000
4
bds
|
3
ba
|
1,915
sqft
|
built
1971
616 N Pinecrest Rd, Bolingbrook, IL 60440
$-394
Cash flow
-5.7%
Cash-on-Cash Return
4.4%
Cap rate
0.8%
Rent to Value Ratio
Active
$323,000
3
bds
|
3
ba
|
1,971
sqft
|
built
1993
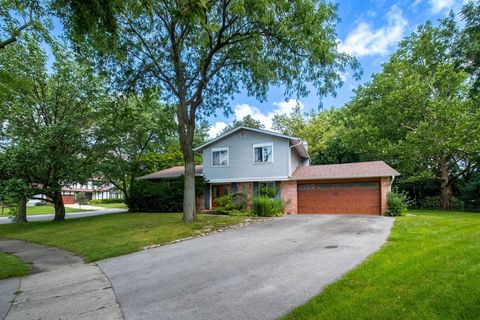
424 Van Gogh Cir, Bolingbrook, IL 60440
$-670
Cash flow
-10.8%
Cash-on-Cash Return
3.2%
Cap rate
0.8%
Rent to Value Ratio
Active
$639,000
5
bds
|
4
ba
|
3,930
sqft
|
built
2002
2198 Kemmerer Ln, Bolingbrook, IL 60490
$-1,599
Cash flow
-13.1%
Cash-on-Cash Return
2.7%
Cap rate
0.5%
Rent to Value Ratio
Active
$359,000
5
bds
|
3
ba
|
2,220
sqft
|
built
1973
530 Cottonwood Cir, Bolingbrook, IL 60440
$-491
Cash flow
-7.1%
Cash-on-Cash Return
4.0%
Cap rate
0.8%
Rent to Value Ratio
Active
$290,000
3
bds
|
3
ba
|
1,452
sqft
|
built
1993
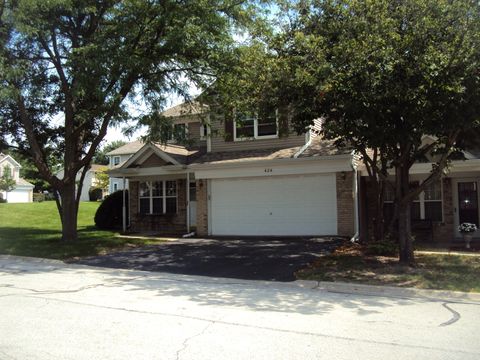
305 Plumtree Ct, Bolingbrook, IL 60440
$-334
Cash flow
-6.0%
Cash-on-Cash Return
4.3%
Cap rate
0.9%
Rent to Value Ratio
Active
$549,999
4
bds
|
3
ba
|
3,073
sqft
|
built
2005
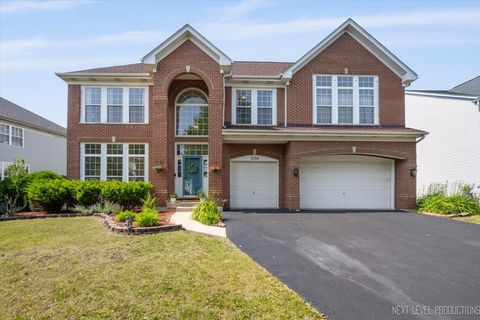
1314 Danhof Dr, Bolingbrook, IL 60490
$-1,273
Cash flow
-12.1%
Cash-on-Cash Return
2.9%
Cap rate
0.6%
Rent to Value Ratio
Active
$504,900
4
bds
|
3
ba
|
2,889
sqft
|
built
2004
304 Claridge Cir, Bolingbrook, IL 60440
$-1,256
Cash flow
-13.0%
Cash-on-Cash Return
2.7%
Cap rate
0.7%
Rent to Value Ratio
Active
$519,000
5
bds
|
3
ba
|
2,970
sqft
|
built
1991
6 Alleghany Ct, Bolingbrook, IL 60440
$-1,174
Cash flow
-11.8%
Cash-on-Cash Return
3.0%
Cap rate
0.7%
Rent to Value Ratio
Active
$499,000
3
bds
|
3
ba
|
1,782
sqft
|
built
1996
1873 Baldwin Way, Bolingbrook, IL 60490
$-1,047
Cash flow
-10.9%
Cash-on-Cash Return
3.2%
Cap rate
0.6%
Rent to Value Ratio
Active
$319,900
3
bds
|
2
ba
|
1,609
sqft
|
built
1978
235 Capitol Dr, Bolingbrook, IL 60440
$-230
Cash flow
-3.8%
Cash-on-Cash Return
4.8%
Cap rate
0.9%
Rent to Value Ratio
Active
$205,000
3
bds
|
1
ba
|
950
sqft
|
built
1974
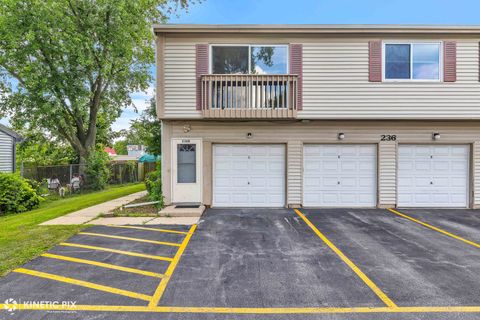
236 Algonquin Ct, Bolingbrook, IL 60440
$13
Cash flow
0.3%
Cash-on-Cash Return
5.8%
Cap rate
1.1%
Rent to Value Ratio
Active
$399,900
4
bds
|
3
ba
|
2,417
sqft
|
built
1987
162 N Canyon Dr, Bolingbrook, IL 60490
$-513
Cash flow
-6.7%
Cash-on-Cash Return
4.1%
Cap rate
0.8%
Rent to Value Ratio
Active
$371,900
3
bds
|
2
ba
|
1,755
sqft
|
built
1972
316 Bedford Rd, Bolingbrook, IL 60440
$-360
Cash flow
-5.1%
Cash-on-Cash Return
4.5%
Cap rate
0.8%
Rent to Value Ratio
Active
$334,500
3
bds
|
2
ba
|
1,435
sqft
|
built
1962
564 White Oak Rd, Bolingbrook, IL 60440
$-592
Cash flow
-9.2%
Cash-on-Cash Return
3.6%
Cap rate
0.7%
Rent to Value Ratio
Active
$419,900
4
bds
|
2
ba
|
1,902
sqft
|
built
1989
166 N Canyon Dr, Bolingbrook, IL 60490
$-556
Cash flow
-6.9%
Cash-on-Cash Return
4.1%
Cap rate
0.7%
Rent to Value Ratio