Boynton Beach, FL Investment Properties for Sale
Browse homes for sale and investment properties in Boynton Beach, FL. Refine your search by price, property type, or more.
Best cash flowing properties in Boynton Beach, FL
Active
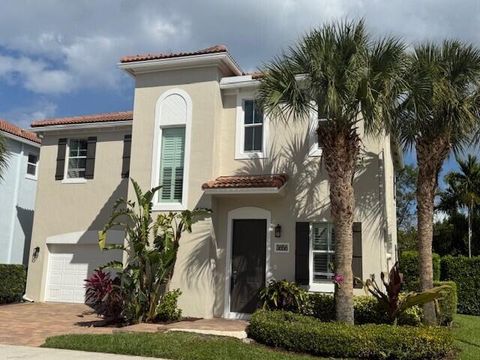
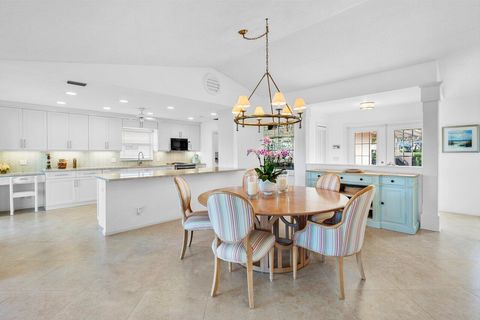
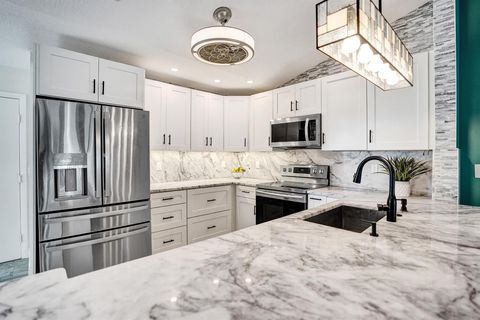
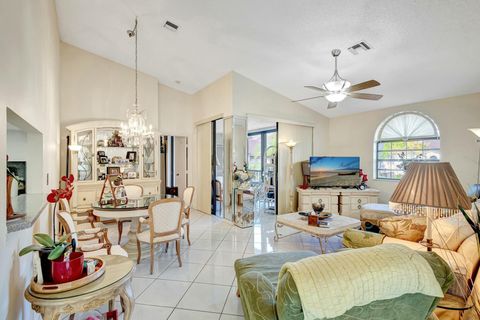
$995,000
4
bds
|
3
ba
|
2,624
sqft
|
built
1969
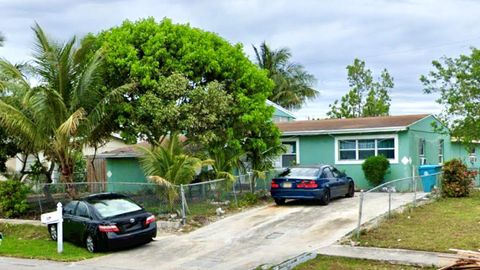
3030 Churchill Dr, Boynton Beach, FL 33435
$159
Cash flow
0.8%
Cash-on-Cash Return
6.5%
Cap rate
0.8%
Rent to Value Ratio

Active
$179,777
3
bds
|
2
ba
|
1,736
sqft
|
built
1997
8018 Aberdeen Dr, Boynton Beach, FL 33472
$144
Cash flow
4.2%
Cash-on-Cash Return
7.2%
Cap rate
1.7%
Rent to Value Ratio
601 out of 694 properties for sale in Boynton Beach, FL
Limited Results Shown
Create a free account, or log in to reveal all property listings and enjoy the complete experience.
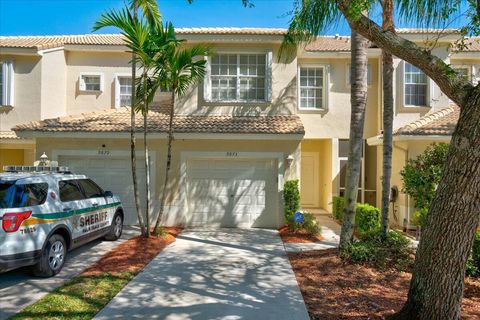
Active
$590,000
3
bds
|
3
ba
|
2,226
sqft
|
built
1984
2502 SW 23rd Cranbrook Dr, Boynton Beach, FL 33436
$-1,398
Cash flow
-12.4%
Cash-on-Cash Return
3.4%
Cap rate
0.6%
Rent to Value Ratio
Active
$179,777
3
bds
|
2
ba
|
1,736
sqft
|
built
1997
8018 Aberdeen Dr, Boynton Beach, FL 33472
$144
Cash flow
4.2%
Cash-on-Cash Return
7.2%
Cap rate
1.7%
Rent to Value Ratio
Active
$320,000
1
bds
|
1
ba
|
840
sqft
|
built
2010
450 N Federal Hwy, Boynton Beach, FL 33435
$-1,102
Cash flow
-18.0%
Cash-on-Cash Return
2.1%
Cap rate
0.7%
Rent to Value Ratio
Active
$389,900
3
bds
|
2
ba
|
1,340
sqft
|
built
1986
1452 SW 26th Ave, Boynton Beach, FL 33426
$-970
Cash flow
-13.0%
Cash-on-Cash Return
3.3%
Cap rate
0.6%
Rent to Value Ratio
Active
$699,000
4
bds
|
4
ba
|
2,558
sqft
|
built
2007
3143 Waterside Cir, Boynton Beach, FL 33435
$-2,368
Cash flow
-17.7%
Cash-on-Cash Return
2.2%
Cap rate
0.6%
Rent to Value Ratio
Active
$789,000
4
bds
|
3
ba
|
2,393
sqft
|
built
1992
5 Aspen Ct, Boynton Beach, FL 33436
$-2,268
Cash flow
-15.0%
Cash-on-Cash Return
2.8%
Cap rate
0.5%
Rent to Value Ratio
Active
$1,799,000
3
bds
|
3
ba
|
2,811
sqft
|
built
1970
11976 N Lake Dr, Boynton Beach, FL 33436
$-4,893
Cash flow
-14.2%
Cash-on-Cash Return
3.0%
Cap rate
0.5%
Rent to Value Ratio
Active
$1,149,000
3
bds
|
2
ba
|
2,500
sqft
|
built
1972
4866 S Lake Dr, Boynton Beach, FL 33436
$-2,191
Cash flow
-9.9%
Cash-on-Cash Return
4.0%
Cap rate
0.7%
Rent to Value Ratio
Active
$415,000
3
bds
|
3
ba
|
1,570
sqft
|
built
2002
9873 Lago Dr, Boynton Beach, FL 33472
$-1,024
Cash flow
-12.9%
Cash-on-Cash Return
3.3%
Cap rate
0.7%
Rent to Value Ratio
Active
$364,000
2
bds
|
3
ba
|
1,960
sqft
|
built
1980
624 NE 20th Ln, Boynton Beach, FL 33435
$-1,187
Cash flow
-17.0%
Cash-on-Cash Return
2.4%
Cap rate
0.9%
Rent to Value Ratio
Active
$485,000
3
bds
|
2
ba
|
1,310
sqft
|
built
1992
6888 Beacon Hollow Turn, Boynton Beach, FL 33437
$-864
Cash flow
-9.3%
Cash-on-Cash Return
4.1%
Cap rate
0.7%
Rent to Value Ratio
Active
$267,500
2
bds
|
2
ba
|
1,139
sqft
|
built
1989
5415 Verona Dr, Boynton Beach, FL 33437
$-906
Cash flow
-17.7%
Cash-on-Cash Return
2.2%
Cap rate
0.9%
Rent to Value Ratio
Active
$725,000
3
bds
|
3
ba
|
2,094
sqft
|
built
2013
3656 Whispering Cypress Ln, Boynton Beach, FL 33435
$-2,420
Cash flow
-17.4%
Cash-on-Cash Return
2.3%
Cap rate
0.5%
Rent to Value Ratio
Active
$1,299,000
3
bds
|
2
ba
|
2,314
sqft
|
built
1980
10551 Coralberry Way, Boynton Beach, FL 33436
$-6,211
Cash flow
-24.9%
Cash-on-Cash Return
0.5%
Cap rate
0.3%
Rent to Value Ratio
Active
$288,000
3
bds
|
2
ba
|
1,673
sqft
|
built
1988
8062 Cassia Dr, Boynton Beach, FL 33472
$-236
Cash flow
-4.3%
Cash-on-Cash Return
5.3%
Cap rate
1.1%
Rent to Value Ratio
Active
$234,900
2
bds
|
2
ba
|
1,139
sqft
|
built
1990
5450 Verona Dr, Boynton Beach, FL 33437
$-703
Cash flow
-15.6%
Cash-on-Cash Return
2.7%
Cap rate
1.0%
Rent to Value Ratio
Active
$239,000
2
bds
|
2
ba
|
1,250
sqft
|
built
1976
2424 N Federal Hwy, Boynton Beach, FL 33435
$-1,018
Cash flow
-22.2%
Cash-on-Cash Return
1.2%
Cap rate
1.1%
Rent to Value Ratio
Active
$2,050,000
4
bds
|
4
ba
|
3,465
sqft
|
built
2023
10925 Glen Orchard Ln, Boynton Beach, FL 33473
$-7,429
Cash flow
-18.9%
Cash-on-Cash Return
1.9%
Cap rate
0.4%
Rent to Value Ratio
Active
$995,000
4
bds
|
3
ba
|
2,624
sqft
|
built
1969
3030 Churchill Dr, Boynton Beach, FL 33435
$159
Cash flow
0.8%
Cash-on-Cash Return
6.5%
Cap rate
0.8%
Rent to Value Ratio
Active
$415,000
3
bds
|
2
ba
|
1,190
sqft
|
built
1985
5151 Brian Blvd, Boynton Beach, FL 33472
$-813
Cash flow
-10.2%
Cash-on-Cash Return
3.9%
Cap rate
0.7%
Rent to Value Ratio
Active
$399,000
3
bds
|
2
ba
|
1,846
sqft
|
built
1991
5454 Firenze Dr, Boynton Beach, FL 33437
$-1,121
Cash flow
-14.7%
Cash-on-Cash Return
2.9%
Cap rate
0.8%
Rent to Value Ratio
Active
$565,000
3
bds
|
3
ba
|
2,209
sqft
|
built
2006
4 Nottingham Pl, Boynton Beach, FL 33426
$-1,188
Cash flow
-11.0%
Cash-on-Cash Return
3.7%
Cap rate
0.7%
Rent to Value Ratio
Active
$929,000
3
bds
|
2
ba
|
2,630
sqft
|
built
1995
11582 Dunes Rd, Boynton Beach, FL 33436
$-2,502
Cash flow
-14.1%
Cash-on-Cash Return
3.0%
Cap rate
0.5%
Rent to Value Ratio
Active
$249,900
2
bds
|
2
ba
|
1,308
sqft
|
built
1976
2424 N Federal Hwy, Boynton Beach, FL 33435
$-887
Cash flow
-18.5%
Cash-on-Cash Return
2.0%
Cap rate
1.2%
Rent to Value Ratio
Active
$5,495,000
6
bds
|
7
ba
|
5,665
sqft
|
built
1977
26 Country Rd, Boynton Beach, FL 33436
$-27,845
Cash flow
-26.4%
Cash-on-Cash Return
0.2%
Cap rate
0.1%
Rent to Value Ratio
Active
$430,000
3
bds
|
3
ba
|
2,285
sqft
|
built
1989
6 Clubhouse Ln, Boynton Beach, FL 33436
$-2,712
Cash flow
-32.9%
Cash-on-Cash Return
-1.3%
Cap rate
0.7%
Rent to Value Ratio
Active
$379,000
3
bds
|
2
ba
|
1,188
sqft
|
built
1986
9912 Watermill Cir, Boynton Beach, FL 33437
$-770
Cash flow
-10.6%
Cash-on-Cash Return
3.8%
Cap rate
0.7%
Rent to Value Ratio

Active
$600,000
4
bds
|
0
ba
|
1,831
sqft
|
built
1958
431 SW 1st Ave, Boynton Beach, FL 33435
$-2,320
Cash flow
-20.2%
Cash-on-Cash Return
1.6%
Cap rate
0.4%
Rent to Value Ratio
Active
$585,000
3
bds
|
2
ba
|
1,825
sqft
|
built
1997
8134 Palm Gate Dr, Boynton Beach, FL 33436
$-1,215
Cash flow
-10.8%
Cash-on-Cash Return
3.8%
Cap rate
0.7%
Rent to Value Ratio

Active
$2,999,999
5
bds
|
3
ba
|
3,133
sqft
|
built
1979
11955 N Lake Dr, Boynton Beach, FL 33436
$-10,634
Cash flow
-18.5%
Cash-on-Cash Return
2.0%
Cap rate
0.3%
Rent to Value Ratio

Active
$2,290,000
6
bds
|
8
ba
|
6,467
sqft
|
built
2009
9525 Captiva Cir, Boynton Beach, FL 33437
$-7,748
Cash flow
-17.7%
Cash-on-Cash Return
2.2%
Cap rate
0.4%
Rent to Value Ratio
Active
$260,000
2
bds
|
2
ba
|
1,008
sqft
|
built
1981
9930 Pineapple Tree Dr, Boynton Beach, FL 33436
$-655
Cash flow
-13.1%
Cash-on-Cash Return
3.2%
Cap rate
0.8%
Rent to Value Ratio
Active
$279,000
2
bds
|
2
ba
|
1,240
sqft
|
built
2007
1690 Renaissance Commons Blvd, Boynton Beach, FL 33426
$-889
Cash flow
-16.6%
Cash-on-Cash Return
2.4%
Cap rate
0.9%
Rent to Value Ratio
Active
$1,200,000
6
bds
|
4
ba
|
4,051
sqft
|
built
2006
9709 Cobblestone Creek Dr, Boynton Beach, FL 33472
$-2,221
Cash flow
-9.7%
Cash-on-Cash Return
4.0%
Cap rate
0.7%
Rent to Value Ratio
Active
$665,000
4
bds
|
4
ba
|
2,090
sqft
|
built
1927
331 NW 1st Ave, Boynton Beach, FL 33435
$-2,043
Cash flow
-16.0%
Cash-on-Cash Return
2.6%
Cap rate
0.5%
Rent to Value Ratio
Active
$525,000
3
bds
|
3
ba
|
2,035
sqft
|
built
2004
105 Harbors Way, Boynton Beach, FL 33435
$-1,460
Cash flow
-14.5%
Cash-on-Cash Return
2.9%
Cap rate
0.7%
Rent to Value Ratio
Active
$380,000
3
bds
|
1
ba
|
1,569
sqft
|
built
1957
111 Ocean Pkwy, Boynton Beach, FL 33435
$-561
Cash flow
-7.7%
Cash-on-Cash Return
4.5%
Cap rate
0.7%
Rent to Value Ratio
Active
$4,899,900
3
bds
|
3
ba
|
2,234
sqft
|
built
1958
655 Castilla Ln, Boynton Beach, FL 33435
$-21,529
Cash flow
-22.9%
Cash-on-Cash Return
1.0%
Cap rate
0.2%
Rent to Value Ratio
Active
$3,049,000
3
bds
|
3
ba
|
2,445
sqft
|
built
2019
940 Greenbriar Dr, Boynton Beach, FL 33435
$-10,985
Cash flow
-18.8%
Cash-on-Cash Return
1.9%
Cap rate
0.3%
Rent to Value Ratio
Active
$1,075,000
2
bds
|
3
ba
|
1,566
sqft
|
built
1991
720 Mariners Way, Boynton Beach, FL 33435
$-2,998
Cash flow
-14.6%
Cash-on-Cash Return
2.9%
Cap rate
0.6%
Rent to Value Ratio