Boynton Beach, FL Investment Properties for Sale
Browse homes for sale and investment properties in Boynton Beach, FL. Refine your search by price, property type, or more.
Best cash flowing properties in Boynton Beach, FL
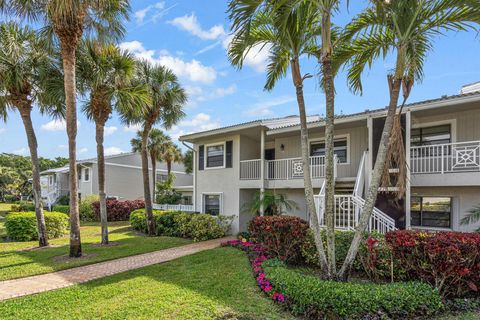
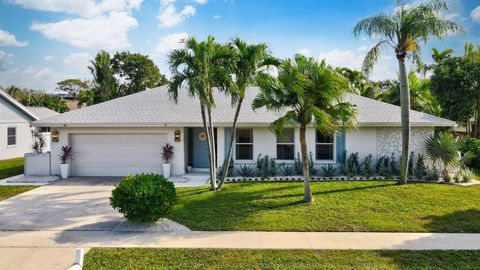
Active under contract
$199,900
3
bds
|
2
ba
|
1,855
sqft
|
built
1994
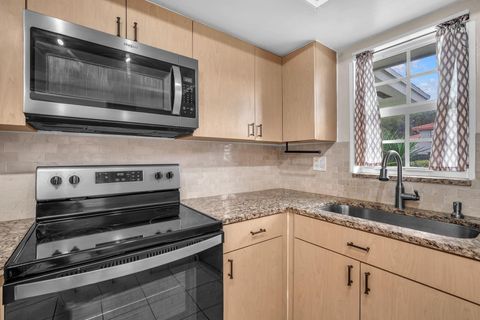
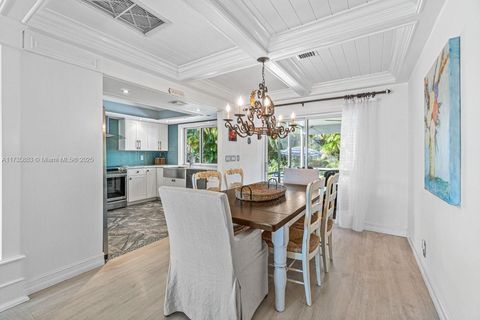
8808 Shoal Creek Ln, Boynton Beach, FL 33472
$721
Cash flow
18.8%
Cash-on-Cash Return
10.6%
Cap rate
1.8%
Rent to Value Ratio
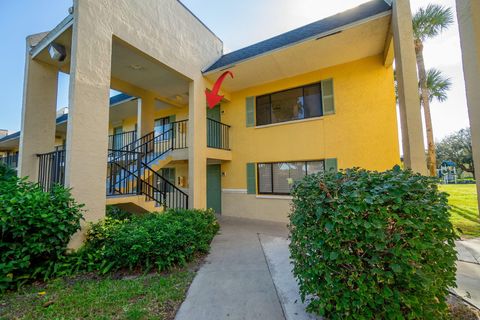
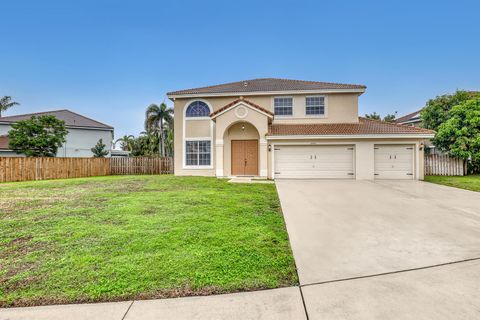
Active
$149,900
3
bds
|
2
ba
|
1,598
sqft
|
built
1995
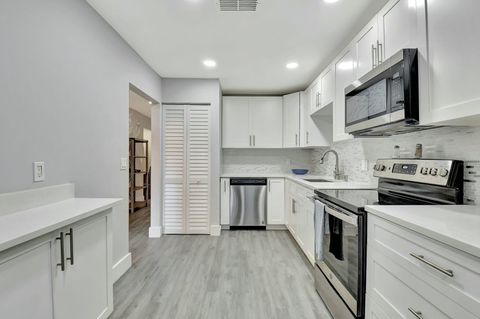
7832 Rockford Rd, Boynton Beach, FL 33472
$-10
Cash flow
-0.3%
Cash-on-Cash Return
6.2%
Cap rate
1.7%
Rent to Value Ratio
601 out of 694 properties for sale in Boynton Beach, FL
Limited Results Shown
Create a free account, or log in to reveal all property listings and enjoy the complete experience.
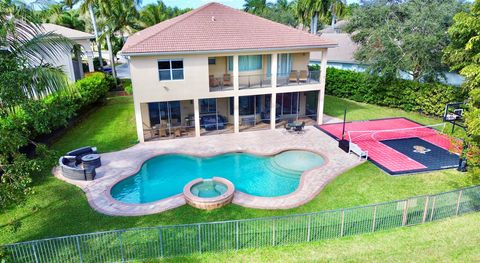
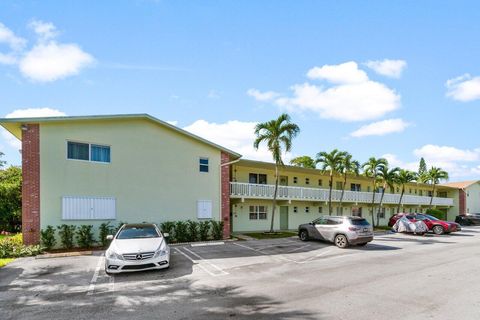
Active
$549,900
3
bds
|
2
ba
|
2,187
sqft
|
built
1992
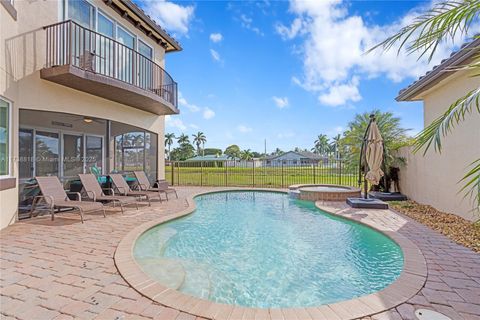
7946 Sailing Shores Ter, Boynton Beach, FL 33437
$-985
Cash flow
-9.3%
Cash-on-Cash Return
4.1%
Cap rate
0.8%
Rent to Value Ratio
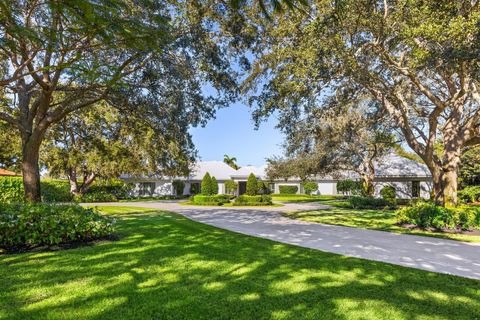
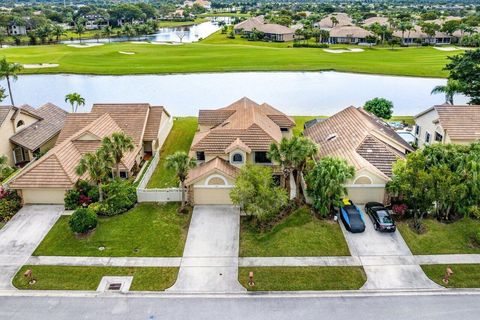
Active
$245,000
3
bds
|
2
ba
|
1,282
sqft
|
built
1992
5267 Europa Dr, Boynton Beach, FL 33437
$-352
Cash flow
-7.5%
Cash-on-Cash Return
4.5%
Cap rate
1.1%
Rent to Value Ratio
Active
$735,000
2
bds
|
3
ba
|
1,700
sqft
|
built
1987
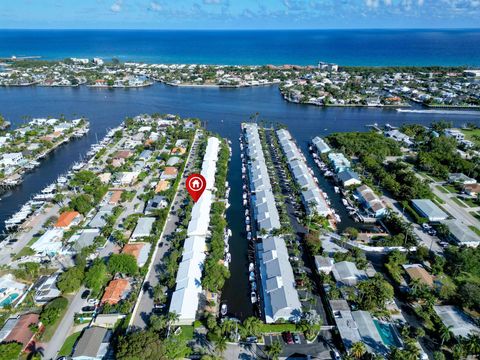
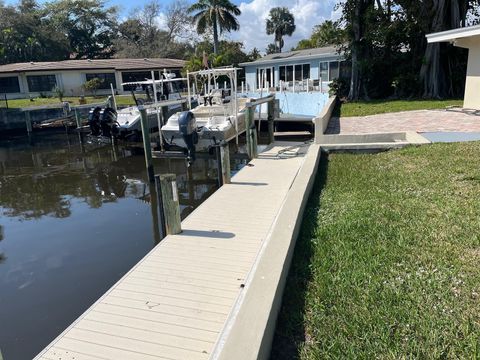
662 Mariners Way, Boynton Beach, FL 33435
$-2,315
Cash flow
-16.4%
Cash-on-Cash Return
2.5%
Cap rate
0.6%
Rent to Value Ratio
Active
$274,900
1
bds
|
1
ba
|
820
sqft
|
built
2010
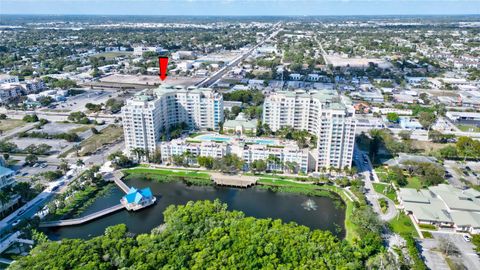
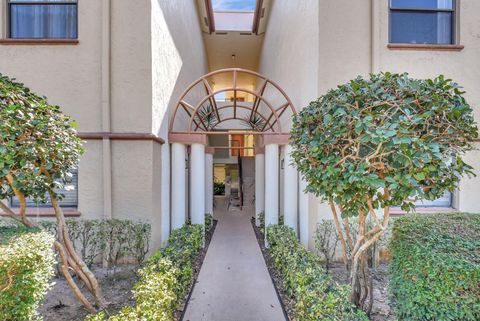
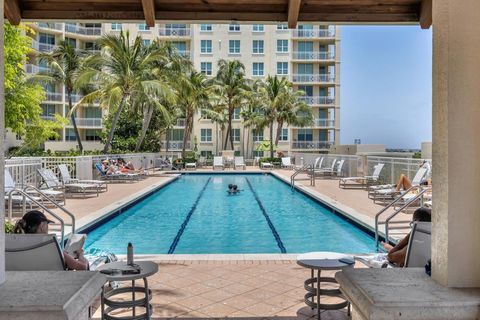
350 N Federal Hwy, Boynton Beach, FL 33435
$-927
Cash flow
-17.6%
Cash-on-Cash Return
2.2%
Cap rate
0.8%
Rent to Value Ratio

Active
$490,000
2
bds
|
2
ba
|
1,385
sqft
|
built
2010
350 N Federal Hwy, Boynton Beach, FL 33435
$-1,895
Cash flow
-20.2%
Cash-on-Cash Return
1.6%
Cap rate
0.7%
Rent to Value Ratio
Active
$1,050,000
3
bds
|
2
ba
|
1,646
sqft
|
built
2006
625 Casa Loma Blvd, Boynton Beach, FL 33435
$-2,877
Cash flow
-14.3%
Cash-on-Cash Return
3.0%
Cap rate
0.7%
Rent to Value Ratio
Active
$877,000
3
bds
|
3
ba
|
2,159
sqft
|
built
2022
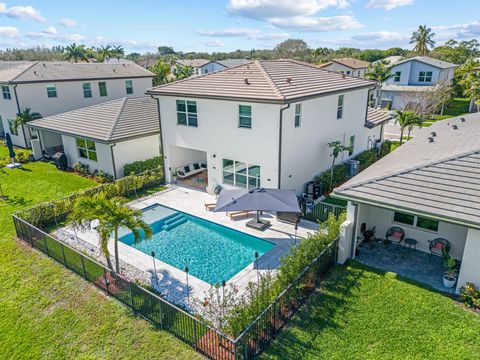
2724 Country Lake Trl, Boynton Beach, FL 33436
$-1,298
Cash flow
-7.7%
Cash-on-Cash Return
4.5%
Cap rate
0.7%
Rent to Value Ratio
Active
$282,000
3
bds
|
2
ba
|
1,333
sqft
|
built
1993
5147 Europa Dr, Boynton Beach, FL 33437
$-578
Cash flow
-10.7%
Cash-on-Cash Return
3.8%
Cap rate
1.0%
Rent to Value Ratio

Active
$3,900,000
5
bds
|
7
ba
|
4,879
sqft
|
built
2022
636 Windward Cir S, Boynton Beach, FL 33435
$-18,369
Cash flow
-24.6%
Cash-on-Cash Return
0.6%
Cap rate
0.3%
Rent to Value Ratio
Active under contract
$252,500
1
bds
|
1
ba
|
838
sqft
|
built
2010
350 N Federal Hwy, Boynton Beach, FL 33435
$-683
Cash flow
-14.1%
Cash-on-Cash Return
3.0%
Cap rate
1.0%
Rent to Value Ratio
Active
$259,000
2
bds
|
2
ba
|
1,008
sqft
|
built
1981
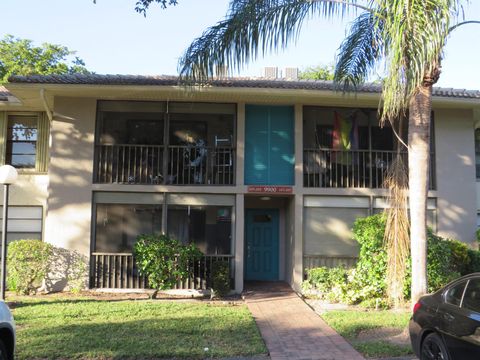
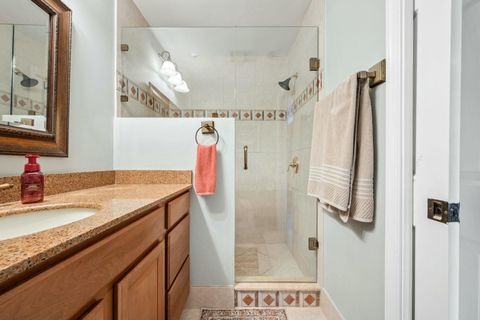
9900 Pineapple Tree Dr, Boynton Beach, FL 33436
$-707
Cash flow
-14.2%
Cash-on-Cash Return
3.0%
Cap rate
0.8%
Rent to Value Ratio
Active
$255,000
2
bds
|
2
ba
|
1,300
sqft
|
built
1989
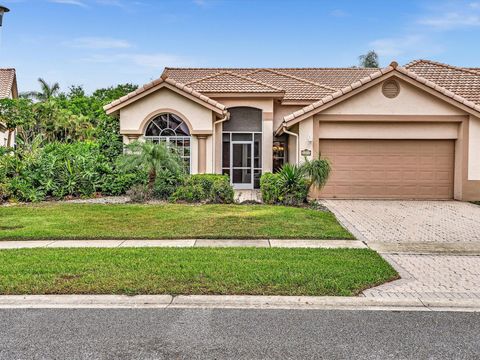
8057 Aberdeen Dr, Boynton Beach, FL 33472
$-410
Cash flow
-8.4%
Cash-on-Cash Return
4.3%
Cap rate
1.1%
Rent to Value Ratio
Active
$819,000
2
bds
|
3
ba
|
1,632
sqft
|
built
1980
732 NE 12th Ter, Boynton Beach, FL 33435
$-1,991
Cash flow
-12.7%
Cash-on-Cash Return
3.3%
Cap rate
0.6%
Rent to Value Ratio

Active
$1,999,000
6
bds
|
8
ba
|
5,505
sqft
|
built
2007
9007 Stone Pier Dr, Boynton Beach, FL 33472
$-5,714
Cash flow
-14.9%
Cash-on-Cash Return
2.8%
Cap rate
0.5%
Rent to Value Ratio

Active
$1,299,000
6
bds
|
6
ba
|
4,511
sqft
|
built
2014
8187 Mariano Falls Ln, Boynton Beach, FL 33473
$-2,933
Cash flow
-11.8%
Cash-on-Cash Return
3.6%
Cap rate
0.6%
Rent to Value Ratio
Active
$769,000
4
bds
|
3
ba
|
2,515
sqft
|
built
2005
8877 Kettle Drum Ter, Boynton Beach, FL 33473
$-1,735
Cash flow
-11.8%
Cash-on-Cash Return
3.6%
Cap rate
0.7%
Rent to Value Ratio
Active
$540,000
3
bds
|
3
ba
|
1,843
sqft
|
built
2008
10184 White Water Lily Way, Boynton Beach, FL 33437
$-650
Cash flow
-6.3%
Cash-on-Cash Return
4.8%
Cap rate
0.7%
Rent to Value Ratio
Active
$1,699,900
5
bds
|
4
ba
|
3,949
sqft
|
built
2004
9105 Equus Cir, Boynton Beach, FL 33472
$-4,382
Cash flow
-13.4%
Cash-on-Cash Return
3.2%
Cap rate
0.5%
Rent to Value Ratio
Active
$294,000
2
bds
|
2
ba
|
1,091
sqft
|
built
1976
2520 SW 14th Ct, Boynton Beach, FL 33426
$-849
Cash flow
-15.1%
Cash-on-Cash Return
2.8%
Cap rate
0.7%
Rent to Value Ratio
Active
$149,900
3
bds
|
2
ba
|
1,598
sqft
|
built
1995
7832 Rockford Rd, Boynton Beach, FL 33472
$-10
Cash flow
-0.3%
Cash-on-Cash Return
6.2%
Cap rate
1.7%
Rent to Value Ratio
Active
$80,000
2
bds
|
2
ba
|
1,383
sqft
|
built
1980
31 Southport Ln, Boynton Beach, FL 33436
$-325
Cash flow
-21.2%
Cash-on-Cash Return
1.4%
Cap rate
3.3%
Rent to Value Ratio
Active
$210,000
2
bds
|
3
ba
|
1,386
sqft
|
built
1989
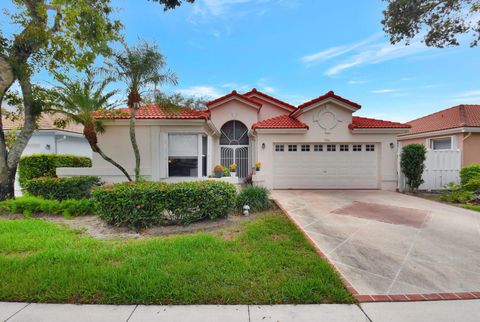
8041 Aberdeen Dr, Boynton Beach, FL 33472
$-252
Cash flow
-6.3%
Cash-on-Cash Return
4.8%
Cap rate
1.2%
Rent to Value Ratio
Active
$324,999
3
bds
|
2
ba
|
1,187
sqft
|
built
1988
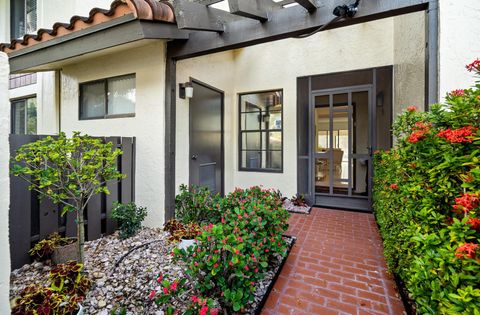
101 Via De Casas Norte, Boynton Beach, FL 33426
$-1,164
Cash flow
-18.7%
Cash-on-Cash Return
2.0%
Cap rate
0.9%
Rent to Value Ratio
Active
$1,390,000
3
bds
|
2
ba
|
1,690
sqft
|
built
1956
634 Ocean Inlet Dr, Boynton Beach, FL 33435
$-4,130
Cash flow
-15.5%
Cash-on-Cash Return
2.7%
Cap rate
0.5%
Rent to Value Ratio
Active
$1,152,000
5
bds
|
4
ba
|
3,504
sqft
|
built
2003
4102 Artesa Dr, Boynton Beach, FL 33436
$-553
Cash flow
-2.5%
Cash-on-Cash Return
5.7%
Cap rate
0.9%
Rent to Value Ratio
Active
$348,999
3
bds
|
2
ba
|
1,469
sqft
|
built
1988
10439 S Circle Lake Dr, Boynton Beach, FL 33437
$-685
Cash flow
-10.2%
Cash-on-Cash Return
3.9%
Cap rate
0.9%
Rent to Value Ratio
Active
$949,000
3
bds
|
2
ba
|
1,387
sqft
|
built
1971
3285 Churchill Dr, Boynton Beach, FL 33435
$-934
Cash flow
-5.1%
Cash-on-Cash Return
5.1%
Cap rate
0.7%
Rent to Value Ratio
Active
$385,000
2
bds
|
2
ba
|
980
sqft
|
built
1983
689 NE 6th Ct, Boynton Beach, FL 33435
$-1,470
Cash flow
-19.9%
Cash-on-Cash Return
1.7%
Cap rate
0.8%
Rent to Value Ratio
Active
$630,000
5
bds
|
4
ba
|
3,119
sqft
|
built
2006
1098 Grove Park Cir, Boynton Beach, FL 33436
$-1,234
Cash flow
-10.2%
Cash-on-Cash Return
3.9%
Cap rate
0.6%
Rent to Value Ratio
Active
$1,200,000
2
bds
|
2
ba
|
1,742
sqft
|
built
2012
2700 N Federal Hwy, Boynton Beach, FL 33435
$-3,442
Cash flow
-15.0%
Cash-on-Cash Return
2.8%
Cap rate
0.6%
Rent to Value Ratio
Active
$820,000
6
bds
|
4
ba
|
3,104
sqft
|
built
2009
7654 Jewelwood Dr, Boynton Beach, FL 33437
$-1,891
Cash flow
-12.0%
Cash-on-Cash Return
3.5%
Cap rate
0.6%
Rent to Value Ratio
Active
$239,000
3
bds
|
2
ba
|
1,809
sqft
|
built
1983
53 Eastgate Dr, Boynton Beach, FL 33436
$-957
Cash flow
-20.9%
Cash-on-Cash Return
1.5%
Cap rate
1.3%
Rent to Value Ratio
Active
$169,000
2
bds
|
2
ba
|
921
sqft
|
built
1986
720 Meadows Cir, Boynton Beach, FL 33436
$-168
Cash flow
-5.2%
Cash-on-Cash Return
5.1%
Cap rate
1.3%
Rent to Value Ratio
Active under contract
$1,495,000
6
bds
|
4
ba
|
4,272
sqft
|
built
2006
8844 Heartsong Ter, Boynton Beach, FL 33473
$-2,859
Cash flow
-10.0%
Cash-on-Cash Return
4.0%
Cap rate
0.6%
Rent to Value Ratio
Active
$8,995,000
5
bds
|
5
ba
|
5,012
sqft
|
built
1992
39 Country Rd S, Boynton Beach, FL 33436
$-47,075
Cash flow
-27.3%
Cash-on-Cash Return
0.0%
Cap rate
0.1%
Rent to Value Ratio
Active under contract
$199,900
3
bds
|
2
ba
|
1,855
sqft
|
built
1994
8808 Shoal Creek Ln, Boynton Beach, FL 33472
$721
Cash flow
18.8%
Cash-on-Cash Return
10.6%
Cap rate
1.8%
Rent to Value Ratio
Active
$1,084,000
3
bds
|
2
ba
|
1,722
sqft
|
built
1980
2512 SW 5th St, Boynton Beach, FL 33435
$-1,493
Cash flow
-7.2%
Cash-on-Cash Return
4.6%
Cap rate
0.7%
Rent to Value Ratio
Active
$849,000
4
bds
|
3
ba
|
2,882
sqft
|
built
1992
8982 Indian River Run, Boynton Beach, FL 33472
$-1,950
Cash flow
-12.0%
Cash-on-Cash Return
3.5%
Cap rate
0.6%
Rent to Value Ratio
Active
$240,000
1
bds
|
2
ba
|
774
sqft
|
built
1971
658 NE 6th Ct, Boynton Beach, FL 33435
$-791
Cash flow
-17.2%
Cash-on-Cash Return
2.3%
Cap rate
0.8%
Rent to Value Ratio
Active
$515,000
4
bds
|
3
ba
|
2,497
sqft
|
built
1988
6892 Bitterbush Pl, Boynton Beach, FL 33472
$-271
Cash flow
-2.7%
Cash-on-Cash Return
5.6%
Cap rate
1.0%
Rent to Value Ratio