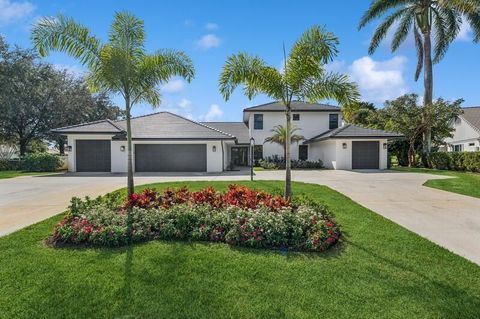
Boynton Beach, FL Investment Properties for Sale
Browse homes for sale and investment properties in Boynton Beach, FL. Refine your search by price, property type, or more.
Best cash flowing properties in Boynton Beach, FL
Closed
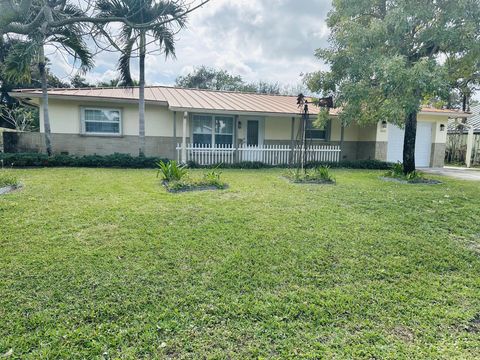
$185,000
3
bds
|
2
ba
|
1,447
sqft
|
built
1995
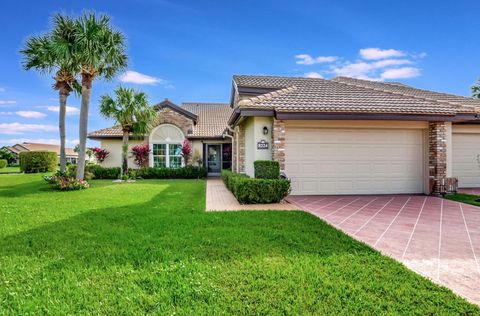
5153 Floria Dr, Boynton Beach, FL 33437
$445
Cash flow
12.5%
Cash-on-Cash Return
9.0%
Cap rate
1.5%
Rent to Value Ratio
Pending
$189,000
3
bds
|
2
ba
|
1,282
sqft
|
built
1991
5391 Verona Dr, Boynton Beach, FL 33437
$38
Cash flow
1.0%
Cash-on-Cash Return
6.4%
Cap rate
1.3%
Rent to Value Ratio
598 out of 690 properties for sale in Boynton Beach, FL
Limited Results Shown
Create a free account, or log in to reveal all property listings and enjoy the complete experience.
Active
$3,095,000
5
bds
|
5
ba
|
5,737
sqft
|
built
1988
10438 Prestwick Rd, Boynton Beach, FL 33436
$-10,107
Cash flow
-17.0%
Cash-on-Cash Return
2.2%
Cap rate
0.3%
Rent to Value Ratio
Active
$839,000
4
bds
|
4
ba
|
2,487
sqft
|
built
2019
3 Windward Ln, Boynton Beach, FL 33435
$-1,489
Cash flow
-9.3%
Cash-on-Cash Return
4.0%
Cap rate
0.8%
Rent to Value Ratio
Active
$125,000
3
bds
|
2
ba
|
1,778
sqft
|
built
1981
8 Westgate Ln, Boynton Beach, FL 33436
$-839
Cash flow
-35.0%
Cash-on-Cash Return
-1.9%
Cap rate
1.9%
Rent to Value Ratio
Active
$625,000
3
bds
|
4
ba
|
2,476
sqft
|
built
2007
3016 Waterside Cir, Boynton Beach, FL 33435
$-2,130
Cash flow
-17.8%
Cash-on-Cash Return
2.1%
Cap rate
0.7%
Rent to Value Ratio
Active
$520,000
3
bds
|
2
ba
|
1,633
sqft
|
built
1990
5095 Rosen Blvd, Boynton Beach, FL 33472
$-713
Cash flow
-7.2%
Cash-on-Cash Return
4.5%
Cap rate
0.7%
Rent to Value Ratio
Active
$278,000
3
bds
|
2
ba
|
1,096
sqft
|
built
1987
10 Via De Casas Sur, Boynton Beach, FL 33426
$-996
Cash flow
-18.7%
Cash-on-Cash Return
1.8%
Cap rate
0.9%
Rent to Value Ratio
Active
$550,000
3
bds
|
2
ba
|
1,564
sqft
|
built
1973
1043 Coral Dr, Boynton Beach, FL 33426
$-1,126
Cash flow
-10.7%
Cash-on-Cash Return
3.7%
Cap rate
0.6%
Rent to Value Ratio
Active
$495,000
3
bds
|
3
ba
|
3,158
sqft
|
built
1986
53 Northwoods Ln, Boynton Beach, FL 33436
$-1,984
Cash flow
-20.9%
Cash-on-Cash Return
1.3%
Cap rate
0.9%
Rent to Value Ratio
Active
$1,545,000
5
bds
|
6
ba
|
4,798
sqft
|
built
2007
8964 Stone Pier Dr, Boynton Beach, FL 33472
$-2,725
Cash flow
-9.2%
Cash-on-Cash Return
4.0%
Cap rate
0.6%
Rent to Value Ratio
Active
$900,000
5
bds
|
3
ba
|
3,731
sqft
|
built
2006
9917 Cobblestone Creek Dr, Boynton Beach, FL 33472
$-2,201
Cash flow
-12.8%
Cash-on-Cash Return
3.2%
Cap rate
0.6%
Rent to Value Ratio
Active
$745,000
2
bds
|
3
ba
|
1,566
sqft
|
built
1987
622 Mariners Way, Boynton Beach, FL 33435
$-1,755
Cash flow
-12.3%
Cash-on-Cash Return
3.3%
Cap rate
0.6%
Rent to Value Ratio
Active
$1,395,000
3
bds
|
2
ba
|
2,110
sqft
|
built
1956
112 SW 24th Ave, Boynton Beach, FL 33435
$-2,311
Cash flow
-8.6%
Cash-on-Cash Return
4.2%
Cap rate
0.5%
Rent to Value Ratio
Active
$179,600
2
bds
|
2
ba
|
864
sqft
|
built
1984
30 Crossings Cir, Boynton Beach, FL 33435
$-381
Cash flow
-11.1%
Cash-on-Cash Return
3.6%
Cap rate
1.1%
Rent to Value Ratio
Active
$439,000
3
bds
|
3
ba
|
1,842
sqft
|
built
2003
6421 Bella Cir, Boynton Beach, FL 33437
$-1,078
Cash flow
-12.8%
Cash-on-Cash Return
3.2%
Cap rate
0.8%
Rent to Value Ratio
Active
$2,799,000
5
bds
|
5
ba
|
4,700
sqft
|
built
1979
4721 Sabal Palm Dr, Boynton Beach, FL 33436
$-9,653
Cash flow
-18.0%
Cash-on-Cash Return
2.0%
Cap rate
0.4%
Rent to Value Ratio
Active
$395,000
3
bds
|
2
ba
|
1,636
sqft
|
built
2000
1809 Belmont Pl, Boynton Beach, FL 33436
$-1,014
Cash flow
-13.4%
Cash-on-Cash Return
3.1%
Cap rate
0.8%
Rent to Value Ratio
Active
$1,349,000
3
bds
|
2
ba
|
2,365
sqft
|
built
1972
11951 Date Palm Dr, Boynton Beach, FL 33436
$-2,213
Cash flow
-8.6%
Cash-on-Cash Return
4.2%
Cap rate
0.6%
Rent to Value Ratio
Pending
$439,000
2
bds
|
2
ba
|
1,185
sqft
|
built
2010
450 N Federal Hwy, Boynton Beach, FL 33435
$-1,869
Cash flow
-22.2%
Cash-on-Cash Return
1.0%
Cap rate
0.7%
Rent to Value Ratio
Active
$634,999
3
bds
|
3
ba
|
1,685
sqft
|
built
2010
350 N Federal Hwy, Boynton Beach, FL 33435
$-1,614
Cash flow
-13.3%
Cash-on-Cash Return
3.1%
Cap rate
0.9%
Rent to Value Ratio
Active
$539,000
2
bds
|
2
ba
|
899
sqft
|
built
1978
689 NE 6th Ct, Boynton Beach, FL 33435
$-1,991
Cash flow
-19.3%
Cash-on-Cash Return
1.7%
Cap rate
0.6%
Rent to Value Ratio
Active
$579,000
3
bds
|
2
ba
|
1,880
sqft
|
built
1976
3546 Pandora Ave, Boynton Beach, FL 33436
$-539
Cash flow
-4.9%
Cash-on-Cash Return
5.0%
Cap rate
0.7%
Rent to Value Ratio
Active
$170,000
2
bds
|
1
ba
|
751
sqft
|
built
1971
640 NE 6th Ct, Boynton Beach, FL 33435
$-305
Cash flow
-9.4%
Cash-on-Cash Return
4.0%
Cap rate
1.1%
Rent to Value Ratio

Active
$155,000
1
bds
|
1
ba
|
614
sqft
|
built
1978
2309 S Federal Hwy, Boynton Beach, FL 33435
$-322
Cash flow
-10.8%
Cash-on-Cash Return
3.7%
Cap rate
1.0%
Rent to Value Ratio
Active
$449,000
2
bds
|
2
ba
|
1,129
sqft
|
built
2006
625 Casa Loma Blvd, Boynton Beach, FL 33435
$-1,811
Cash flow
-21.0%
Cash-on-Cash Return
1.3%
Cap rate
0.7%
Rent to Value Ratio
Active
$514,500
3
bds
|
2
ba
|
1,958
sqft
|
built
1979
3668 Quail Ridge Dr N, Boynton Beach, FL 33436
$-1,448
Cash flow
-14.7%
Cash-on-Cash Return
2.8%
Cap rate
0.8%
Rent to Value Ratio
Active
$529,900
2
bds
|
2
ba
|
2,415
sqft
|
built
1999
6715 Chimere Ter, Boynton Beach, FL 33437
$-751
Cash flow
-7.4%
Cash-on-Cash Return
4.4%
Cap rate
0.8%
Rent to Value Ratio
Active
$199,000
2
bds
|
2
ba
|
1,054
sqft
|
built
1989
8049 Aberdeen Dr, Boynton Beach, FL 33472
$-453
Cash flow
-11.9%
Cash-on-Cash Return
3.4%
Cap rate
1.1%
Rent to Value Ratio
Active
$258,500
2
bds
|
2
ba
|
1,676
sqft
|
built
1988
8224 Cassia Dr, Boynton Beach, FL 33472
$-22
Cash flow
-0.4%
Cash-on-Cash Return
6.0%
Cap rate
1.2%
Rent to Value Ratio
Active
$570,000
3
bds
|
2
ba
|
1,375
sqft
|
built
2000
109 SE 31st Ave, Boynton Beach, FL 33435
$-1,110
Cash flow
-10.2%
Cash-on-Cash Return
3.8%
Cap rate
0.6%
Rent to Value Ratio
Pending
$189,000
3
bds
|
2
ba
|
1,282
sqft
|
built
1991
5391 Verona Dr, Boynton Beach, FL 33437
$38
Cash flow
1.0%
Cash-on-Cash Return
6.4%
Cap rate
1.3%
Rent to Value Ratio
Pending
$190,000
3
bds
|
2
ba
|
1,284
sqft
|
built
1974
616 SW 1st St, Boynton Beach, FL 33435
$-562
Cash flow
-15.4%
Cash-on-Cash Return
2.6%
Cap rate
1.1%
Rent to Value Ratio
Active
$125,000
2
bds
|
2
ba
|
960
sqft
|
built
1976
230 NE 26th Ave, Boynton Beach, FL 33435
$-71
Cash flow
-3.0%
Cash-on-Cash Return
5.5%
Cap rate
1.4%
Rent to Value Ratio
Active
$229,999
2
bds
|
2
ba
|
998
sqft
|
built
1985
88 Via De Casas Norte, Boynton Beach, FL 33426
$-453
Cash flow
-10.3%
Cash-on-Cash Return
3.8%
Cap rate
1.0%
Rent to Value Ratio
Active
$839,000
3
bds
|
4
ba
|
2,562
sqft
|
built
2008
824 Virginia Garden Dr, Boynton Beach, FL 33435
$-2,551
Cash flow
-15.9%
Cash-on-Cash Return
2.5%
Cap rate
0.6%
Rent to Value Ratio
Active
$699,000
3
bds
|
4
ba
|
2,314
sqft
|
built
1977
3484 Royal Tern Ln, Boynton Beach, FL 33436
$-2,247
Cash flow
-16.8%
Cash-on-Cash Return
2.3%
Cap rate
0.6%
Rent to Value Ratio
Active
$335,000
1
bds
|
1
ba
|
782
sqft
|
built
2006
700 E Boynton Beach Blvd, Boynton Beach, FL 33435
$-1,300
Cash flow
-20.2%
Cash-on-Cash Return
1.5%
Cap rate
0.7%
Rent to Value Ratio
Active
$278,000
3
bds
|
2
ba
|
1,332
sqft
|
built
1990
5406 Venetia Ct, Boynton Beach, FL 33437
$-551
Cash flow
-10.3%
Cash-on-Cash Return
3.8%
Cap rate
1.0%
Rent to Value Ratio
Closed
$185,000
3
bds
|
2
ba
|
1,447
sqft
|
built
1995
5153 Floria Dr, Boynton Beach, FL 33437
$445
Cash flow
12.5%
Cash-on-Cash Return
9.0%
Cap rate
1.5%
Rent to Value Ratio
Active
$139,900
1
bds
|
2
ba
|
646
sqft
|
built
1967
210 Horizons E, Boynton Beach, FL 33435
$-242
Cash flow
-9.0%
Cash-on-Cash Return
4.1%
Cap rate
1.3%
Rent to Value Ratio

Active
$3,500,000
5
bds
|
5
ba
|
4,861
sqft
|
built
2006
11150 Stonewood Forest Trl, Boynton Beach, FL 33473
$-12,939
Cash flow
-19.3%
Cash-on-Cash Return
1.7%
Cap rate
0.3%
Rent to Value Ratio