Boynton Beach, FL Investment Properties for Sale
Browse homes for sale and investment properties in Boynton Beach, FL. Refine your search by price, property type, or more.
Best cash flowing properties in Boynton Beach, FL
Active
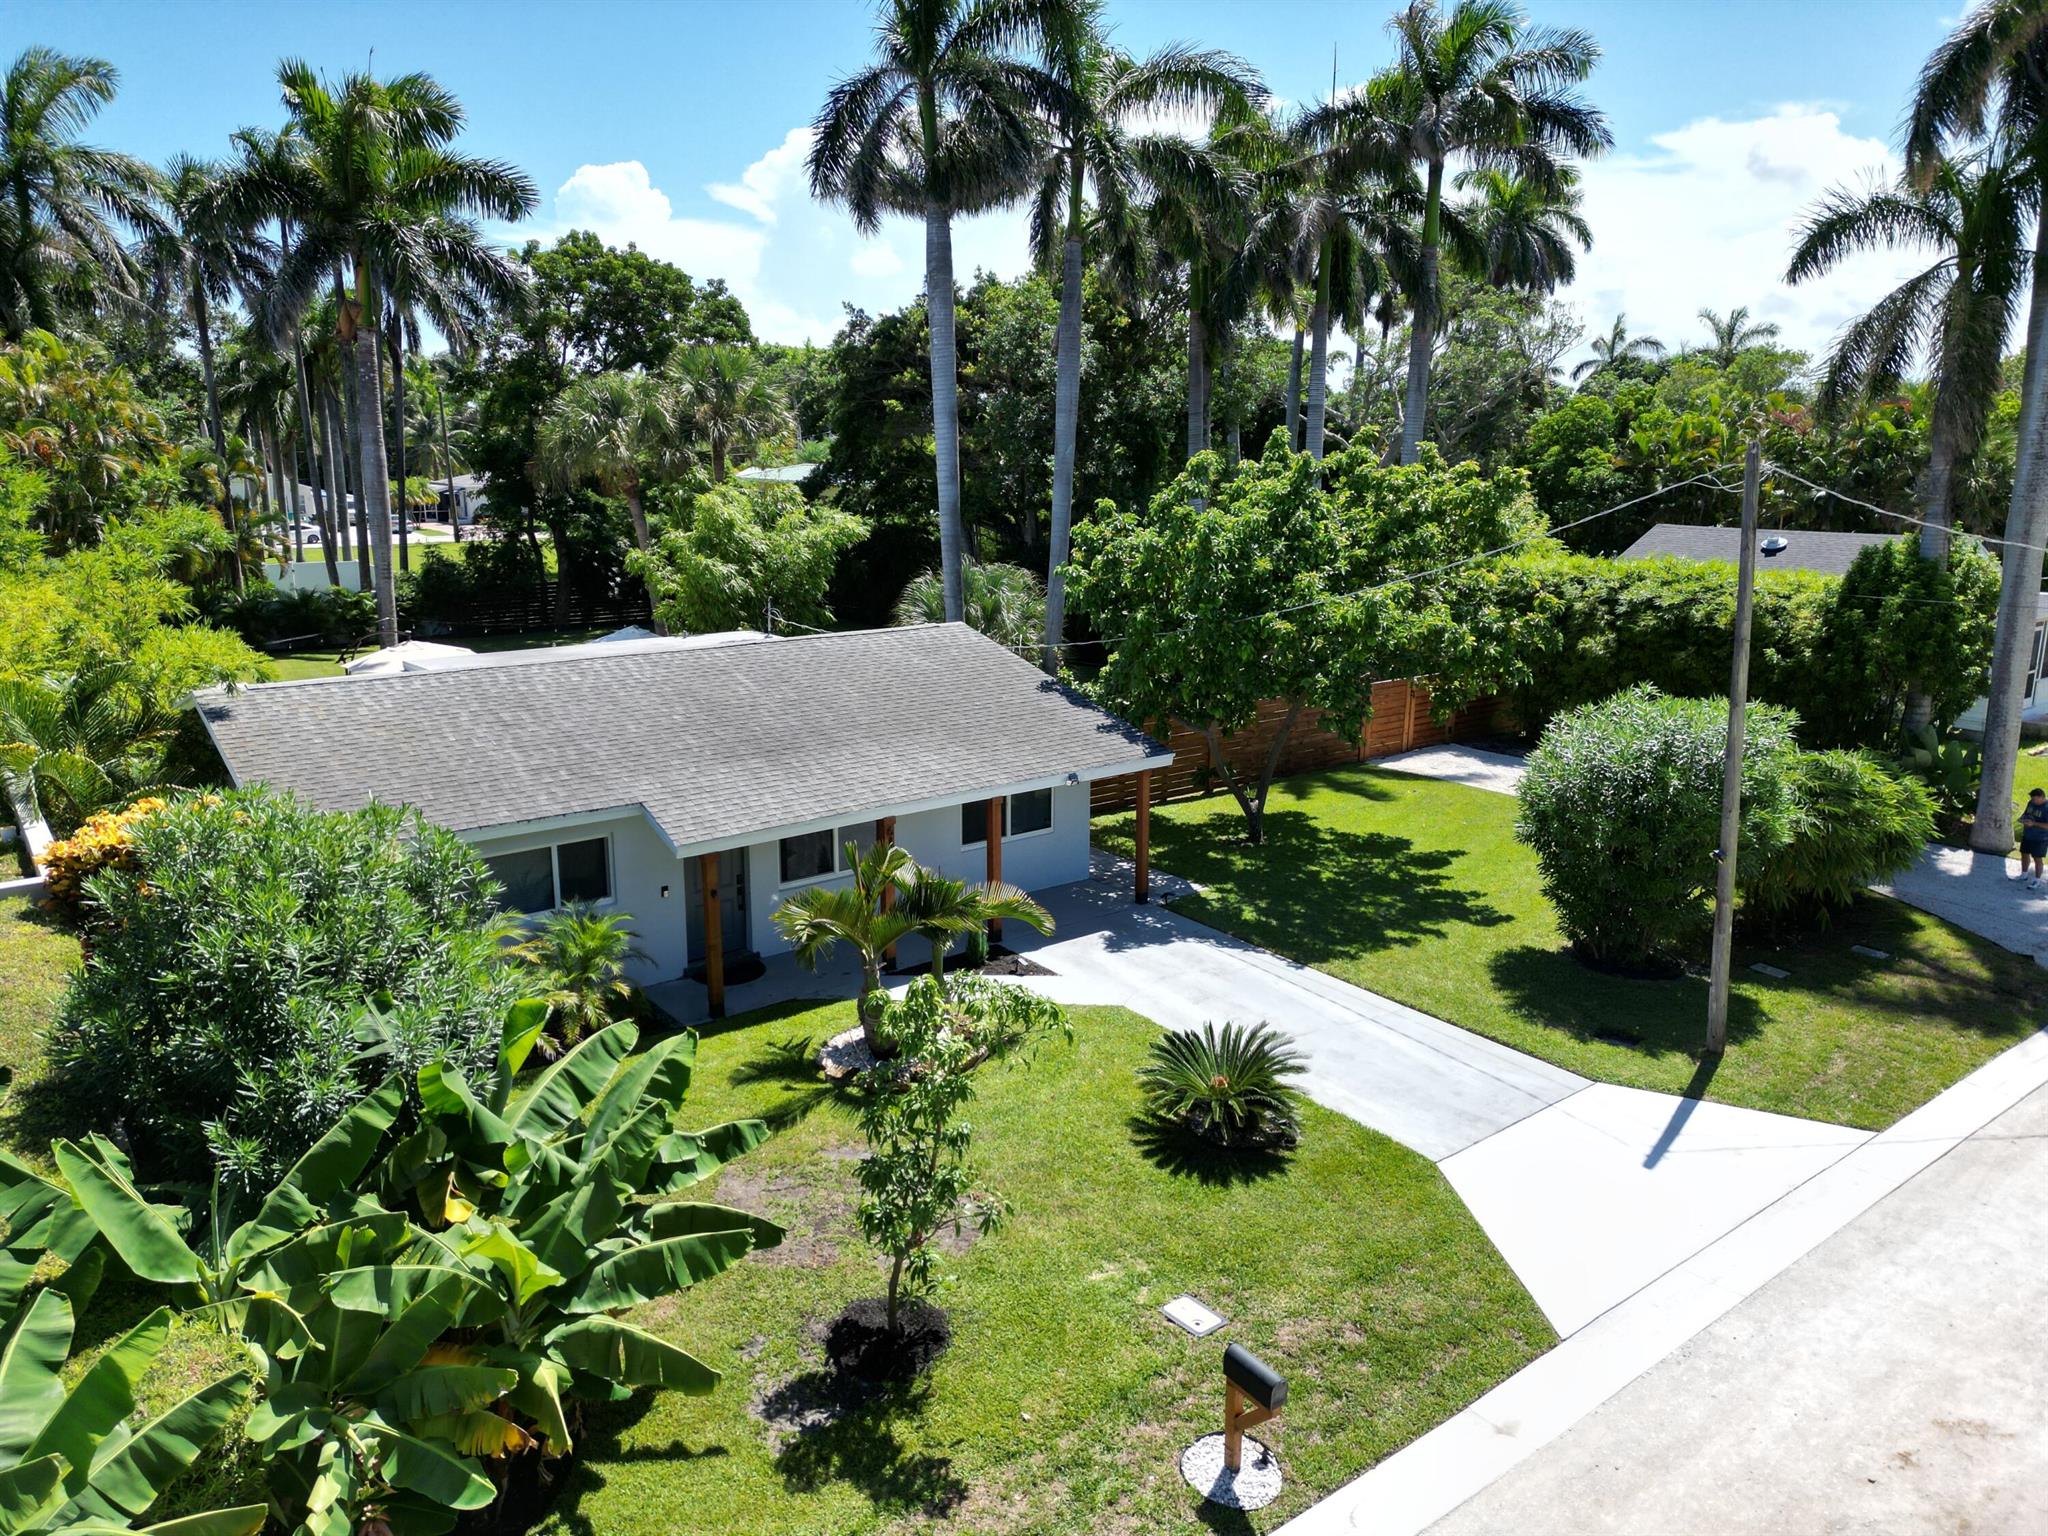
$650,000
3
bds
|
2
ba
|
1,328
sqft
|
built
1962
640 Dimick Rd, Boynton Beach, FL 33435
$326
Cash flow
2.6%
Cash-on-Cash Return
6.7%
Cap rate
1.0%
Rent to Value Ratio
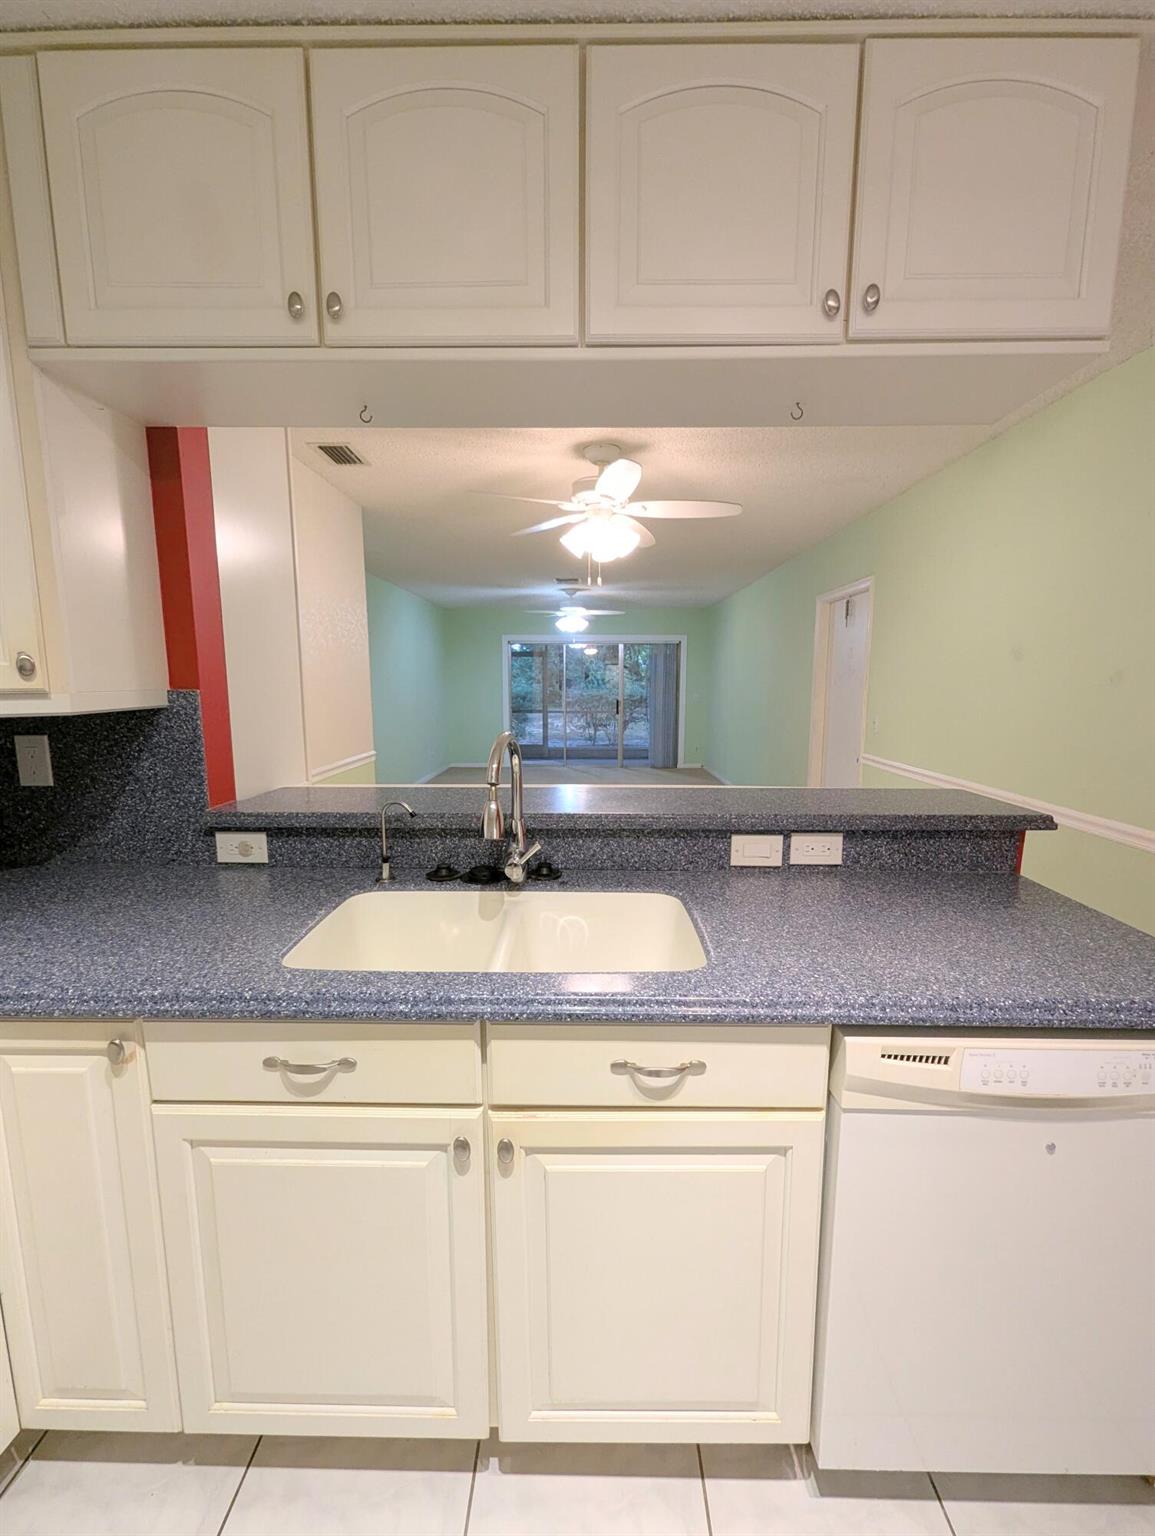
Active
$199,000
2
bds
|
2
ba
|
1,026
sqft
|
built
1975
1914 Palmland Dr, Boynton Beach, FL 33436
$-129
Cash flow
-3.4%
Cash-on-Cash Return
5.4%
Cap rate
1.1%
Rent to Value Ratio
611 out of 705 properties for sale in Boynton Beach, FL
Limited Results Shown
Create a free account, or log in to reveal all property listings and enjoy the complete experience.
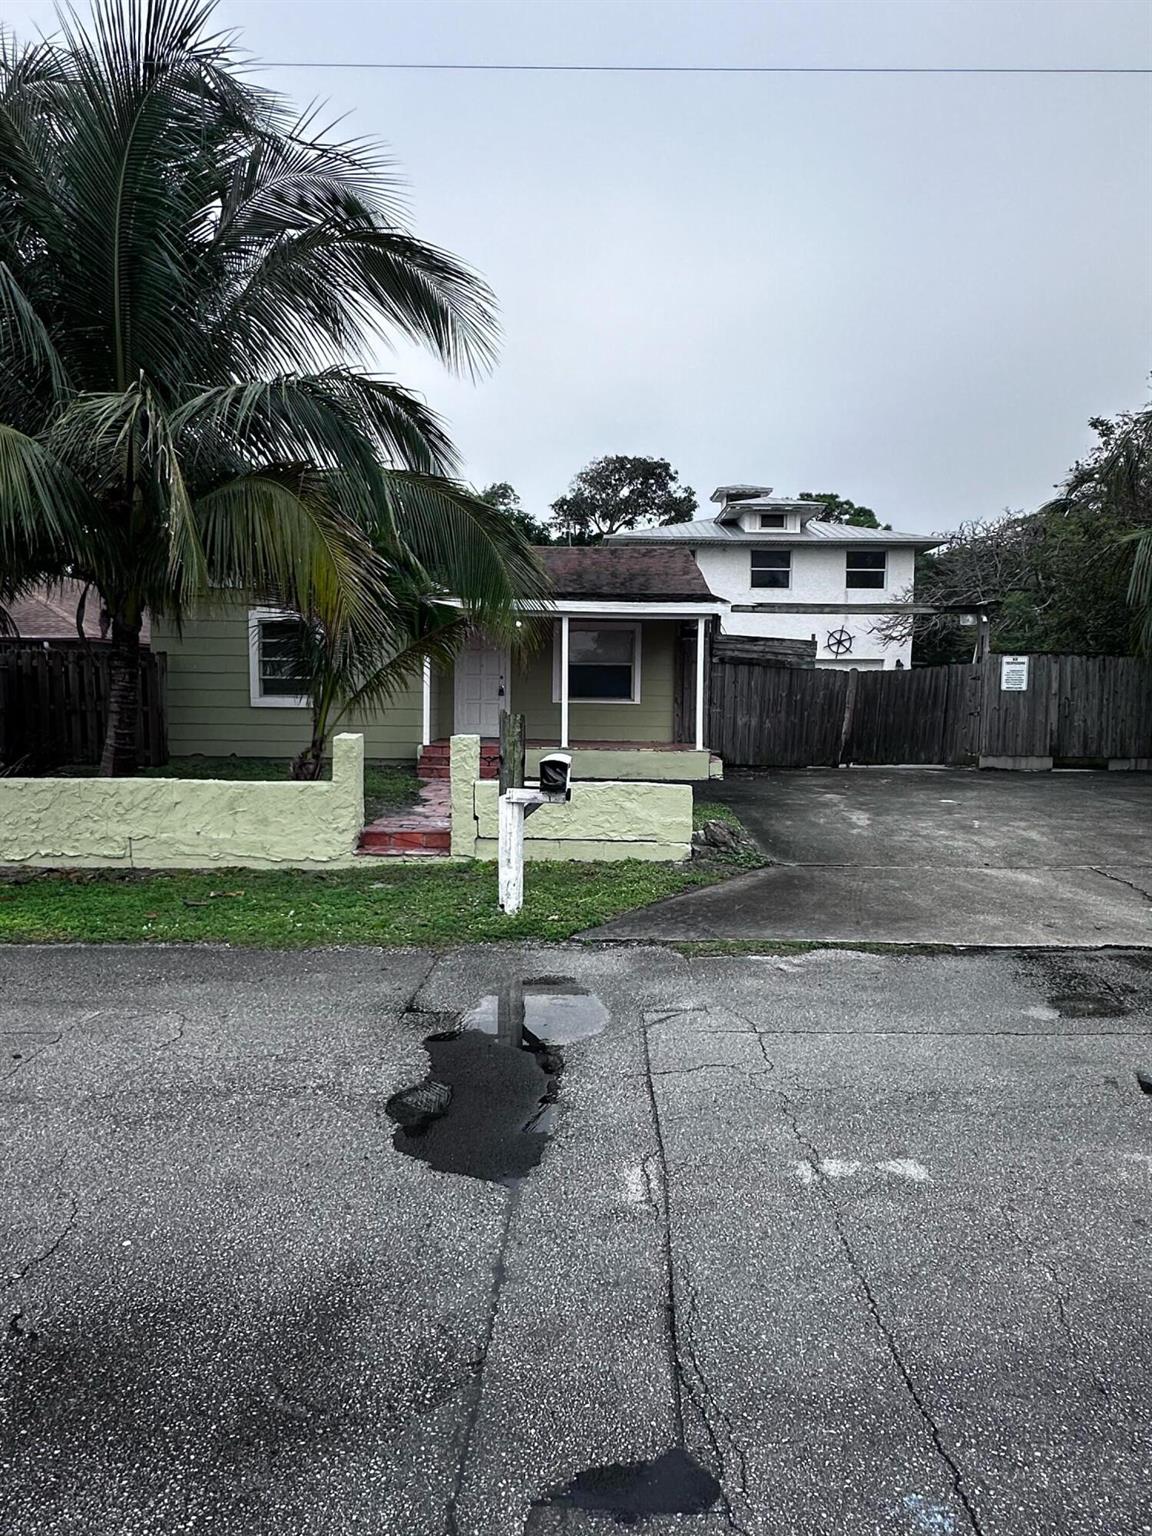
Active
$658,900
bds
|
0
ba
|
2,815
sqft
|
built
1946
130 NE 4th Ave, Boynton Beach, FL 33435
$-1,445
Cash flow
-11.4%
Cash-on-Cash Return
3.5%
Cap rate
0.5%
Rent to Value Ratio
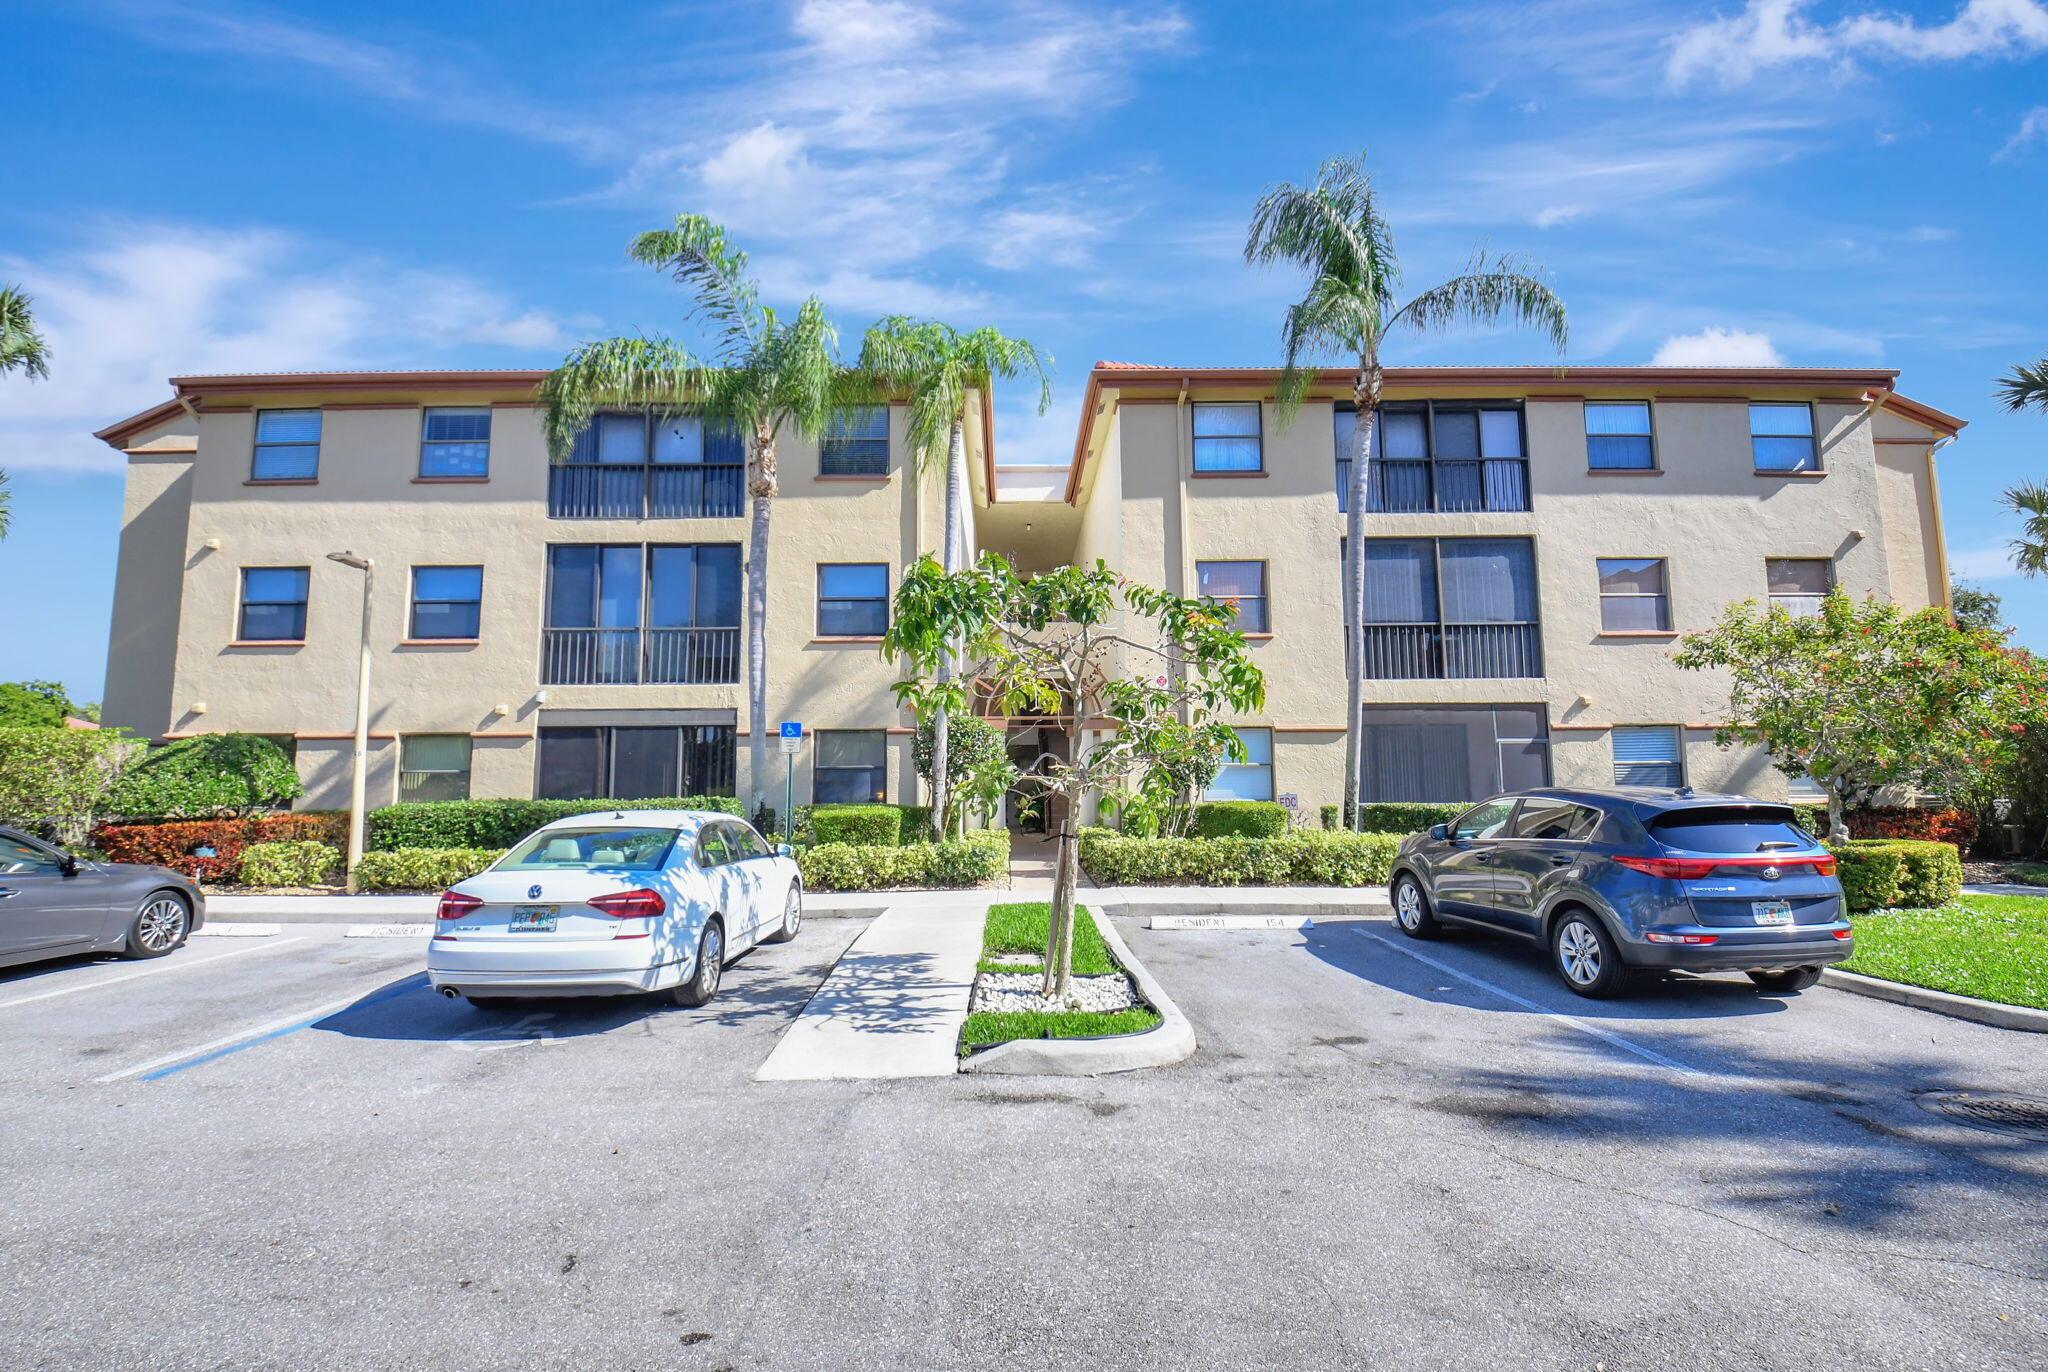
Active
$254,000
3
bds
|
2
ba
|
1,374
sqft
|
built
1993
5099 Splendido Ct, Boynton Beach, FL 33437
$-725
Cash flow
-14.9%
Cash-on-Cash Return
2.7%
Cap rate
1.0%
Rent to Value Ratio
Active
$320,000
3
bds
|
2
ba
|
1,367
sqft
|
built
2006
4 Renaissance Way, Boynton Beach, FL 33426
$-1,094
Cash flow
-17.8%
Cash-on-Cash Return
2.0%
Cap rate
0.9%
Rent to Value Ratio
Active
$1,999,000
3
bds
|
3
ba
|
2,807
sqft
|
built
1978
822 SW 33rd Pl, Boynton Beach, FL 33435
$-5,548
Cash flow
-14.5%
Cash-on-Cash Return
2.8%
Cap rate
0.5%
Rent to Value Ratio
Active
$192,000
2
bds
|
2
ba
|
1,008
sqft
|
built
1984
9780 Pineapple Tree Dr, Boynton Beach, FL 33436
$-162
Cash flow
-4.4%
Cash-on-Cash Return
5.1%
Cap rate
1.0%
Rent to Value Ratio
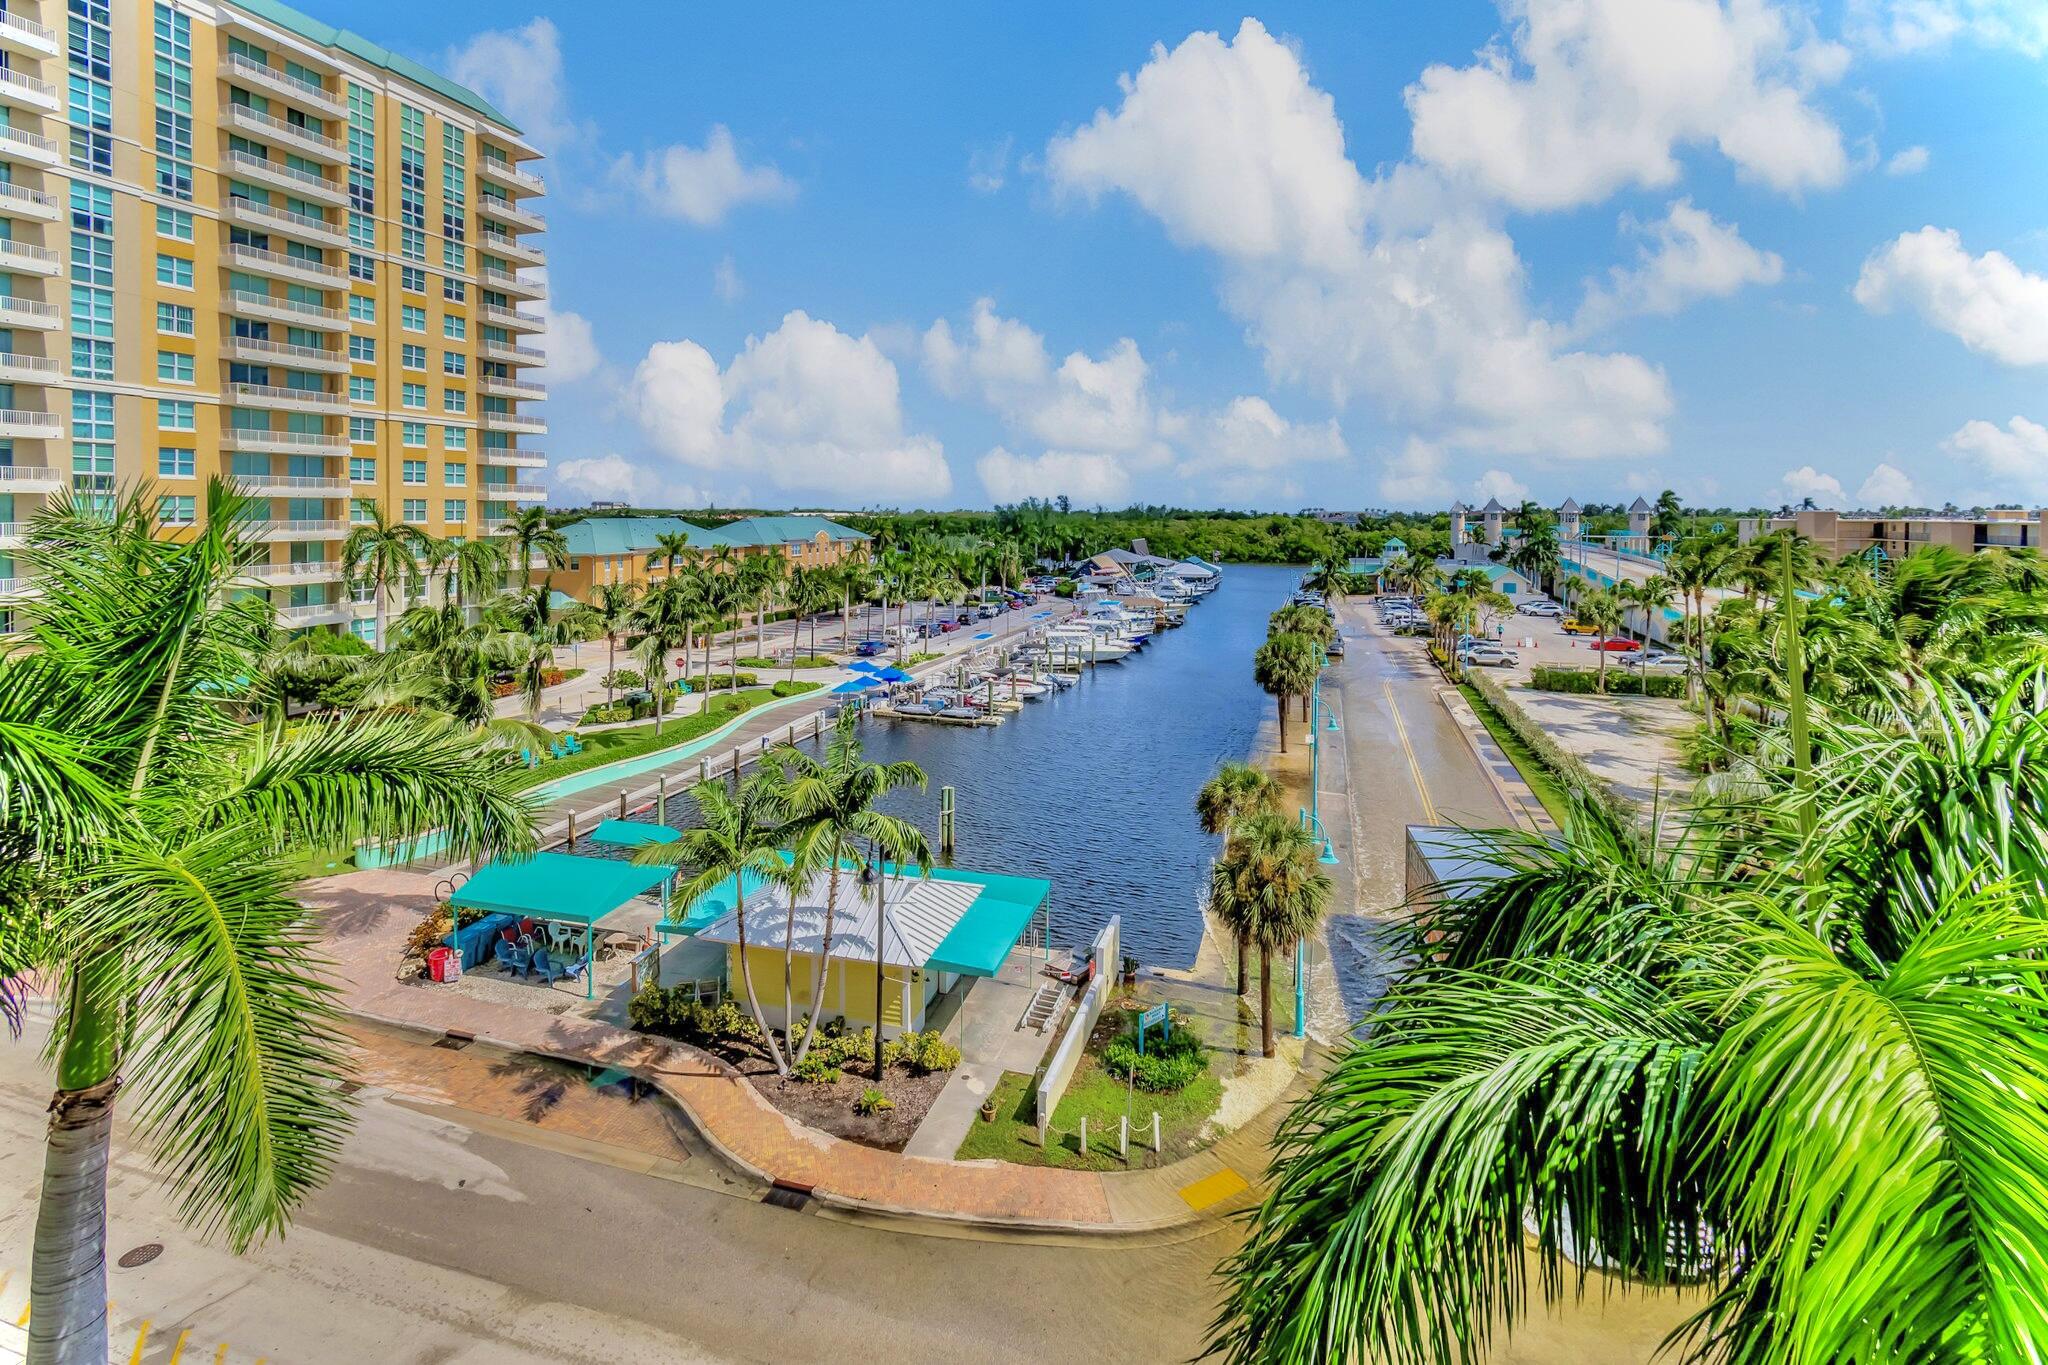
Active
$310,000
2
bds
|
2
ba
|
908
sqft
|
built
1974
720 E Ocean Ave, Boynton Beach, FL 33435
$-764
Cash flow
-12.9%
Cash-on-Cash Return
3.2%
Cap rate
0.8%
Rent to Value Ratio
Active
$199,000
2
bds
|
2
ba
|
1,026
sqft
|
built
1975
1914 Palmland Dr, Boynton Beach, FL 33436
$-129
Cash flow
-3.4%
Cash-on-Cash Return
5.4%
Cap rate
1.1%
Rent to Value Ratio
Active
$359,000
1
bds
|
1
ba
|
691
sqft
|
built
2006
100 NE 6th St, Boynton Beach, FL 33435
$-892
Cash flow
-13.0%
Cash-on-Cash Return
3.2%
Cap rate
0.7%
Rent to Value Ratio
Active
$699,000
2
bds
|
3
ba
|
1,566
sqft
|
built
1987
626 Mariners Way, Boynton Beach, FL 33435
$-1,574
Cash flow
-11.7%
Cash-on-Cash Return
3.4%
Cap rate
0.6%
Rent to Value Ratio
Active
$293,000
2
bds
|
2
ba
|
1,377
sqft
|
built
1990
5427 Verona Dr, Boynton Beach, FL 33437
$-731
Cash flow
-13.0%
Cash-on-Cash Return
3.2%
Cap rate
0.9%
Rent to Value Ratio

Active
$220,000
2
bds
|
2
ba
|
953
sqft
|
built
1987
25 Crossings Cir, Boynton Beach, FL 33435
$-586
Cash flow
-13.9%
Cash-on-Cash Return
3.0%
Cap rate
0.9%
Rent to Value Ratio
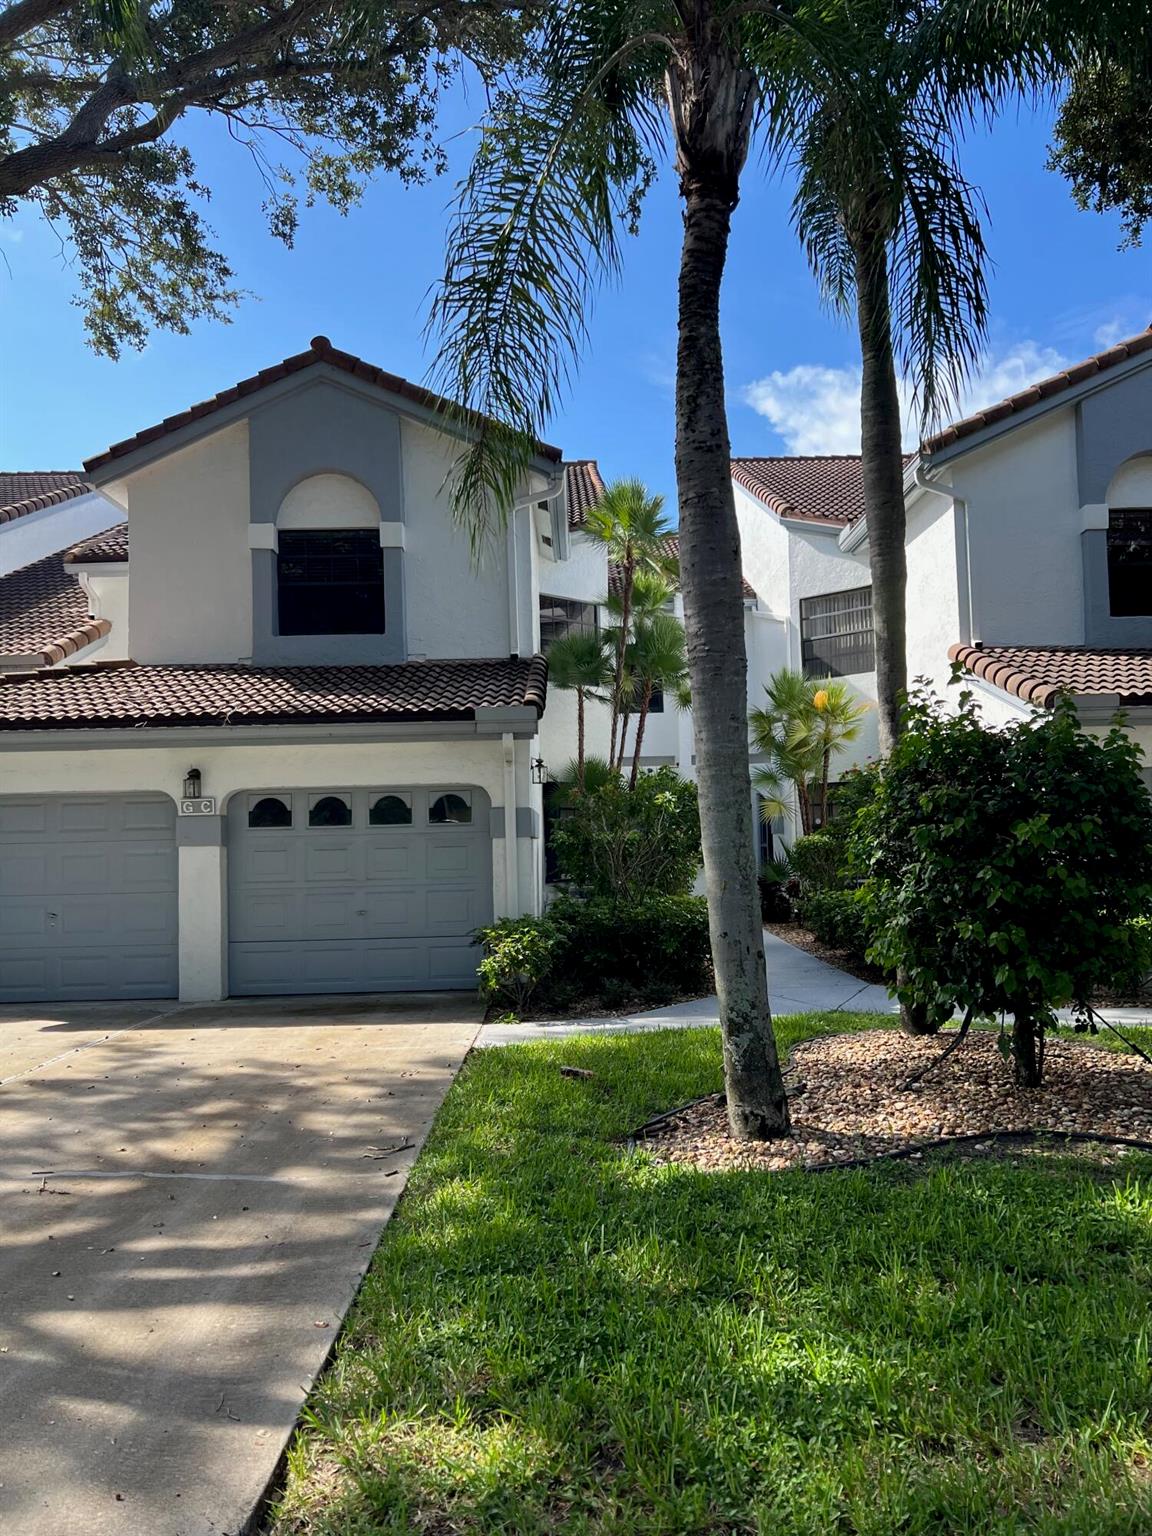
Active
$295,000
2
bds
|
2
ba
|
1,380
sqft
|
built
1987
172 Meadows Dr, Boynton Beach, FL 33436
$-450
Cash flow
-8.0%
Cash-on-Cash Return
4.3%
Cap rate
0.8%
Rent to Value Ratio
Active
$249,000
1
bds
|
1
ba
|
726
sqft
|
built
2002
2205 Tuscany Way, Boynton Beach, FL 33435
$-995
Cash flow
-20.8%
Cash-on-Cash Return
1.4%
Cap rate
0.8%
Rent to Value Ratio
Active
$329,999
2
bds
|
3
ba
|
1,374
sqft
|
built
1988
3101 Hayden Ct, Boynton Beach, FL 33436
$-789
Cash flow
-12.5%
Cash-on-Cash Return
3.3%
Cap rate
0.8%
Rent to Value Ratio
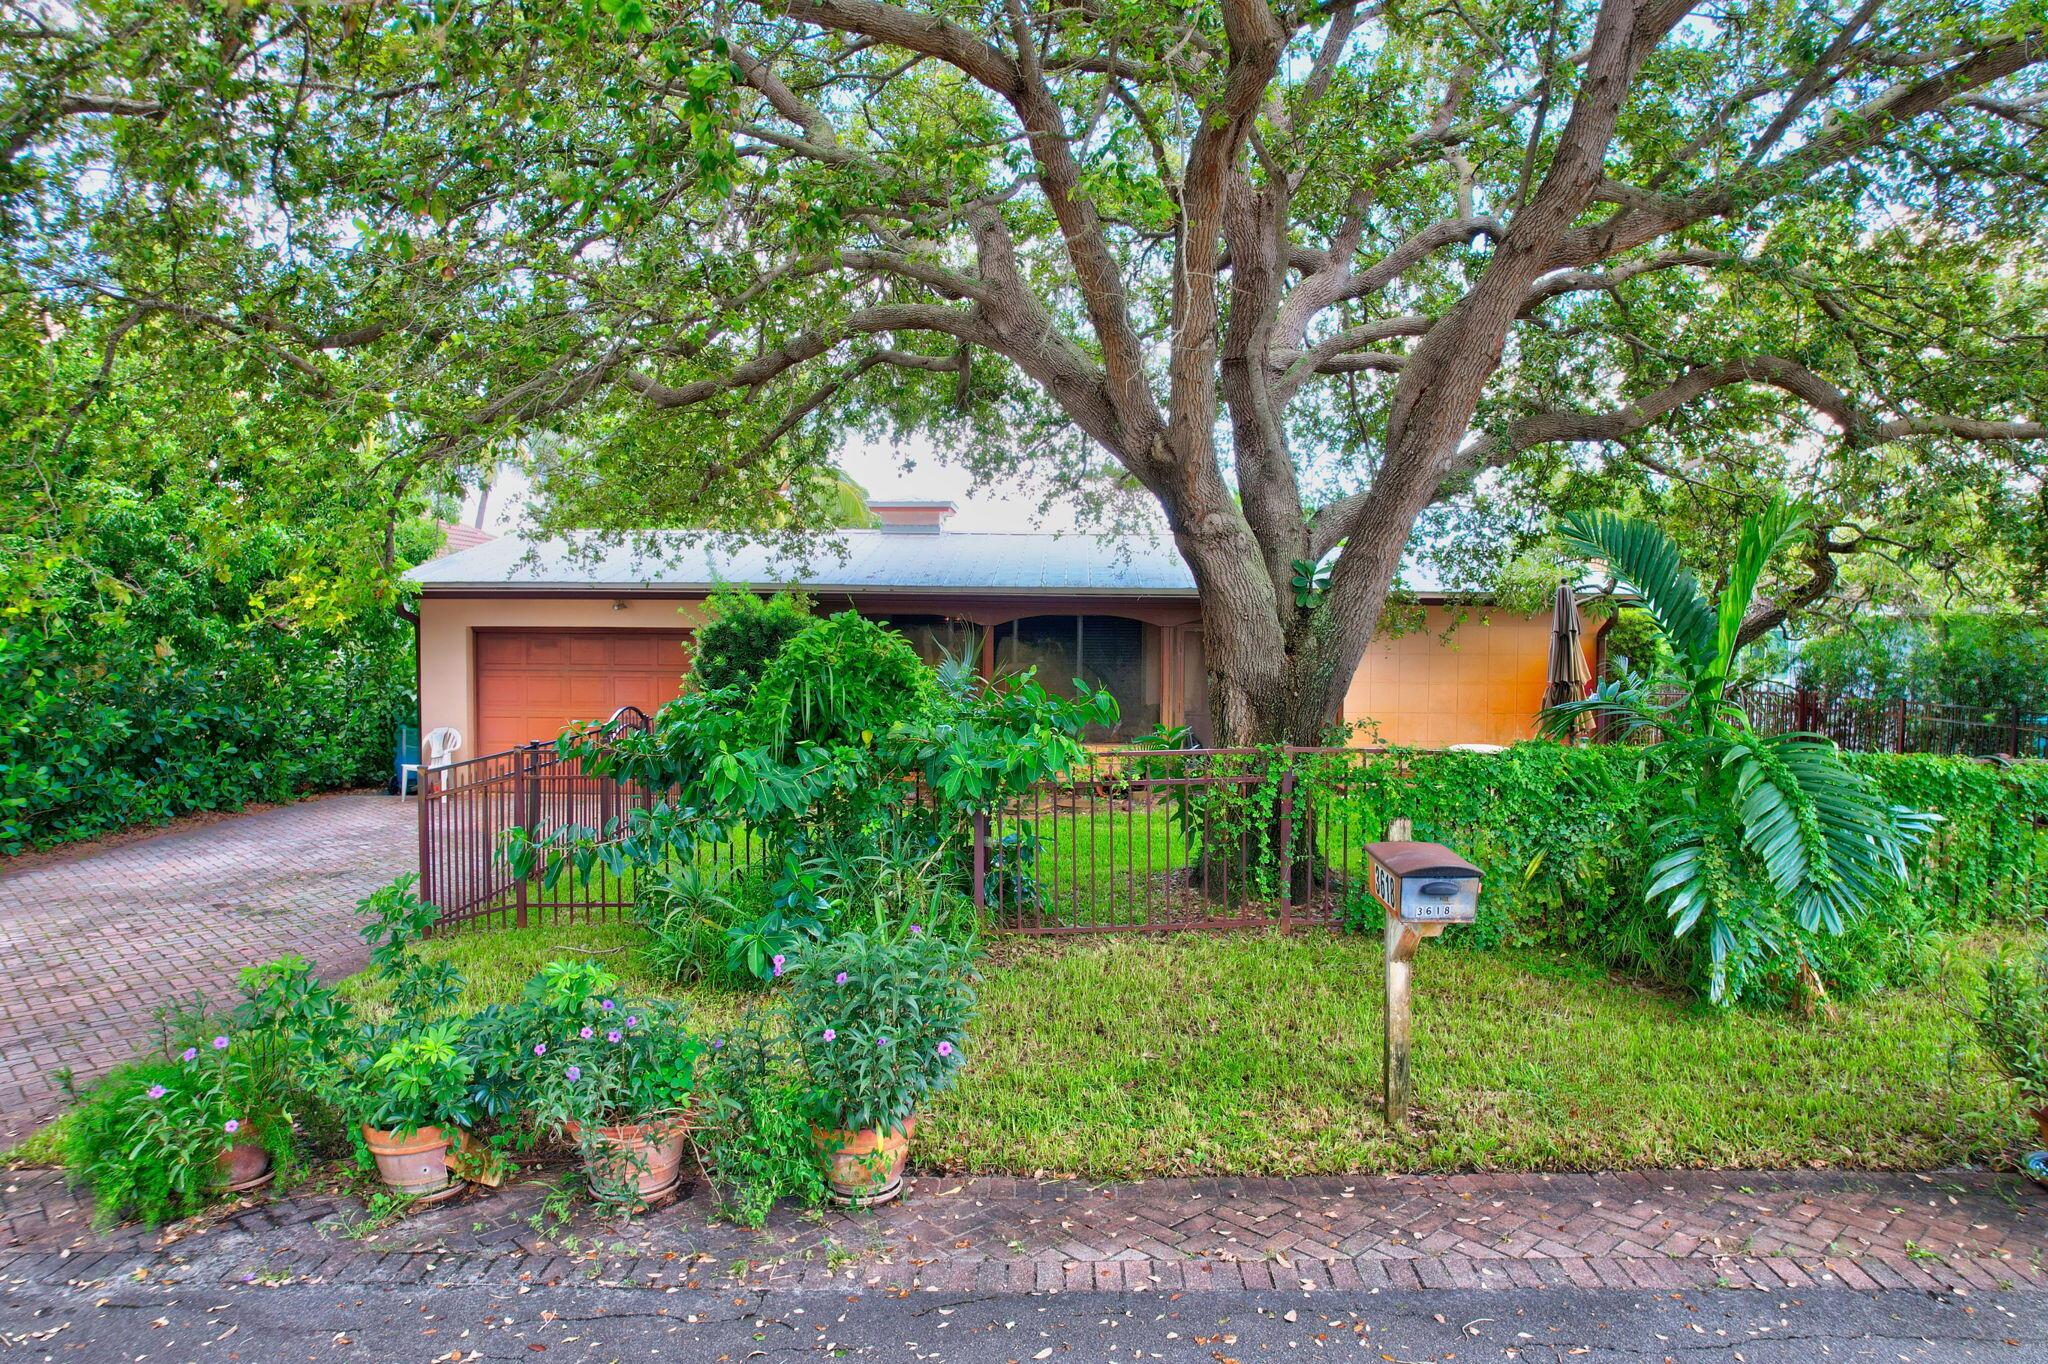
Active
$598,000
3
bds
|
2
ba
|
1,592
sqft
|
built
1956
3618 SE 1st St, Boynton Beach, FL 33435
$-558
Cash flow
-4.9%
Cash-on-Cash Return
5.0%
Cap rate
0.7%
Rent to Value Ratio
Active
$600,000
4
bds
|
3
ba
|
2,810
sqft
|
built
2006
1017 Grove Park Cir, Boynton Beach, FL 33436
$-1,610
Cash flow
-14.0%
Cash-on-Cash Return
2.9%
Cap rate
0.7%
Rent to Value Ratio
Active
$269,000
2
bds
|
2
ba
|
996
sqft
|
built
1989
22 Via De Casas Sur, Boynton Beach, FL 33426
$-895
Cash flow
-17.4%
Cash-on-Cash Return
2.2%
Cap rate
0.9%
Rent to Value Ratio
Active
$285,000
3
bds
|
2
ba
|
1,374
sqft
|
built
1995
5153 Floria Dr, Boynton Beach, FL 33437
$-590
Cash flow
-10.8%
Cash-on-Cash Return
3.7%
Cap rate
1.0%
Rent to Value Ratio
Active
$350,000
2
bds
|
2
ba
|
1,400
sqft
|
built
1979
4865 Equestrian Cir, Boynton Beach, FL 33436
$-970
Cash flow
-14.5%
Cash-on-Cash Return
2.8%
Cap rate
0.7%
Rent to Value Ratio
Active
$416,999
2
bds
|
2
ba
|
1,471
sqft
|
built
1995
1821 Wood Fern Dr, Boynton Beach, FL 33436
$-1,132
Cash flow
-14.2%
Cash-on-Cash Return
2.9%
Cap rate
0.7%
Rent to Value Ratio
Active
$679,900
3
bds
|
3
ba
|
1,575
sqft
|
built
2017
3106 Waterside Cir, Boynton Beach, FL 33435
$-2,352
Cash flow
-18.0%
Cash-on-Cash Return
2.0%
Cap rate
0.6%
Rent to Value Ratio
Active
$525,000
3
bds
|
3
ba
|
2,645
sqft
|
built
1990
9 Windsor Ln, Boynton Beach, FL 33436
$-2,016
Cash flow
-20.0%
Cash-on-Cash Return
1.5%
Cap rate
0.9%
Rent to Value Ratio
Active
$1,050,000
3
bds
|
2
ba
|
2,314
sqft
|
built
1977
3432 Royal Tern Cir, Boynton Beach, FL 33436
$-3,267
Cash flow
-16.2%
Cash-on-Cash Return
2.4%
Cap rate
0.5%
Rent to Value Ratio
Active
$895,000
3
bds
|
2
ba
|
2,314
sqft
|
built
1977
3612 Royal Tern Cir, Boynton Beach, FL 33436
$-1,974
Cash flow
-11.5%
Cash-on-Cash Return
3.5%
Cap rate
0.7%
Rent to Value Ratio
Active
$359,000
3
bds
|
2
ba
|
1,809
sqft
|
built
1985
23 Eastgate Dr, Boynton Beach, FL 33436
$-1,465
Cash flow
-21.3%
Cash-on-Cash Return
1.3%
Cap rate
1.0%
Rent to Value Ratio
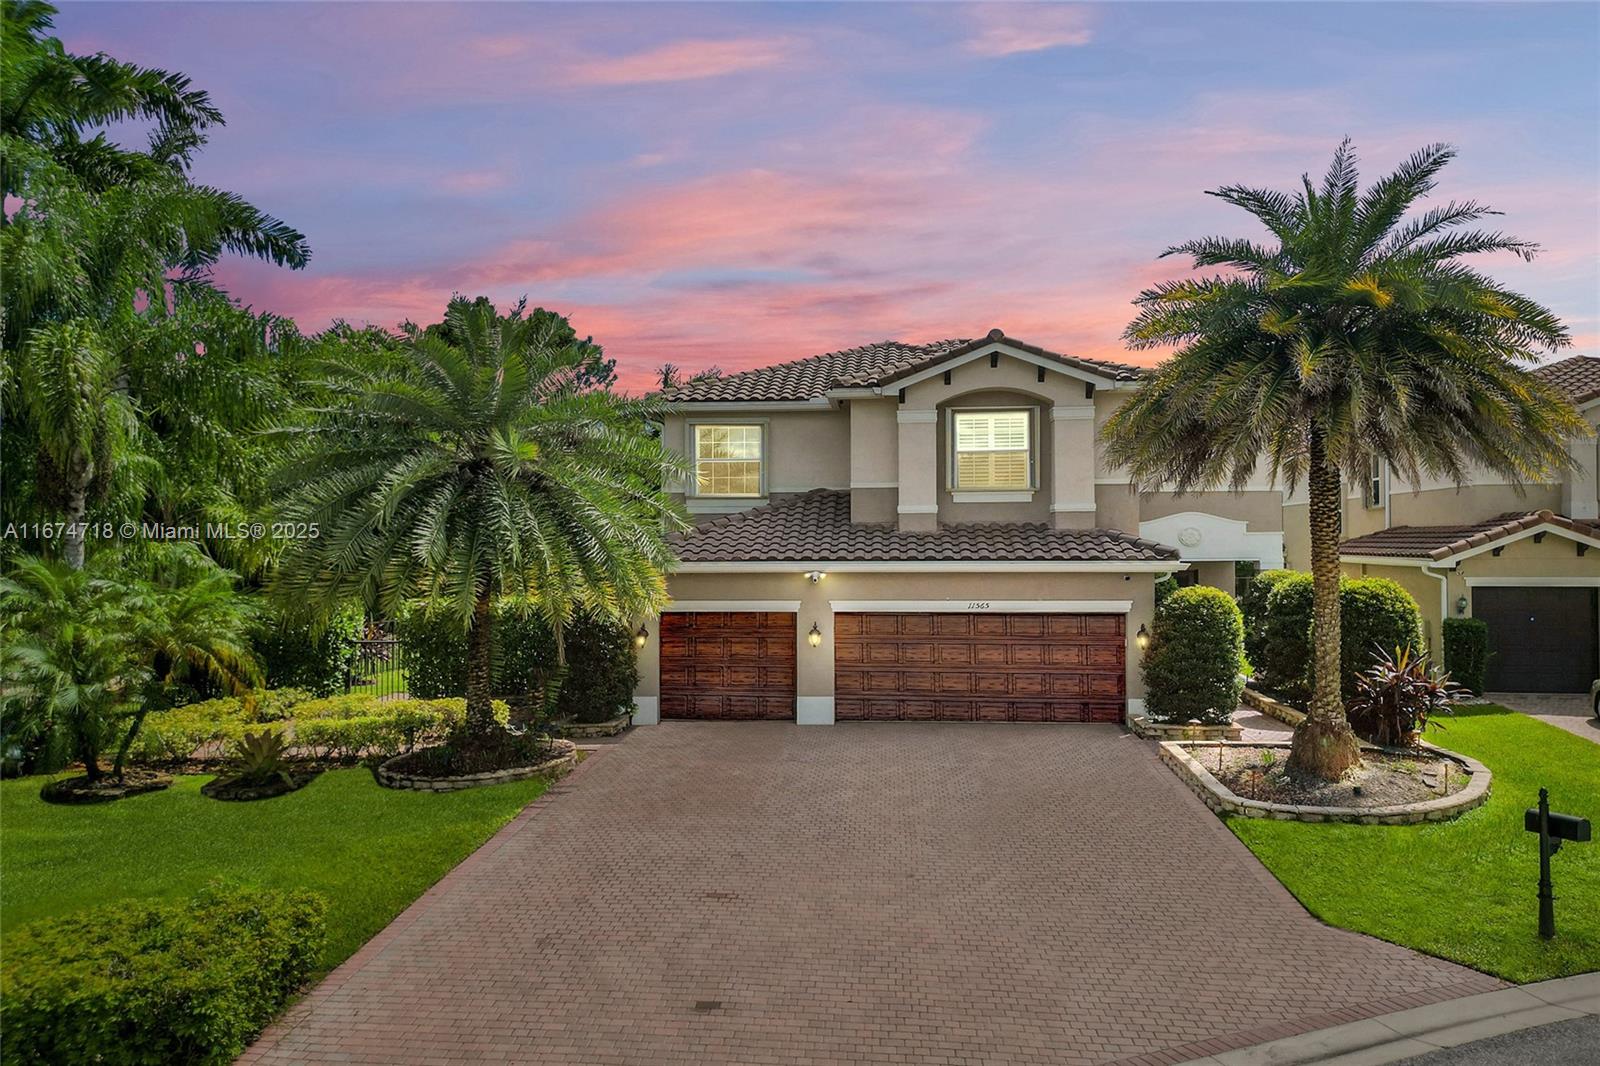
Active
$1,250,000
6
bds
|
5
ba
|
3,976
sqft
|
built
2014
11565 Mantova Bay Cir, Boynton Beach, FL 33473
$-2,134
Cash flow
-8.9%
Cash-on-Cash Return
4.1%
Cap rate
0.6%
Rent to Value Ratio
Active
$650,000
3
bds
|
2
ba
|
1,328
sqft
|
built
1962
640 Dimick Rd, Boynton Beach, FL 33435
$326
Cash flow
2.6%
Cash-on-Cash Return
6.7%
Cap rate
1.0%
Rent to Value Ratio
Active
$305,000
1
bds
|
1
ba
|
820
sqft
|
built
2010
450 N Federal Hwy, Boynton Beach, FL 33435
$-857
Cash flow
-14.7%
Cash-on-Cash Return
2.8%
Cap rate
0.8%
Rent to Value Ratio
Active
$202,500
2
bds
|
2
ba
|
1,248
sqft
|
built
1974
517 SW 1st Ct, Boynton Beach, FL 33435
$-405
Cash flow
-10.4%
Cash-on-Cash Return
3.7%
Cap rate
1.0%
Rent to Value Ratio
Active
$239,000
1
bds
|
1
ba
|
726
sqft
|
built
2002
2305 Tuscany Way, Boynton Beach, FL 33435
$-764
Cash flow
-16.7%
Cash-on-Cash Return
2.3%
Cap rate
0.8%
Rent to Value Ratio
Active
$249,000
2
bds
|
2
ba
|
953
sqft
|
built
1988
26 Crossings Cir, Boynton Beach, FL 33435
$-210
Cash flow
-4.4%
Cash-on-Cash Return
5.1%
Cap rate
0.9%
Rent to Value Ratio
Active
$539,000
3
bds
|
3
ba
|
2,209
sqft
|
built
2006
40 Lancaster Rd, Boynton Beach, FL 33426
$-1,096
Cash flow
-10.6%
Cash-on-Cash Return
3.7%
Cap rate
0.7%
Rent to Value Ratio
Pending
$912,000
3
bds
|
2
ba
|
1,521
sqft
|
built
1959
3101 Canal Dr, Boynton Beach, FL 33435
$-1,301
Cash flow
-7.4%
Cash-on-Cash Return
4.4%
Cap rate
0.6%
Rent to Value Ratio
Active
$1,800,000
4
bds
|
3
ba
|
2,550
sqft
|
built
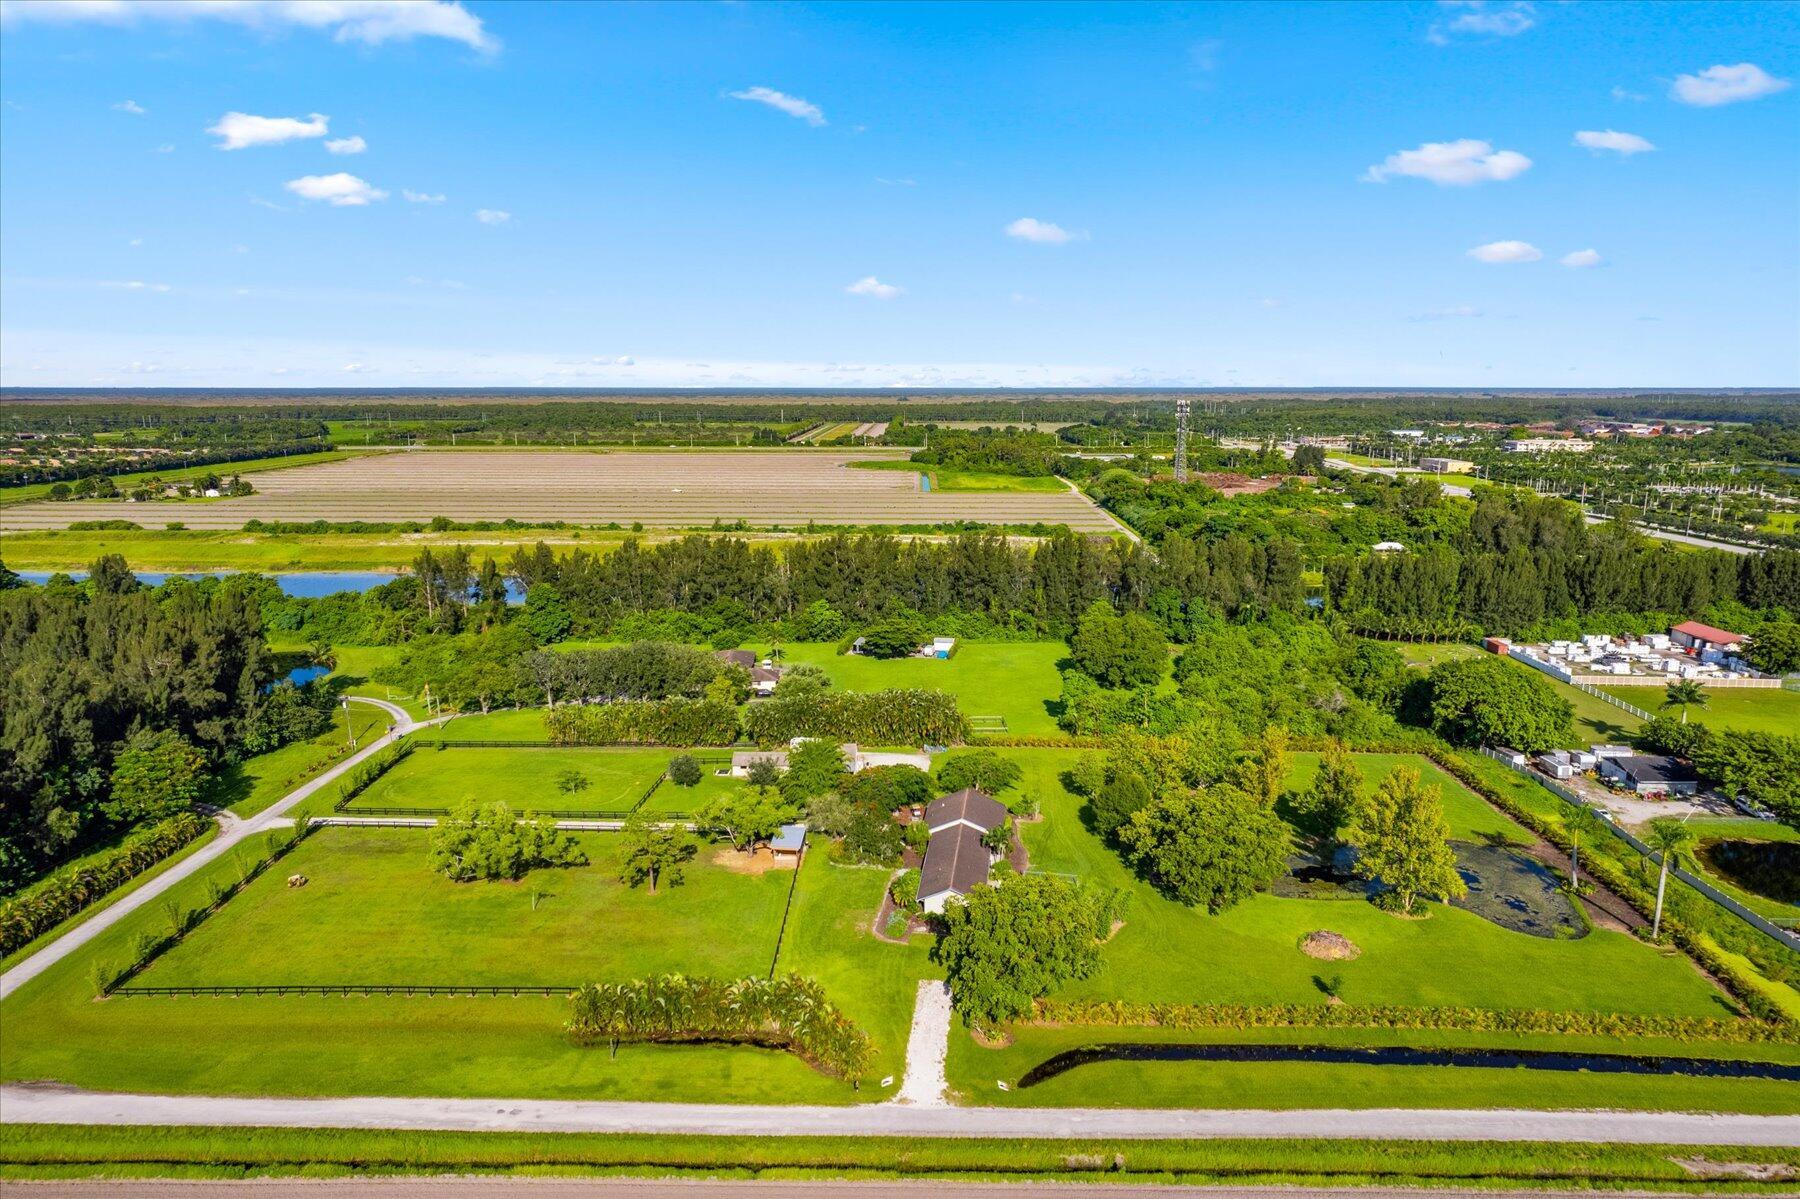
1982
9405 102nd Pl S, Boynton Beach, FL 33473
$-3,550
Cash flow
-10.3%
Cash-on-Cash Return
3.8%
Cap rate
0.5%
Rent to Value Ratio
Active
$240,000
2
bds
|
2
ba
|
1,137
sqft
|
built
2007
1660 Renaissance Commons Blvd, Boynton Beach, FL 33426
$-938
Cash flow
-20.4%
Cash-on-Cash Return
1.5%
Cap rate
0.9%
Rent to Value Ratio
Active
$275,000
3
bds
|
2
ba
|
1,692
sqft
|
built
1992
5299 Europa Dr, Boynton Beach, FL 33437
$-547
Cash flow
-10.4%
Cash-on-Cash Return
3.8%
Cap rate
1.1%
Rent to Value Ratio
Active
$545,000
3
bds
|
4
ba
|
2,556
sqft
|
built
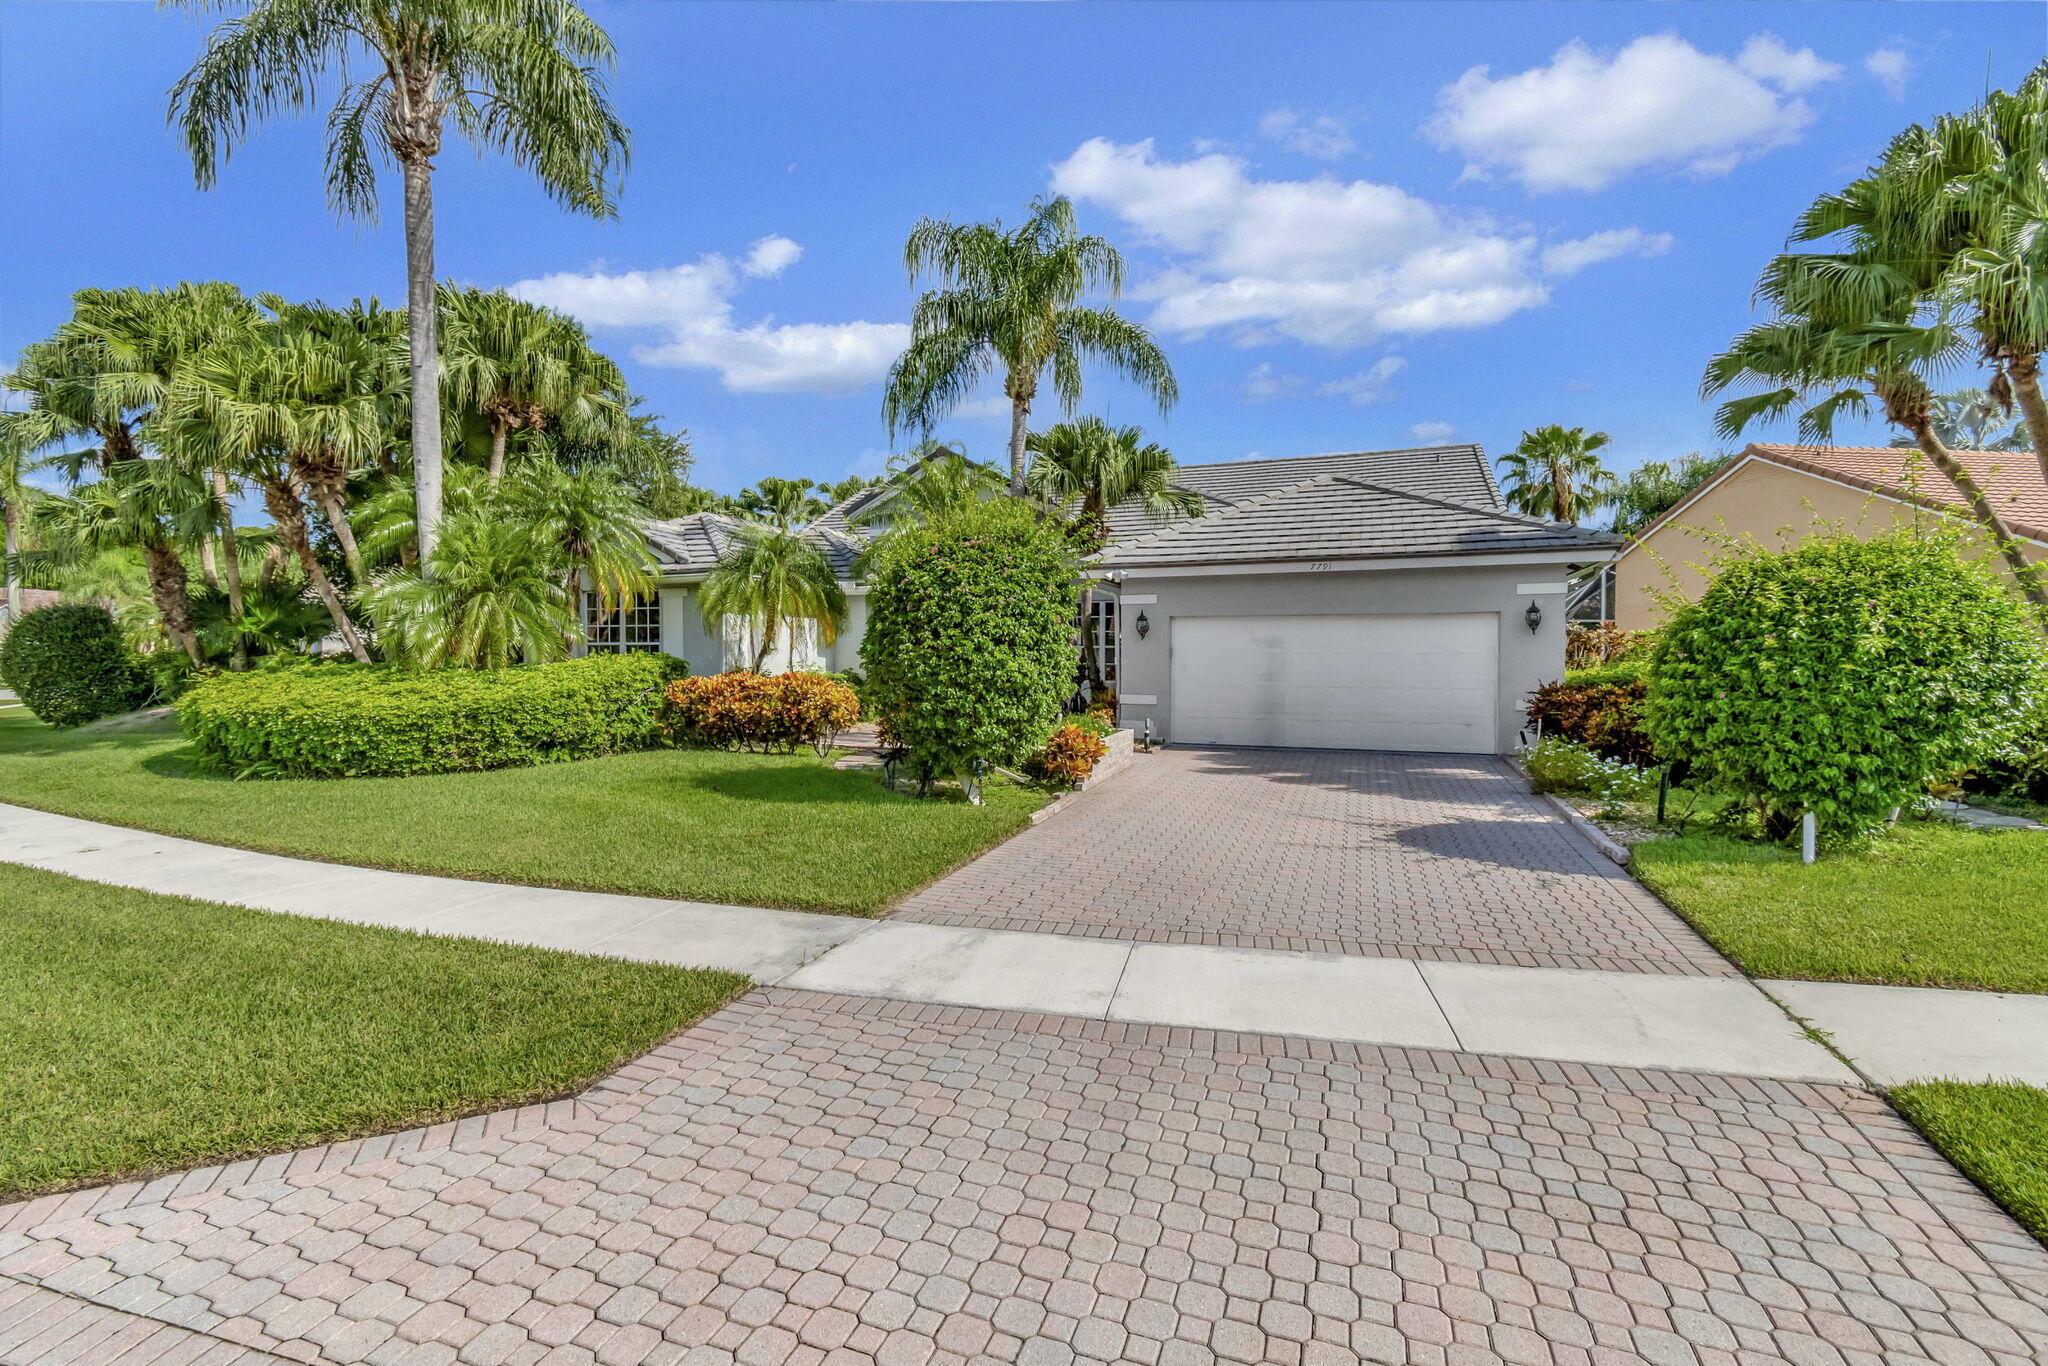
1991
7791 Bridlington Dr, Boynton Beach, FL 33472
$-518
Cash flow
-5.0%
Cash-on-Cash Return
5.0%
Cap rate
0.8%
Rent to Value Ratio
Active
$299,000
2
bds
|
2
ba
|
1,241
sqft
|
built
2007
1660 Renaissance Commons Blvd, Boynton Beach, FL 33426
$-1,042
Cash flow
-18.2%
Cash-on-Cash Return
2.0%
Cap rate
0.8%
Rent to Value Ratio
Active
$245,900
2
bds
|
2
ba
|
1,114
sqft
|
built
1980
1730 Palmland Dr, Boynton Beach, FL 33436
$-190
Cash flow
-4.0%
Cash-on-Cash Return
5.2%
Cap rate
0.9%
Rent to Value Ratio
Active
$165,999
2
bds
|
2
ba
|
864
sqft
|
built
1985
21 Crossings Cir, Boynton Beach, FL 33435
$-193
Cash flow
-6.1%
Cash-on-Cash Return
4.7%
Cap rate
1.1%
Rent to Value Ratio