Brandon, FL Investment Properties for Sale
Browse homes for sale and investment properties in Brandon, FL. Refine your search by price, property type, or more.
Best cash flowing properties in Brandon, FL
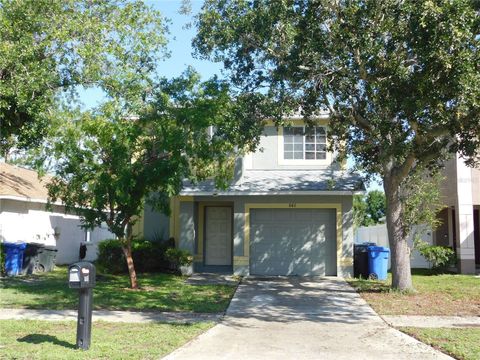
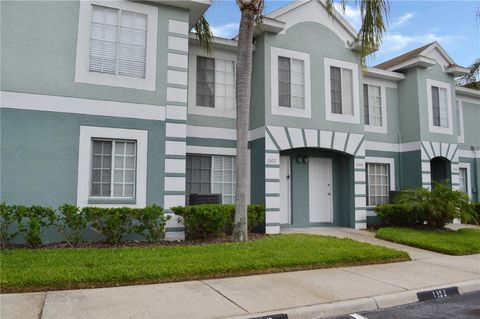
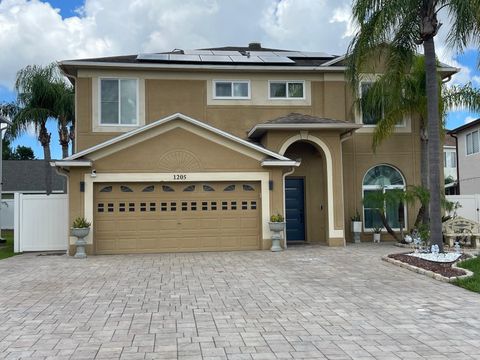
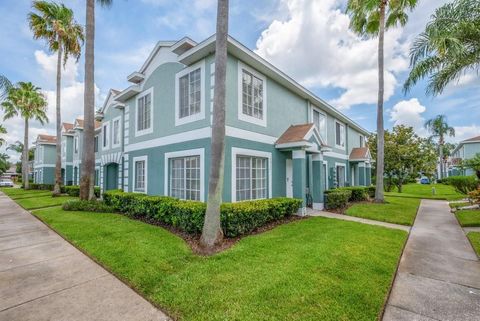
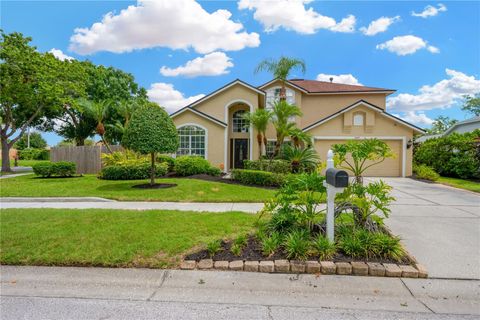
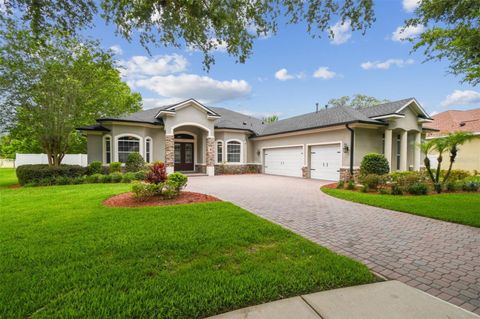
Active
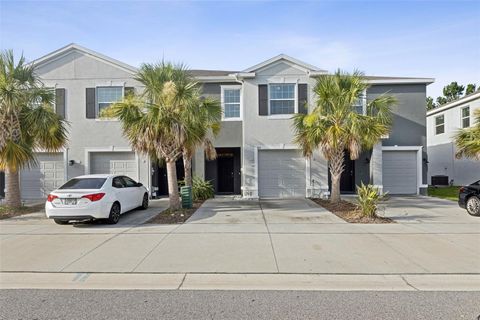
$235,000
3
bds
|
3
ba
|
1,426
sqft
|
built
2000
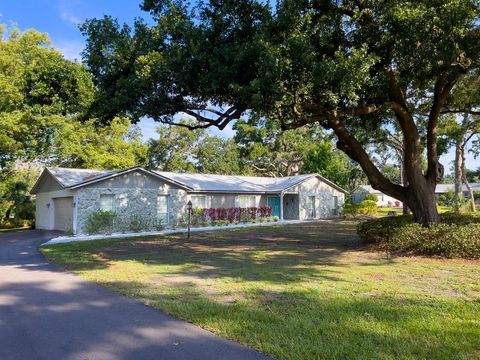
846 Burlwood St, Brandon, FL 33511
$114
Cash flow
2.5%
Cash-on-Cash Return
6.8%
Cap rate
0.9%
Rent to Value Ratio
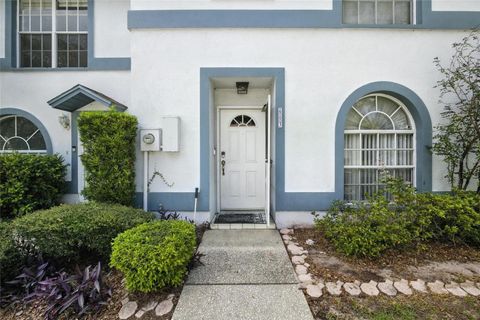
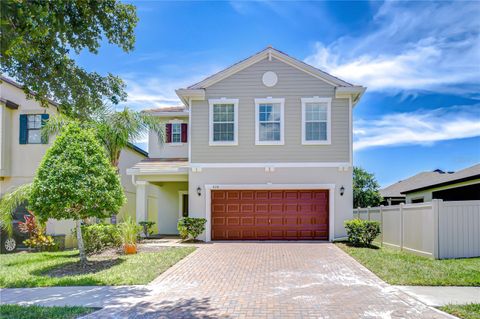
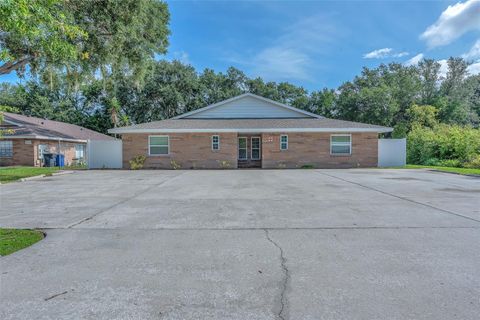
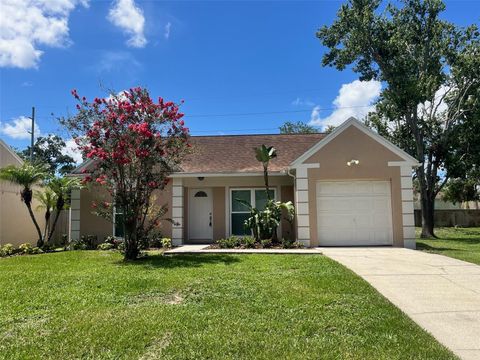
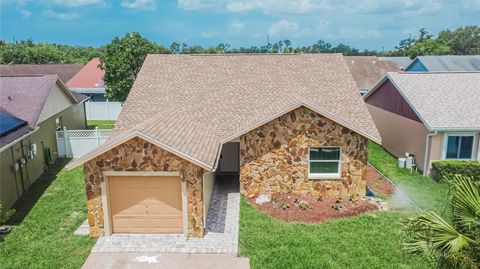
Active
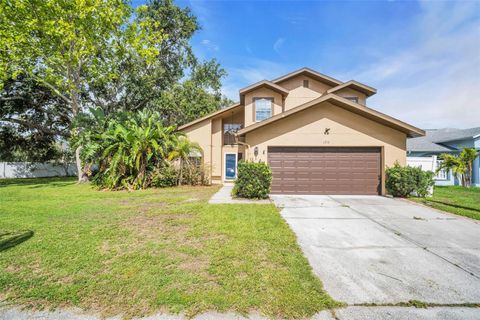
$199,900
3
bds
|
3
ba
|
1,160
sqft
|
built
1989
603 Bainbridge Dr, Brandon, FL 33511
$28
Cash flow
0.7%
Cash-on-Cash Return
6.4%
Cap rate
1.0%
Rent to Value Ratio
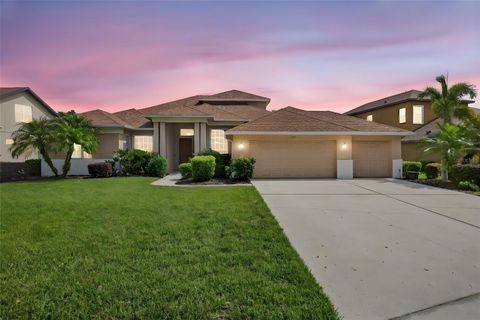
202 out of 213 properties for sale in Brandon, FL
Limited Results Shown
Create a free account, or log in to reveal all property listings and enjoy the complete experience.
Active
$524,900
4
bds
|
3
ba
|
2,717
sqft
|
built
1989
1810 Tamerlane Pl, Brandon, FL 33510
$-903
Cash flow
-9.0%
Cash-on-Cash Return
4.2%
Cap rate
0.6%
Rent to Value Ratio
Active
$441,500
5
bds
|
3
ba
|
2,067
sqft
|
built
1977
1209 Croydonwood Cir, Brandon, FL 33510
$-777
Cash flow
-9.2%
Cash-on-Cash Return
4.2%
Cap rate
0.7%
Rent to Value Ratio
Active
$234,900
2
bds
|
3
ba
|
1,595
sqft
|
built
1999
1302 Twilridge Pl, Brandon, FL 33511
$-366
Cash flow
-8.1%
Cash-on-Cash Return
4.4%
Cap rate
0.9%
Rent to Value Ratio
Active
$430,000
3
bds
|
3
ba
|
2,157
sqft
|
built
2016
828 Terra Vista St, Brandon, FL 33511
$-1,140
Cash flow
-13.8%
Cash-on-Cash Return
3.1%
Cap rate
0.6%
Rent to Value Ratio
Active
$199,900
3
bds
|
3
ba
|
1,160
sqft
|
built
1989
603 Bainbridge Dr, Brandon, FL 33511
$28
Cash flow
0.7%
Cash-on-Cash Return
6.4%
Cap rate
1.0%
Rent to Value Ratio
Active
$949,000
5
bds
|
4
ba
|
3,495
sqft
|
built
2012
3503 Graycliff Ln, Brandon, FL 33511
$-2,810
Cash flow
-15.4%
Cash-on-Cash Return
2.7%
Cap rate
0.5%
Rent to Value Ratio
Active
$235,000
3
bds
|
3
ba
|
1,426
sqft
|
built
2000
846 Burlwood St, Brandon, FL 33511
$114
Cash flow
2.5%
Cash-on-Cash Return
6.8%
Cap rate
0.9%
Rent to Value Ratio
Active
$450,000
3
bds
|
2
ba
|
1,620
sqft
|
built
1977
602 Hillpoint Way, Brandon, FL 33510
$-996
Cash flow
-11.5%
Cash-on-Cash Return
3.6%
Cap rate
0.5%
Rent to Value Ratio
Active
$485,000
4
bds
|
3
ba
|
2,424
sqft
|
built
2000
1205 Sweet Gum Dr, Brandon, FL 33511
$-978
Cash flow
-10.5%
Cash-on-Cash Return
3.8%
Cap rate
0.5%
Rent to Value Ratio
Active
$895,000
8
bds
|
8
ba
|
3,457
sqft
|
built
1985
3209 Bloomingdale Villas Ct, Brandon, FL 33511
$-4,535
Cash flow
-26.4%
Cash-on-Cash Return
0.2%
Cap rate
0.2%
Rent to Value Ratio
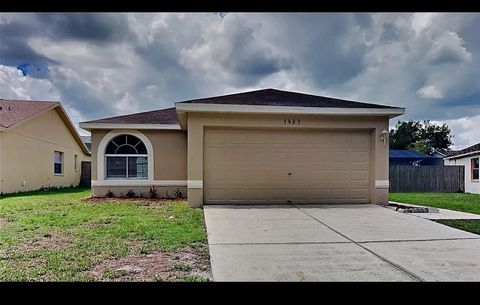
Active
$325,000
3
bds
|
2
ba
|
1,176
sqft
|
built
1990
1421 Mohrlake Dr, Brandon, FL 33511
$-311
Cash flow
-5.0%
Cash-on-Cash Return
5.1%
Cap rate
0.7%
Rent to Value Ratio
Active
$410,000
3
bds
|
3
ba
|
2,255
sqft
|
built
2013
2706 Lantern Hill Ave, Brandon, FL 33511
$-1,163
Cash flow
-14.8%
Cash-on-Cash Return
2.9%
Cap rate
0.6%
Rent to Value Ratio
Active
$250,000
3
bds
|
3
ba
|
1,364
sqft
|
built
2000
1312 Kelridge Pl, Brandon, FL 33511
$-456
Cash flow
-9.5%
Cash-on-Cash Return
4.1%
Cap rate
0.7%
Rent to Value Ratio
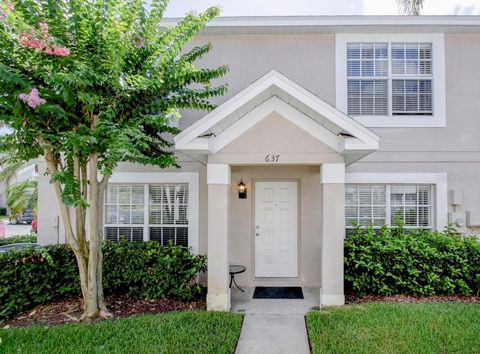
Active
$229,750
2
bds
|
2
ba
|
1,159
sqft
|
built
1998
637 Kensington Lake Cir, Brandon, FL 33511
$-490
Cash flow
-11.1%
Cash-on-Cash Return
3.7%
Cap rate
0.7%
Rent to Value Ratio
Active
$525,000
5
bds
|
3
ba
|
3,452
sqft
|
built
2002
1753 Open Field Loop, Brandon, FL 33510
$-1,435
Cash flow
-14.3%
Cash-on-Cash Return
3.0%
Cap rate
0.6%
Rent to Value Ratio
Active
$135,000
1
bds
|
1
ba
|
612
sqft
|
built
1988
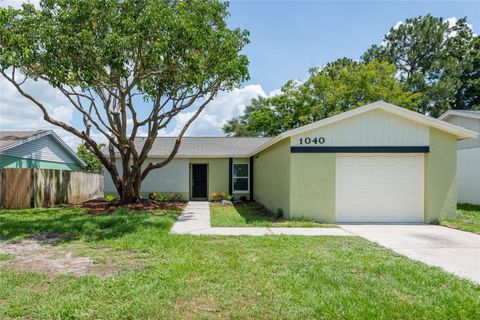
302 Lake Parsons Grn, Brandon, FL 33511
$-174
Cash flow
-6.7%
Cash-on-Cash Return
4.7%
Cap rate
1.0%
Rent to Value Ratio
Active
$595,000
5
bds
|
3
ba
|
2,449
sqft
|
built
1996
1649 Ledgestone Dr, Brandon, FL 33511
$-1,585
Cash flow
-13.9%
Cash-on-Cash Return
3.1%
Cap rate
0.5%
Rent to Value Ratio
Active
$315,000
3
bds
|
2
ba
|
1,164
sqft
|
built
1985
1621 Crossridge Dr, Brandon, FL 33510
$-702
Cash flow
-11.6%
Cash-on-Cash Return
3.6%
Cap rate
0.6%
Rent to Value Ratio
Active
$455,000
4
bds
|
2
ba
|
1,914
sqft
|
built
1993
1716 Westerly Dr, Brandon, FL 33511
$-952
Cash flow
-10.9%
Cash-on-Cash Return
3.8%
Cap rate
0.6%
Rent to Value Ratio
Active
$384,500
3
bds
|
2
ba
|
1,499
sqft
|
built
1986
1610 Sanderling Ct, Brandon, FL 33511
$-595
Cash flow
-8.1%
Cash-on-Cash Return
4.4%
Cap rate
0.6%
Rent to Value Ratio
Active
$350,021
3
bds
|
2
ba
|
1,369
sqft
|
built
1997
1210 Etchfield Cir, Brandon, FL 33511
$-246
Cash flow
-3.7%
Cash-on-Cash Return
5.4%
Cap rate
0.7%
Rent to Value Ratio
Active
$775,000
4
bds
|
4
ba
|
2,773
sqft
|
built
1981
126 Holly Tree Ln, Brandon, FL 33511
$-2,044
Cash flow
-13.8%
Cash-on-Cash Return
3.1%
Cap rate
0.5%
Rent to Value Ratio
Active
$429,900
3
bds
|
3
ba
|
2,057
sqft
|
built
1986
1906 White Cedar Way, Brandon, FL 33511
$-750
Cash flow
-9.1%
Cash-on-Cash Return
4.2%
Cap rate
0.6%
Rent to Value Ratio
Active
$549,000
4
bds
|
4
ba
|
2,798
sqft
|
built
2020
2513 Knight Island Dr, Brandon, FL 33511
$-1,200
Cash flow
-11.4%
Cash-on-Cash Return
3.6%
Cap rate
0.6%
Rent to Value Ratio
Active
$510,000
4
bds
|
2
ba
|
2,058
sqft
|
built
1973
4404 Hickory Branch Ct, Brandon, FL 33511
$-806
Cash flow
-8.2%
Cash-on-Cash Return
4.4%
Cap rate
0.6%
Rent to Value Ratio
Active
$319,000
3
bds
|
2
ba
|
1,093
sqft
|
built
2000
1423 Birchstone Ave, Brandon, FL 33511
$-672
Cash flow
-11.0%
Cash-on-Cash Return
3.7%
Cap rate
0.6%
Rent to Value Ratio
Active
$560,000
4
bds
|
2
ba
|
2,068
sqft
|
built
1997
920 Tuscanny St, Brandon, FL 33511
$-1,282
Cash flow
-11.9%
Cash-on-Cash Return
3.4%
Cap rate
0.6%
Rent to Value Ratio
Active
$349,000
4
bds
|
2
ba
|
1,263
sqft
|
built
1983
1040 Bridlewood Way, Brandon, FL 33511
$-751
Cash flow
-11.2%
Cash-on-Cash Return
3.7%
Cap rate
0.6%
Rent to Value Ratio
Active
$720,000
4
bds
|
3
ba
|
2,810
sqft
|
built
2007
505 Vintage Way, Brandon, FL 33511
$-1,407
Cash flow
-10.2%
Cash-on-Cash Return
3.8%
Cap rate
0.5%
Rent to Value Ratio
Active
$344,500
3
bds
|
2
ba
|
1,227
sqft
|
built
1986
1331 Coolmont Dr, Brandon, FL 33511
$-571
Cash flow
-8.6%
Cash-on-Cash Return
4.2%
Cap rate
0.6%
Rent to Value Ratio
Active
$849,900
4
bds
|
3
ba
|
3,639
sqft
|
built
2009
111 Falling Water Dr, Brandon, FL 33511
$-2,125
Cash flow
-13.0%
Cash-on-Cash Return
3.1%
Cap rate
0.5%
Rent to Value Ratio
Active
$355,000
3
bds
|
2
ba
|
1,299
sqft
|
built
1986
1530 High Knoll Dr, Brandon, FL 33511
$-805
Cash flow
-11.8%
Cash-on-Cash Return
3.4%
Cap rate
0.6%
Rent to Value Ratio
Active
$294,000
3
bds
|
3
ba
|
1,707
sqft
|
built
2020
819 Lucent Sands Ct, Brandon, FL 33511
$-421
Cash flow
-7.5%
Cash-on-Cash Return
4.4%
Cap rate
0.7%
Rent to Value Ratio
Active
$470,000
3
bds
|
3
ba
|
2,010
sqft
|
built
1991
1715 Larabie Ct, Brandon, FL 33511
$-1,115
Cash flow
-12.4%
Cash-on-Cash Return
3.3%
Cap rate
0.6%
Rent to Value Ratio
Active
$449,000
3
bds
|
2
ba
|
1,745
sqft
|
built
1996
1716 Bondurant Way, Brandon, FL 33511
$-802
Cash flow
-9.3%
Cash-on-Cash Return
4.0%
Cap rate
0.6%
Rent to Value Ratio
Active
$499,000
3
bds
|
2
ba
|
1,823
sqft
|
built
1995
2043 Wrangler Dr, Brandon, FL 33511
$-670
Cash flow
-7.0%
Cash-on-Cash Return
4.5%
Cap rate
0.6%
Rent to Value Ratio
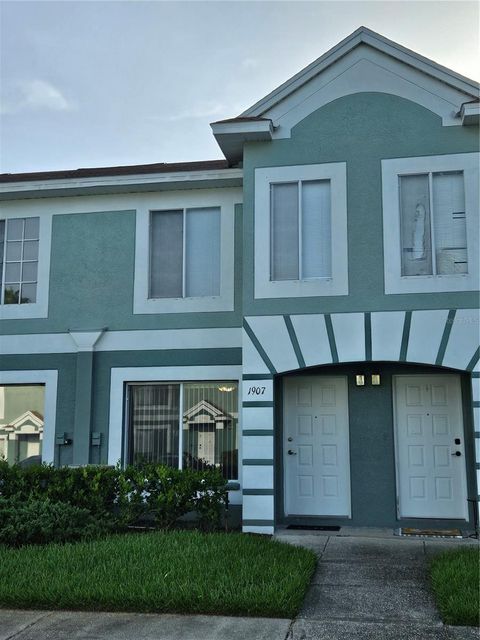
Active
$265,000
2
bds
|
3
ba
|
1,490
sqft
|
built
2000
1907 Fluorshire Dr, Brandon, FL 33511
$-525
Cash flow
-10.3%
Cash-on-Cash Return
3.8%
Cap rate
0.7%
Rent to Value Ratio
Active
$825,000
5
bds
|
4
ba
|
3,911
sqft
|
built
2018
808 Vittorio Pl, Brandon, FL 33511
$-2,039
Cash flow
-12.9%
Cash-on-Cash Return
3.2%
Cap rate
0.4%
Rent to Value Ratio
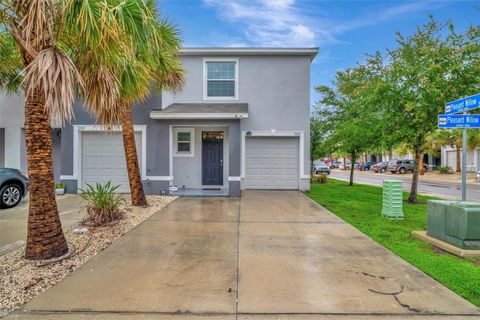
Active
$320,000
3
bds
|
3
ba
|
1,785
sqft
|
built
2022
3320 Pleasant Willow Ct, Brandon, FL 33511
$-692
Cash flow
-11.3%
Cash-on-Cash Return
3.6%
Cap rate
0.7%
Rent to Value Ratio
Active
$200,000
2
bds
|
2
ba
|
1,110
sqft
|
built
2001
2248 Lake Woodberry Cir, Brandon, FL 33510
$-446
Cash flow
-11.6%
Cash-on-Cash Return
3.5%
Cap rate
0.9%
Rent to Value Ratio