Brandon, MS Investment Properties for Sale
Browse homes for sale and investment properties in Brandon, MS. Refine your search by price, property type, or more.
Best cash flowing properties in Brandon, MS

Active
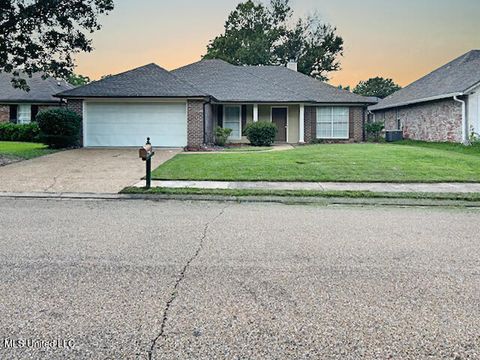
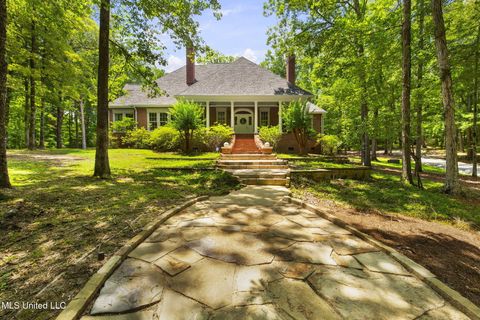
$244,900
3
bds
|
2
ba
|
0
sqft
|
built
1988
214 Boxwood Cir, Brandon, MS 39047
$471
Cash flow
10.0%
Cash-on-Cash Return
8.0%
Cap rate
1.0%
Rent to Value Ratio
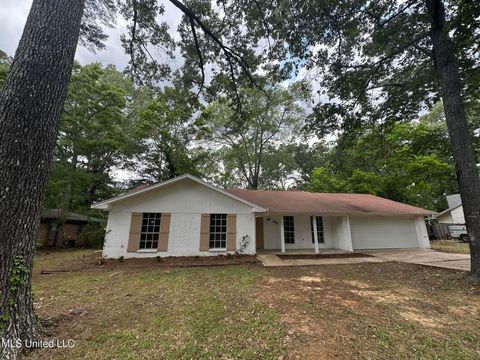
Active
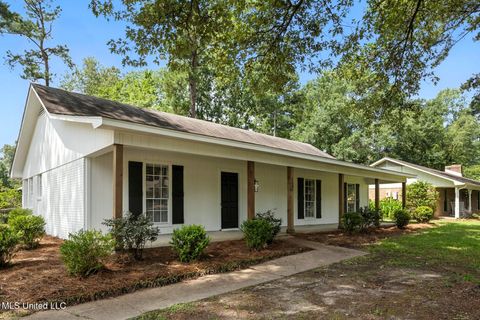
$206,000
3
bds
|
3
ba
|
0
sqft
|
built
1976
108 Fairdale Pl, Brandon, MS 39042
$375
Cash flow
9.5%
Cash-on-Cash Return
7.9%
Cap rate
1.0%
Rent to Value Ratio
180 out of 187 properties for sale in Brandon, MS
Limited Results Shown
Create a free account, or log in to reveal all property listings and enjoy the complete experience.
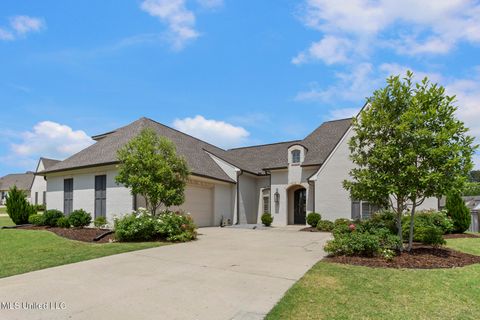
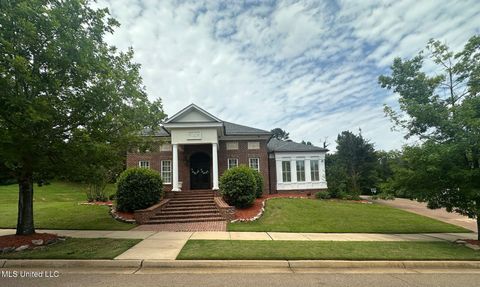
Active
$589,900
5
bds
|
4
ba
|
0
sqft
|
built
2006
208 Kitty Hawk Cir, Brandon, MS 39047
$-383
Cash flow
-3.4%
Cash-on-Cash Return
4.9%
Cap rate
0.7%
Rent to Value Ratio
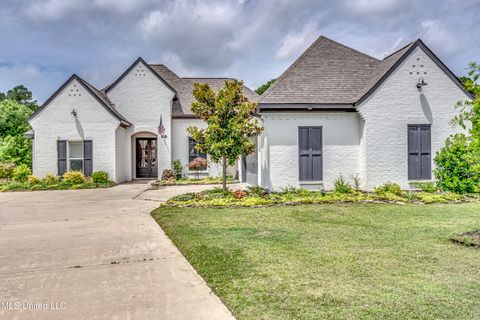
Active
$194,950
2
bds
|
1
ba
|
0
sqft
|
built
1955
109 Circle Dr, Brandon, MS 39042
$59
Cash flow
1.6%
Cash-on-Cash Return
6.0%
Cap rate
0.8%
Rent to Value Ratio
Active
$265,000
3
bds
|
2
ba
|
0
sqft
|
built
2003
210 Laurel Oak Cv, Brandon, MS 39047
$153
Cash flow
3.0%
Cash-on-Cash Return
6.4%
Cap rate
0.8%
Rent to Value Ratio
Active
$409,900
4
bds
|
3
ba
|
0
sqft
|
built
1997
52 Eastgate Dr, Brandon, MS 39042
$-324
Cash flow
-4.1%
Cash-on-Cash Return
4.7%
Cap rate
0.6%
Rent to Value Ratio
Active
$489,000
3
bds
|
3
ba
|
0
sqft
|
built
1992
209 Lake Terrace Pl, Brandon, MS 39047
$19
Cash flow
0.2%
Cash-on-Cash Return
5.7%
Cap rate
0.7%
Rent to Value Ratio

Active
$234,999
3
bds
|
2
ba
|
0
sqft
|
built
1980
519 Bradford Dr, Brandon, MS 39047
$210
Cash flow
4.7%
Cash-on-Cash Return
6.8%
Cap rate
0.9%
Rent to Value Ratio
Active
$299,999
3
bds
|
2
ba
|
0
sqft
|
built
2010
305 Flagstone Dr, Brandon, MS 39042
$-33
Cash flow
-0.6%
Cash-on-Cash Return
5.5%
Cap rate
0.8%
Rent to Value Ratio
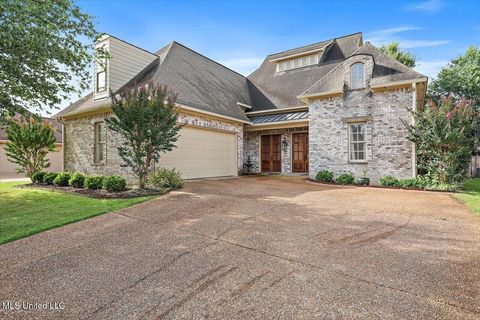
Active
$335,000
4
bds
|
3
ba
|
0
sqft
|
built
2002
449 Abbey Woods, Brandon, MS 39047
$-112
Cash flow
-1.7%
Cash-on-Cash Return
5.8%
Cap rate
0.8%
Rent to Value Ratio
Active
$227,000
3
bds
|
2
ba
|
0
sqft
|
built
1997
594 Acorn Ln, Brandon, MS 39047
$134
Cash flow
3.1%
Cash-on-Cash Return
6.4%
Cap rate
0.9%
Rent to Value Ratio

Active
$385,000
4
bds
|
3
ba
|
0
sqft
|
built
2019
263 Ironwood Pl, Brandon, MS 39042
$90
Cash flow
1.2%
Cash-on-Cash Return
6.0%
Cap rate
0.8%
Rent to Value Ratio
Active
$239,000
3
bds
|
2
ba
|
0
sqft
|
built
1980
132 Bent Creek Dr, Brandon, MS 39047
$159
Cash flow
3.5%
Cash-on-Cash Return
6.5%
Cap rate
0.8%
Rent to Value Ratio
Active
$214,900
2
bds
|
2
ba
|
0
sqft
|
built
2002
107 Stone Castle Ct, Brandon, MS 39047
$13
Cash flow
0.3%
Cash-on-Cash Return
6.3%
Cap rate
0.8%
Rent to Value Ratio

Active
$265,000
3
bds
|
2
ba
|
0
sqft
|
built
2007
508 Oakleigh Pl, Brandon, MS 39047
$119
Cash flow
2.3%
Cash-on-Cash Return
6.2%
Cap rate
0.8%
Rent to Value Ratio
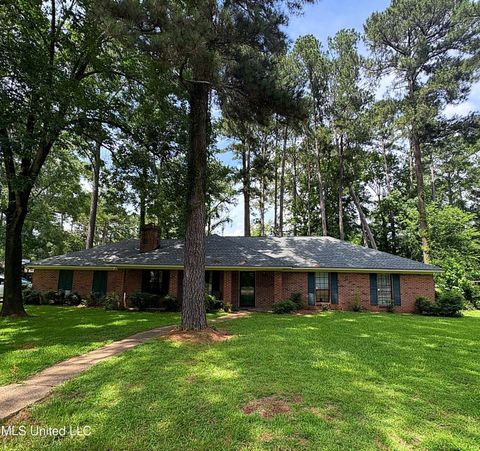
Active
$249,950
3
bds
|
2
ba
|
0
sqft
|
built
1974
106 Woodcliff Pl, Brandon, MS 39042
$207
Cash flow
4.3%
Cash-on-Cash Return
6.7%
Cap rate
0.9%
Rent to Value Ratio
Active
$360,000
3
bds
|
2
ba
|
0
sqft
|
built
2017
1112 Belle Oak Row, Brandon, MS 39042
$-25
Cash flow
-0.4%
Cash-on-Cash Return
5.6%
Cap rate
0.8%
Rent to Value Ratio
Active
$700,000
5
bds
|
4
ba
|
0
sqft
|
built
2009
103 Bella Vista Dr, Brandon, MS 39042
$-712
Cash flow
-5.3%
Cash-on-Cash Return
4.5%
Cap rate
0.6%
Rent to Value Ratio
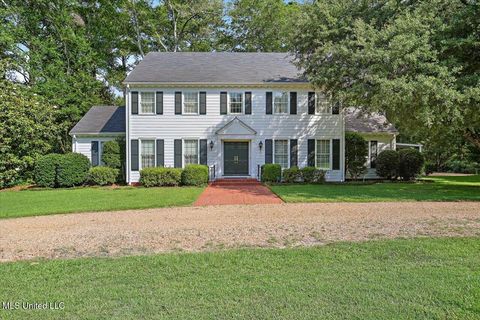
Active
$475,000
4
bds
|
3
ba
|
0
sqft
|
built
1983
119 Easthaven Dr, Brandon, MS 39042
$-61
Cash flow
-0.7%
Cash-on-Cash Return
5.5%
Cap rate
0.7%
Rent to Value Ratio
Active
$304,000
3
bds
|
2
ba
|
0
sqft
|
built
1998
1007 Riverchase North Dr, Brandon, MS 39047
$-191
Cash flow
-3.3%
Cash-on-Cash Return
5.5%
Cap rate
0.7%
Rent to Value Ratio
Active
$315,000
4
bds
|
2
ba
|
0
sqft
|
built
1987
320 Woodhollow Cv, Brandon, MS 39047
$45
Cash flow
0.7%
Cash-on-Cash Return
5.9%
Cap rate
0.8%
Rent to Value Ratio

Active
$245,000
3
bds
|
2
ba
|
0
sqft
|
built
2005
302 Bedford Ct, Brandon, MS 39047
$93
Cash flow
2.0%
Cash-on-Cash Return
6.1%
Cap rate
0.8%
Rent to Value Ratio
Active
$265,000
3
bds
|
2
ba
|
0
sqft
|
built
2011
104 Greenfield Ridge Dr, Brandon, MS 39042
$63
Cash flow
1.2%
Cash-on-Cash Return
6.0%
Cap rate
0.8%
Rent to Value Ratio
Active
$332,000
3
bds
|
3
ba
|
0
sqft
|
built
1979
177 Robbins Rd, Brandon, MS 39042
$-158
Cash flow
-2.5%
Cash-on-Cash Return
5.1%
Cap rate
0.7%
Rent to Value Ratio

Active
$440,000
4
bds
|
4
ba
|
0
sqft
|
built
1993
139 Woodlands Green Dr, Brandon, MS 39047
$140
Cash flow
1.7%
Cash-on-Cash Return
6.1%
Cap rate
0.8%
Rent to Value Ratio

Active
$349,900
4
bds
|
2
ba
|
0
sqft
|
built
2003
230 Lighthouse Ln, Brandon, MS 39047
$41
Cash flow
0.6%
Cash-on-Cash Return
5.8%
Cap rate
0.8%
Rent to Value Ratio
Active
$344,000
3
bds
|
2
ba
|
0
sqft
|
built
2014
272 Hidden Hills Pkwy, Brandon, MS 39047
$113
Cash flow
1.7%
Cash-on-Cash Return
6.1%
Cap rate
0.8%
Rent to Value Ratio
Active
$526,000
4
bds
|
4
ba
|
0
sqft
|
built
2018
508 Forest Glen Ln, Brandon, MS 39047
$21
Cash flow
0.2%
Cash-on-Cash Return
5.7%
Cap rate
0.8%
Rent to Value Ratio
Active
$572,000
5
bds
|
4
ba
|
0
sqft
|
built
2006
209 Oakville Cir, Brandon, MS 39047
$-583
Cash flow
-5.3%
Cash-on-Cash Return
4.5%
Cap rate
0.6%
Rent to Value Ratio
Active
$250,000
3
bds
|
2
ba
|
0
sqft
|
built
1980
101 Dogwood Cir, Brandon, MS 39047
$98
Cash flow
2.0%
Cash-on-Cash Return
6.1%
Cap rate
0.8%
Rent to Value Ratio
Active
$644,500
5
bds
|
6
ba
|
0
sqft
|
built
1968
350 Whitfield Rd, Brandon, MS 39042
$-1,273
Cash flow
-10.3%
Cash-on-Cash Return
3.9%
Cap rate
0.5%
Rent to Value Ratio
Active
$1,350,000
4
bds
|
5
ba
|
0
sqft
|
built
1994
169 Pine Hill Dr, Brandon, MS 39047
$-4,237
Cash flow
-16.4%
Cash-on-Cash Return
1.9%
Cap rate
0.3%
Rent to Value Ratio

Active
$399,000
3
bds
|
3
ba
|
0
sqft
|
built
1983
110 Stonington Ct, Brandon, MS 39047
$83
Cash flow
1.1%
Cash-on-Cash Return
5.9%
Cap rate
0.8%
Rent to Value Ratio
Active
$234,900
3
bds
|
2
ba
|
0
sqft
|
built
1973
105 Poplar Dr, Brandon, MS 39047
$48
Cash flow
1.1%
Cash-on-Cash Return
5.9%
Cap rate
0.9%
Rent to Value Ratio
Active
$699,000
4
bds
|
5
ba
|
0
sqft
|
built
2007
113 Hastings Ave, Brandon, MS 39042
$-1,290
Cash flow
-9.6%
Cash-on-Cash Return
3.5%
Cap rate
0.5%
Rent to Value Ratio
Active
$399,900
4
bds
|
3
ba
|
0
sqft
|
built
2021
625 Wild Horse Ln, Brandon, MS 39042
$-184
Cash flow
-2.4%
Cash-on-Cash Return
5.1%
Cap rate
0.7%
Rent to Value Ratio

Active
$250,000
2
bds
|
2
ba
|
0
sqft
|
built
2001
420 Stoneybrook Dr, Brandon, MS 39042
$66
Cash flow
1.4%
Cash-on-Cash Return
6.0%
Cap rate
0.8%
Rent to Value Ratio

Active
$340,000
3
bds
|
2
ba
|
0
sqft
|
built
1992
506 Ridge Cir, Brandon, MS 39047
$-28
Cash flow
-0.4%
Cash-on-Cash Return
5.6%
Cap rate
0.8%
Rent to Value Ratio

Active
$389,000
5
bds
|
4
ba
|
0
sqft
|
built
1989
110 Hawks Nest Cv, Brandon, MS 39042
$52
Cash flow
0.7%
Cash-on-Cash Return
5.8%
Cap rate
0.7%
Rent to Value Ratio

Active
$319,900
3
bds
|
2
ba
|
0
sqft
|
built
2006
537 Turtle Ln, Brandon, MS 39047
$121
Cash flow
2.0%
Cash-on-Cash Return
6.1%
Cap rate
0.9%
Rent to Value Ratio