Brandon, MS Investment Properties for Sale
Browse homes for sale and investment properties in Brandon, MS. Refine your search by price, property type, or more.
Best cash flowing properties in Brandon, MS
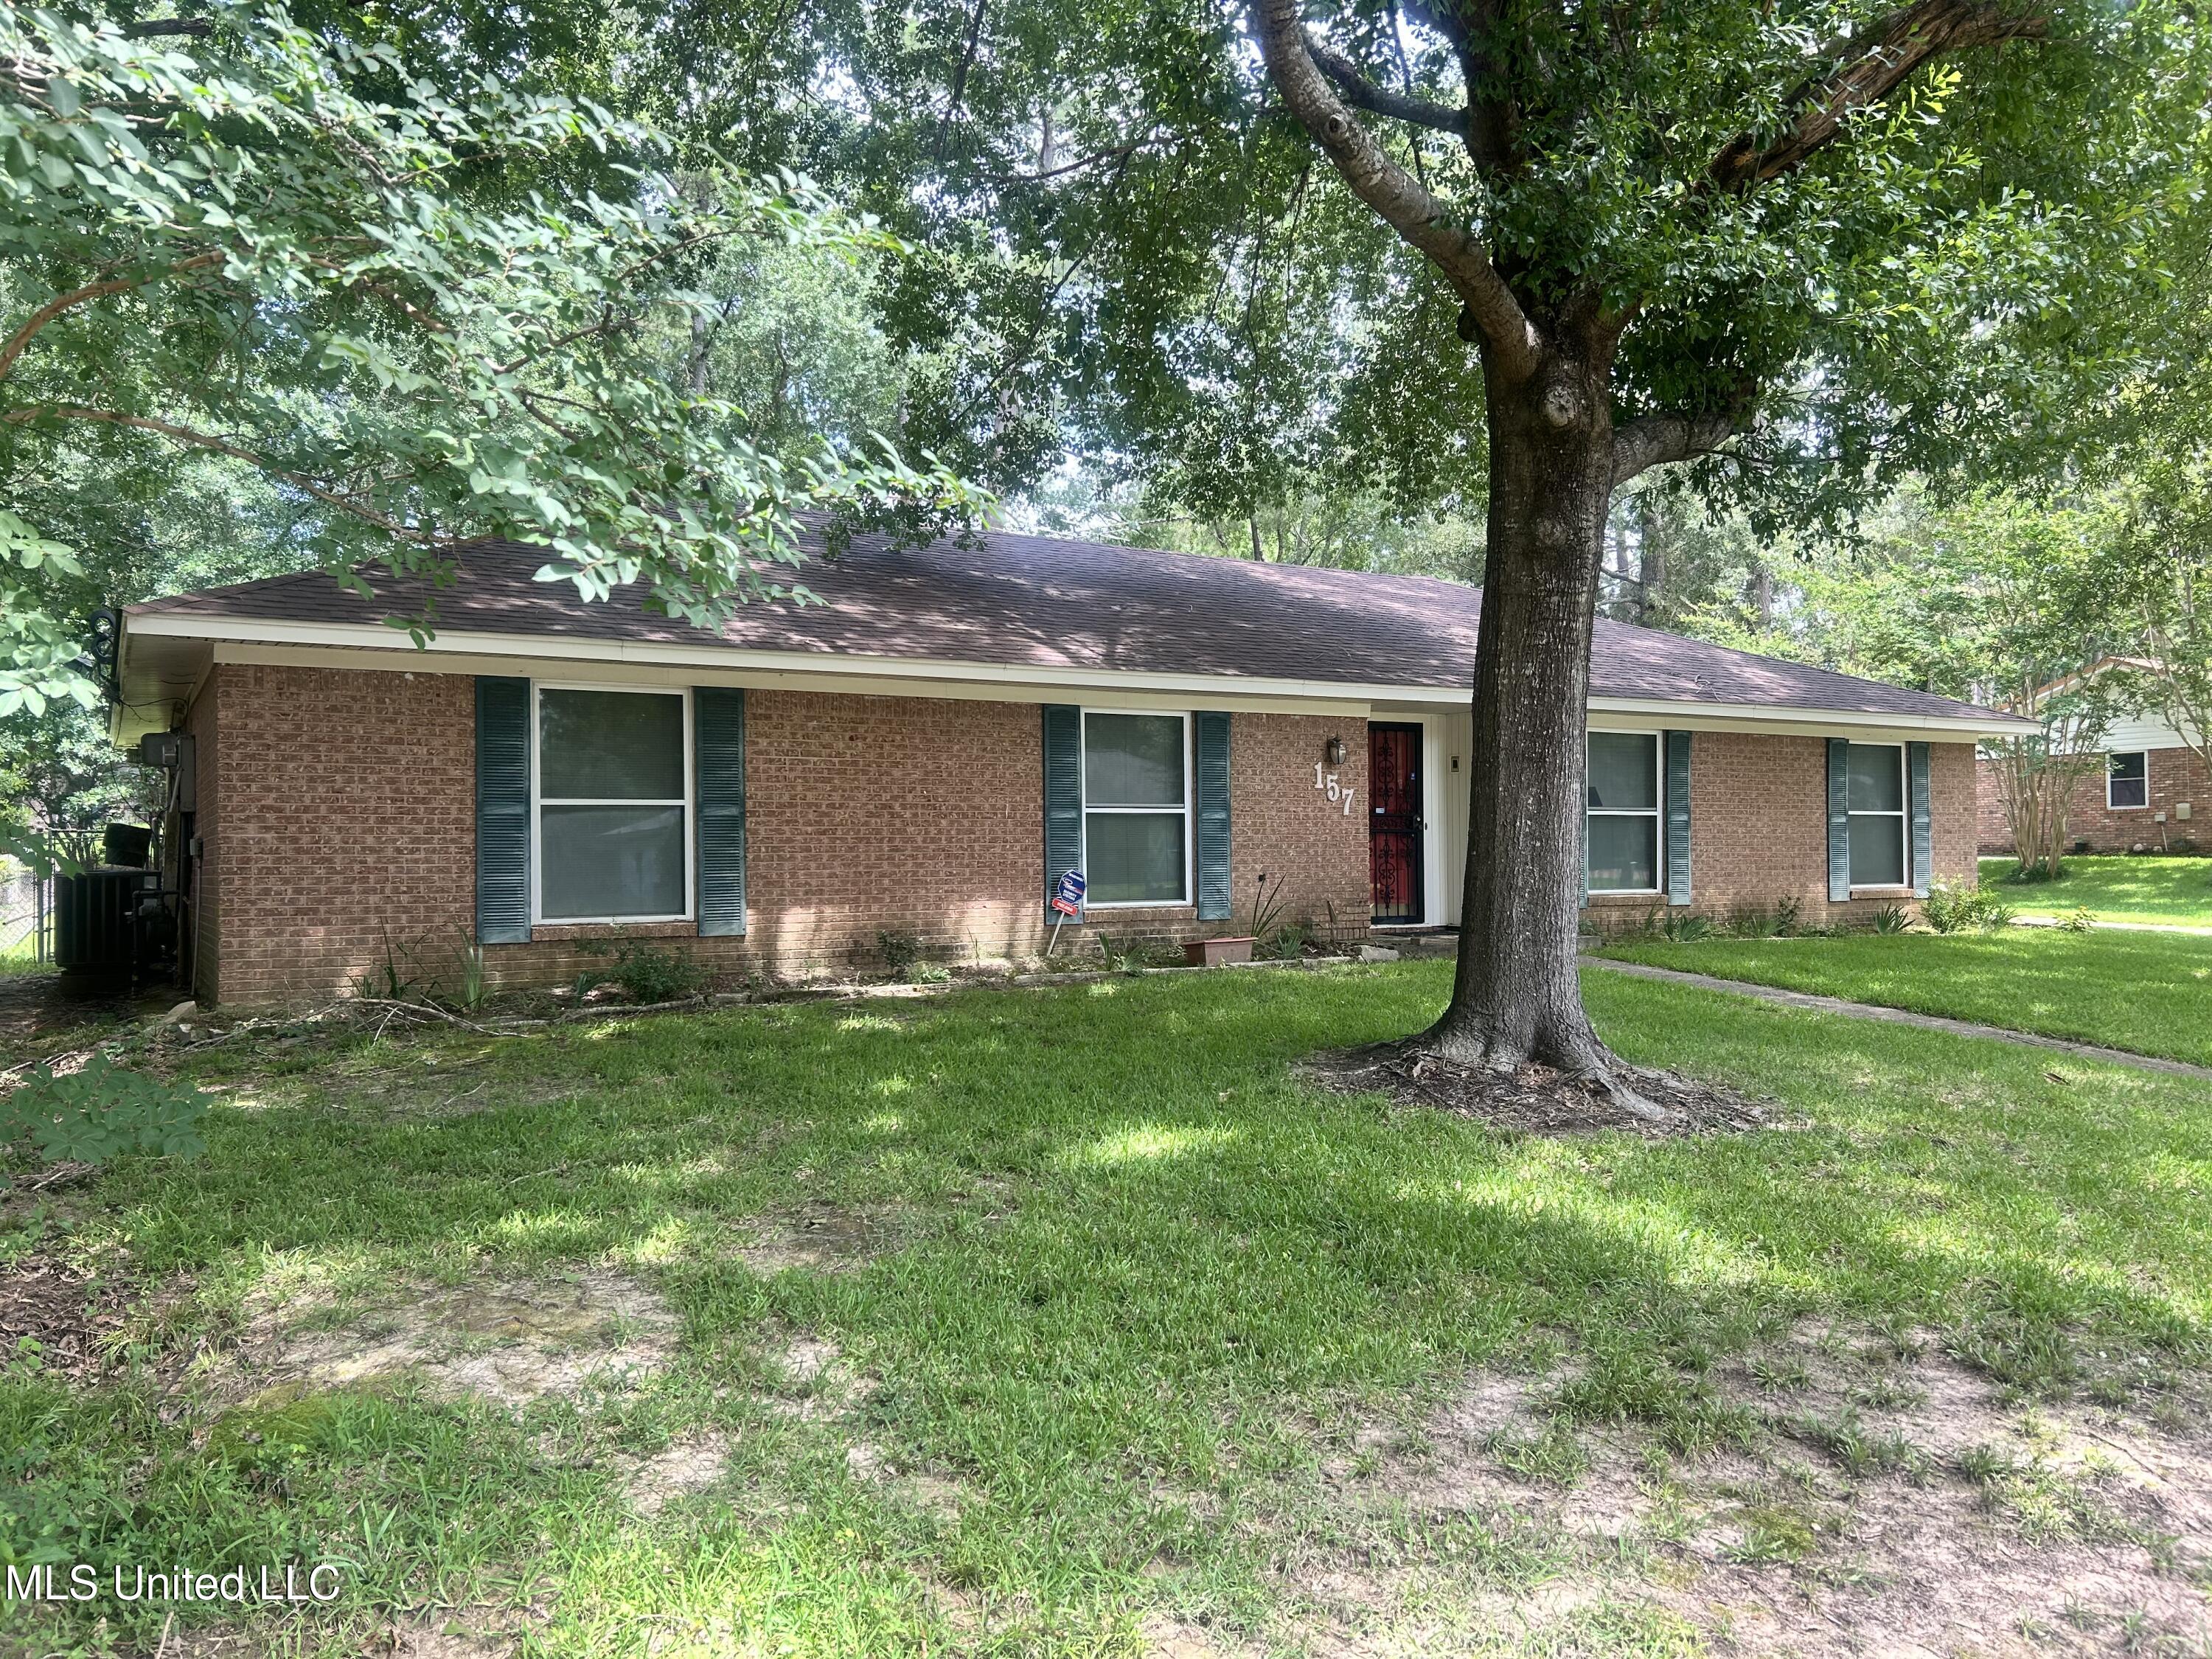
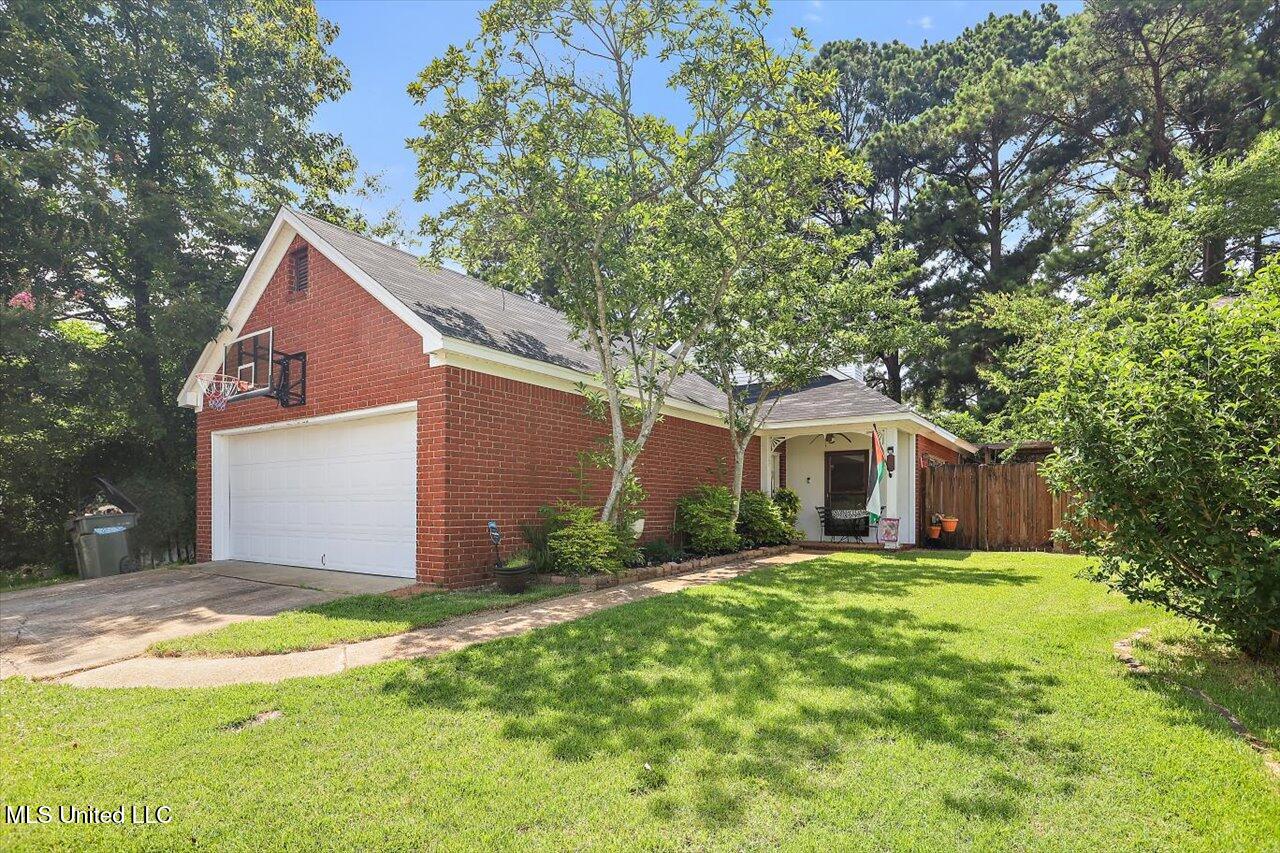
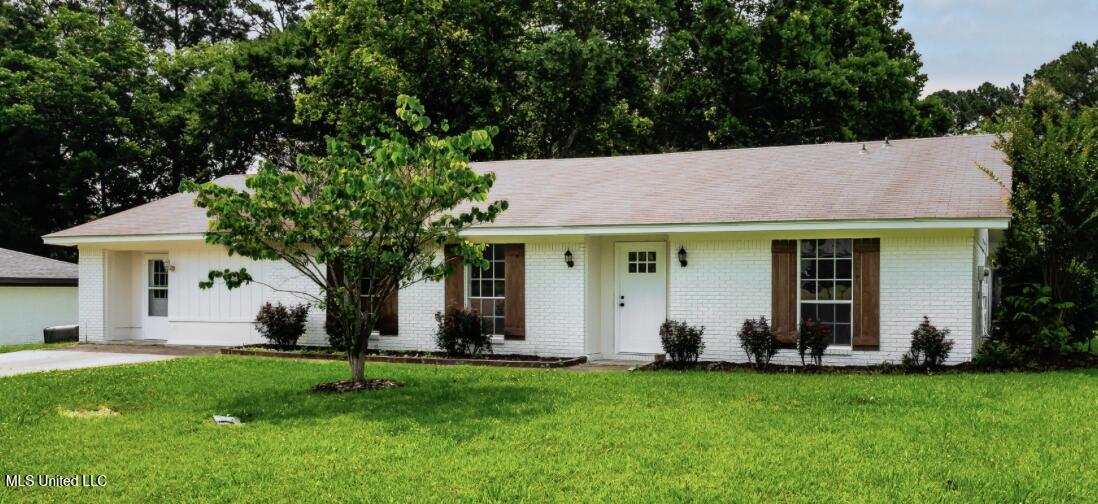
Pending
$212,000
3
bds
|
2
ba
|
0
sqft
|
built
1974
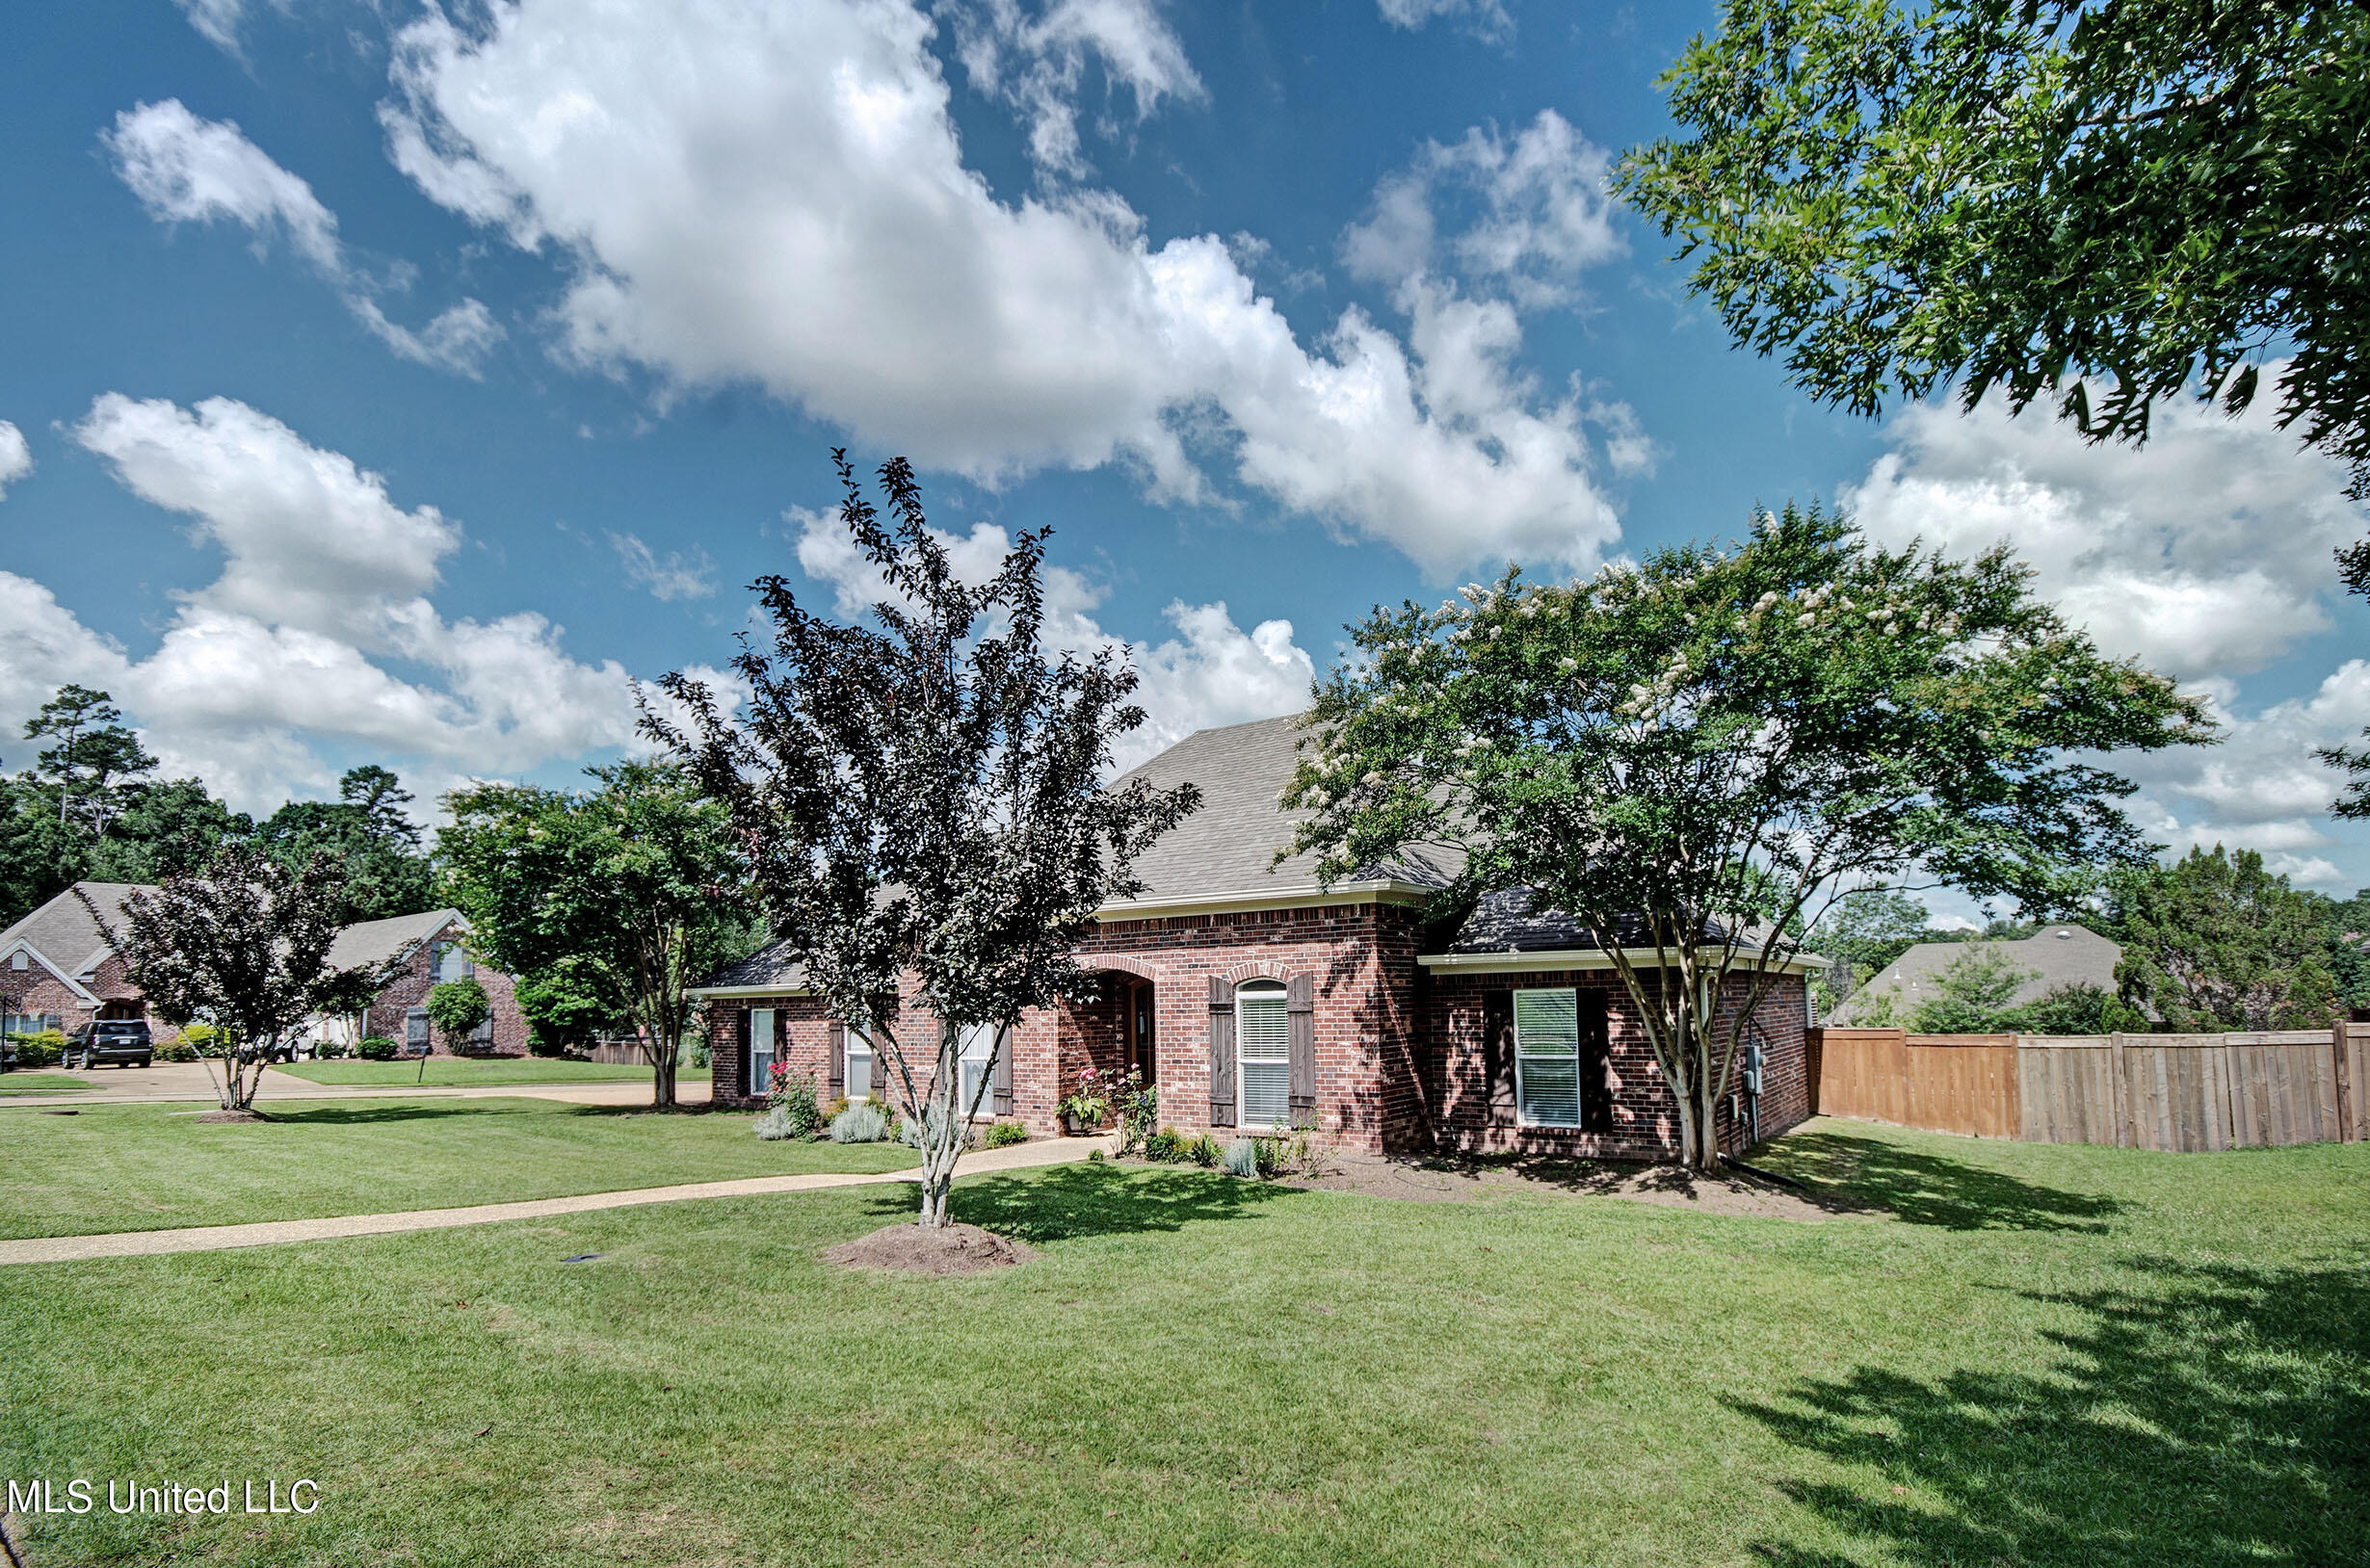
157 Fern Valley Rd, Brandon, MS 39042
$444
Cash flow
10.9%
Cash-on-Cash Return
8.2%
Cap rate
1.0%
Rent to Value Ratio
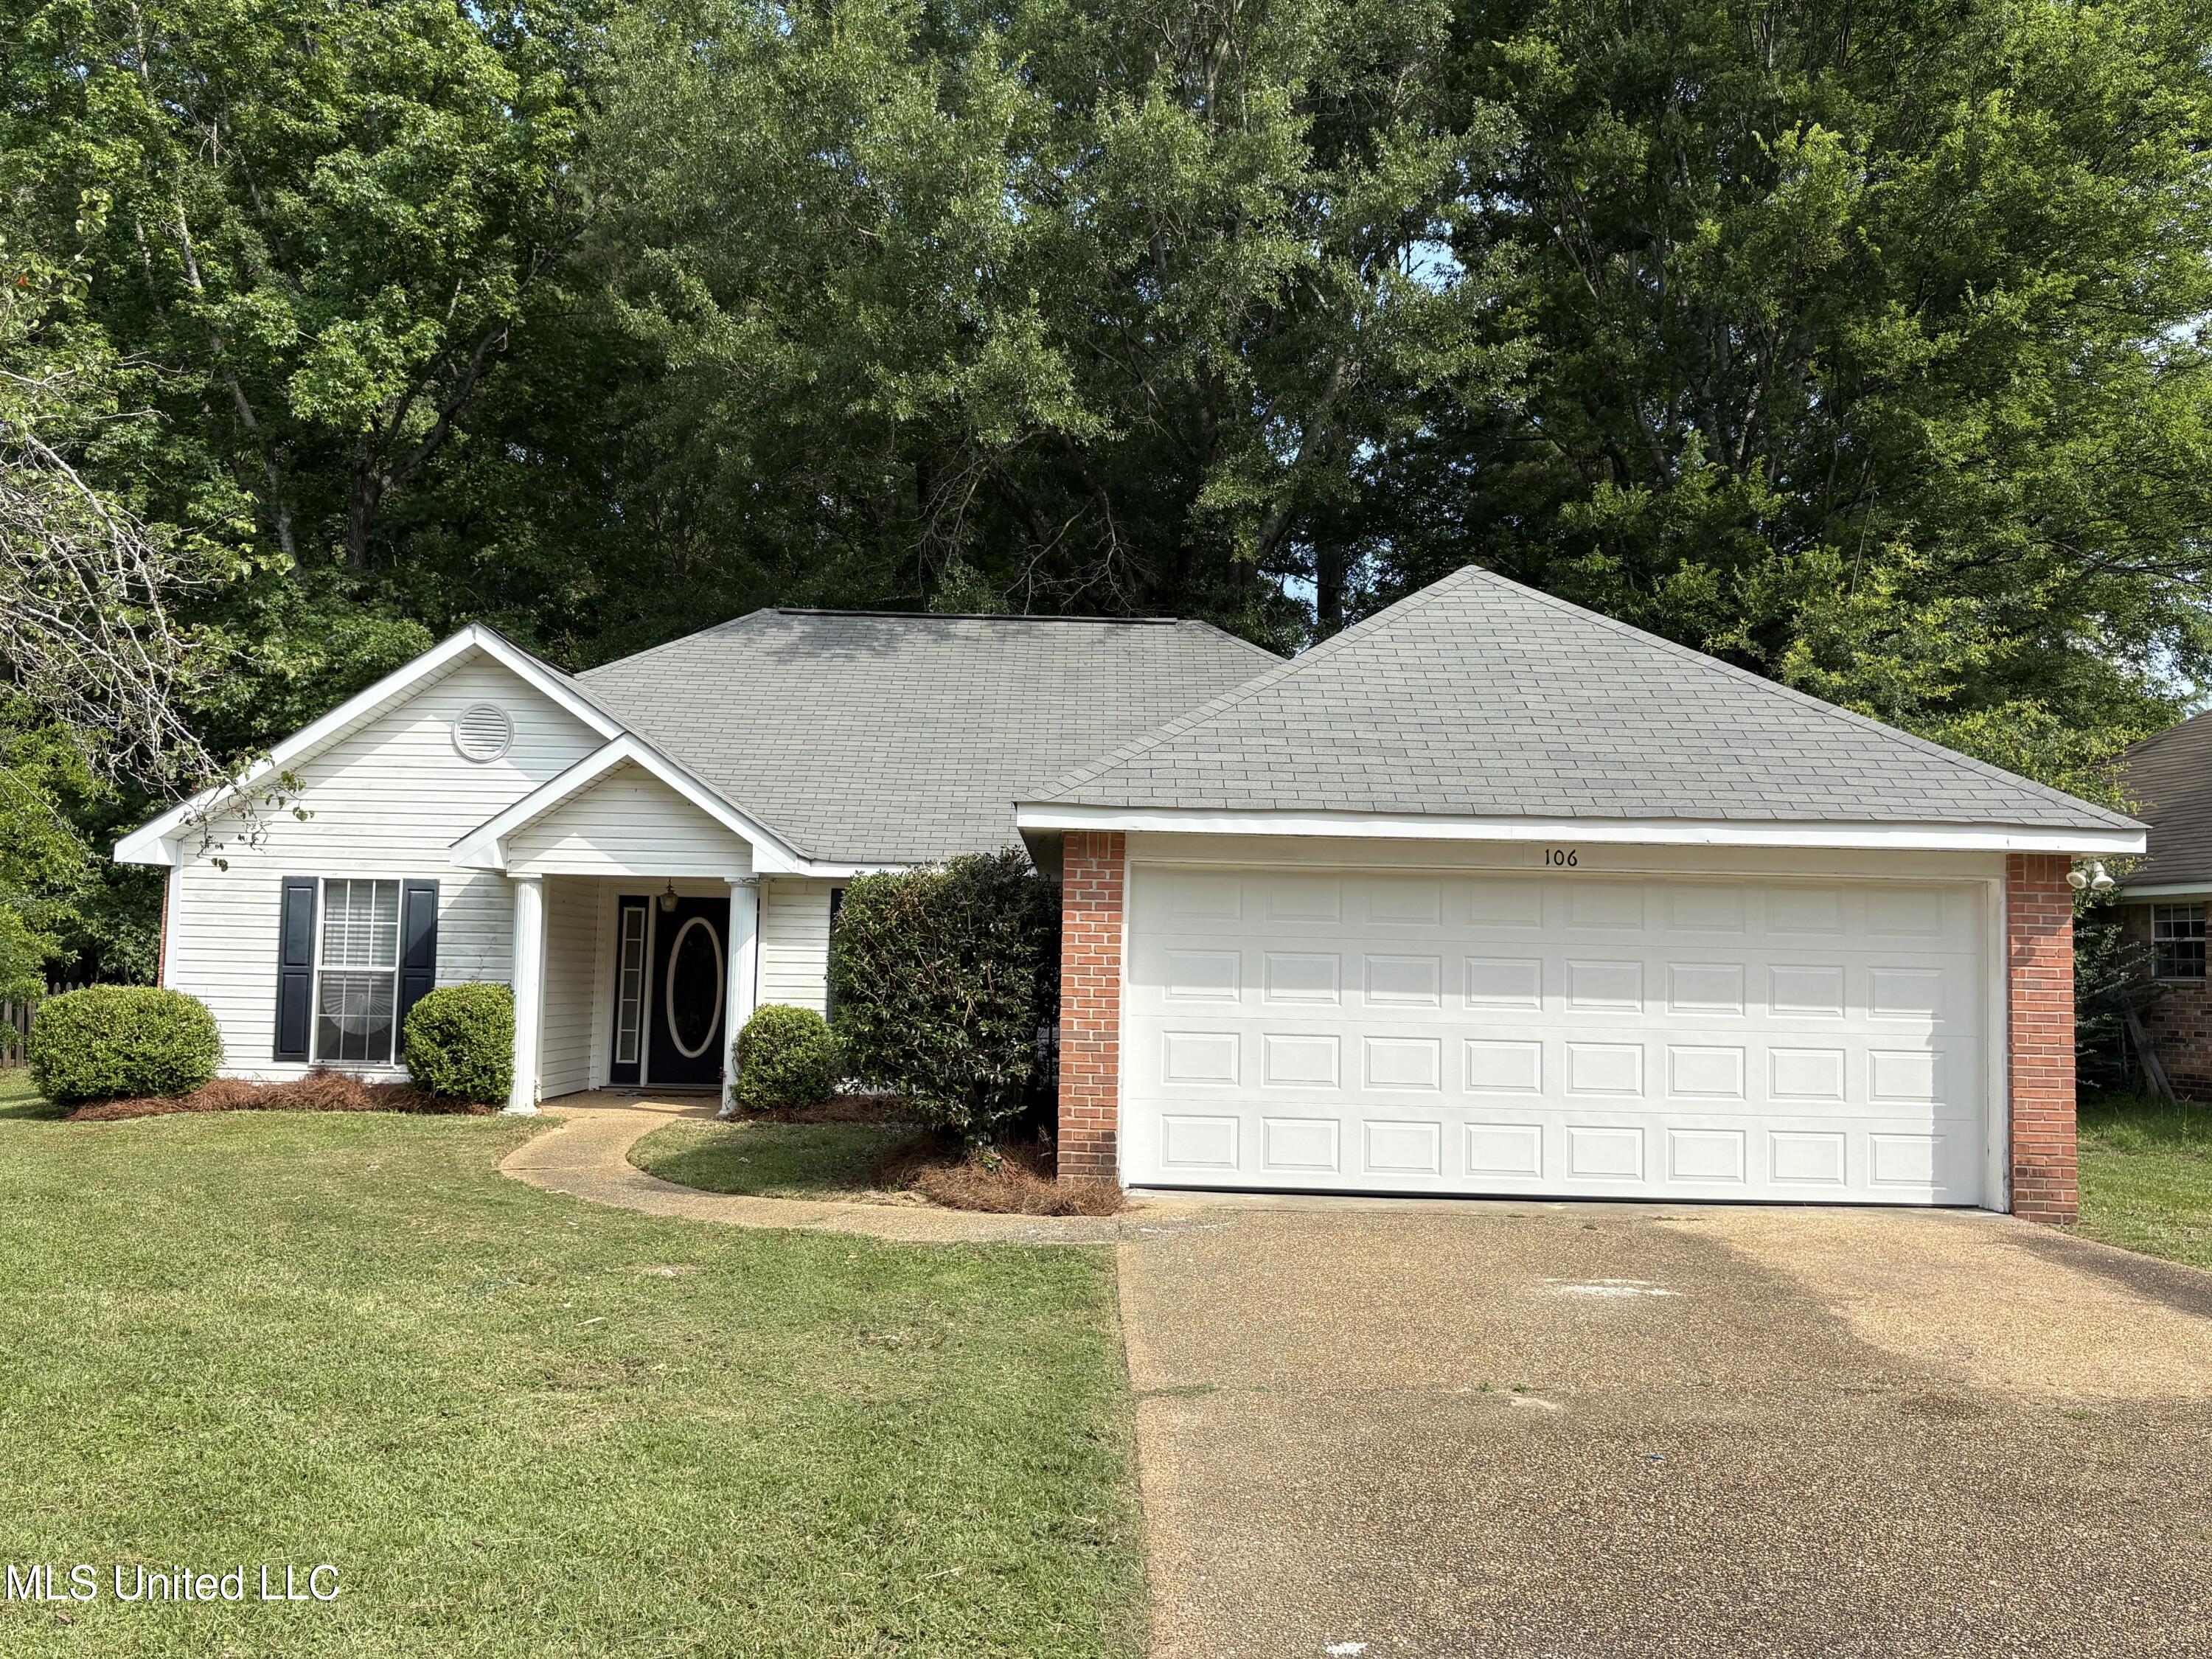
Active
$259,999
3
bds
|
2
ba
|
0
sqft
|
built
1994
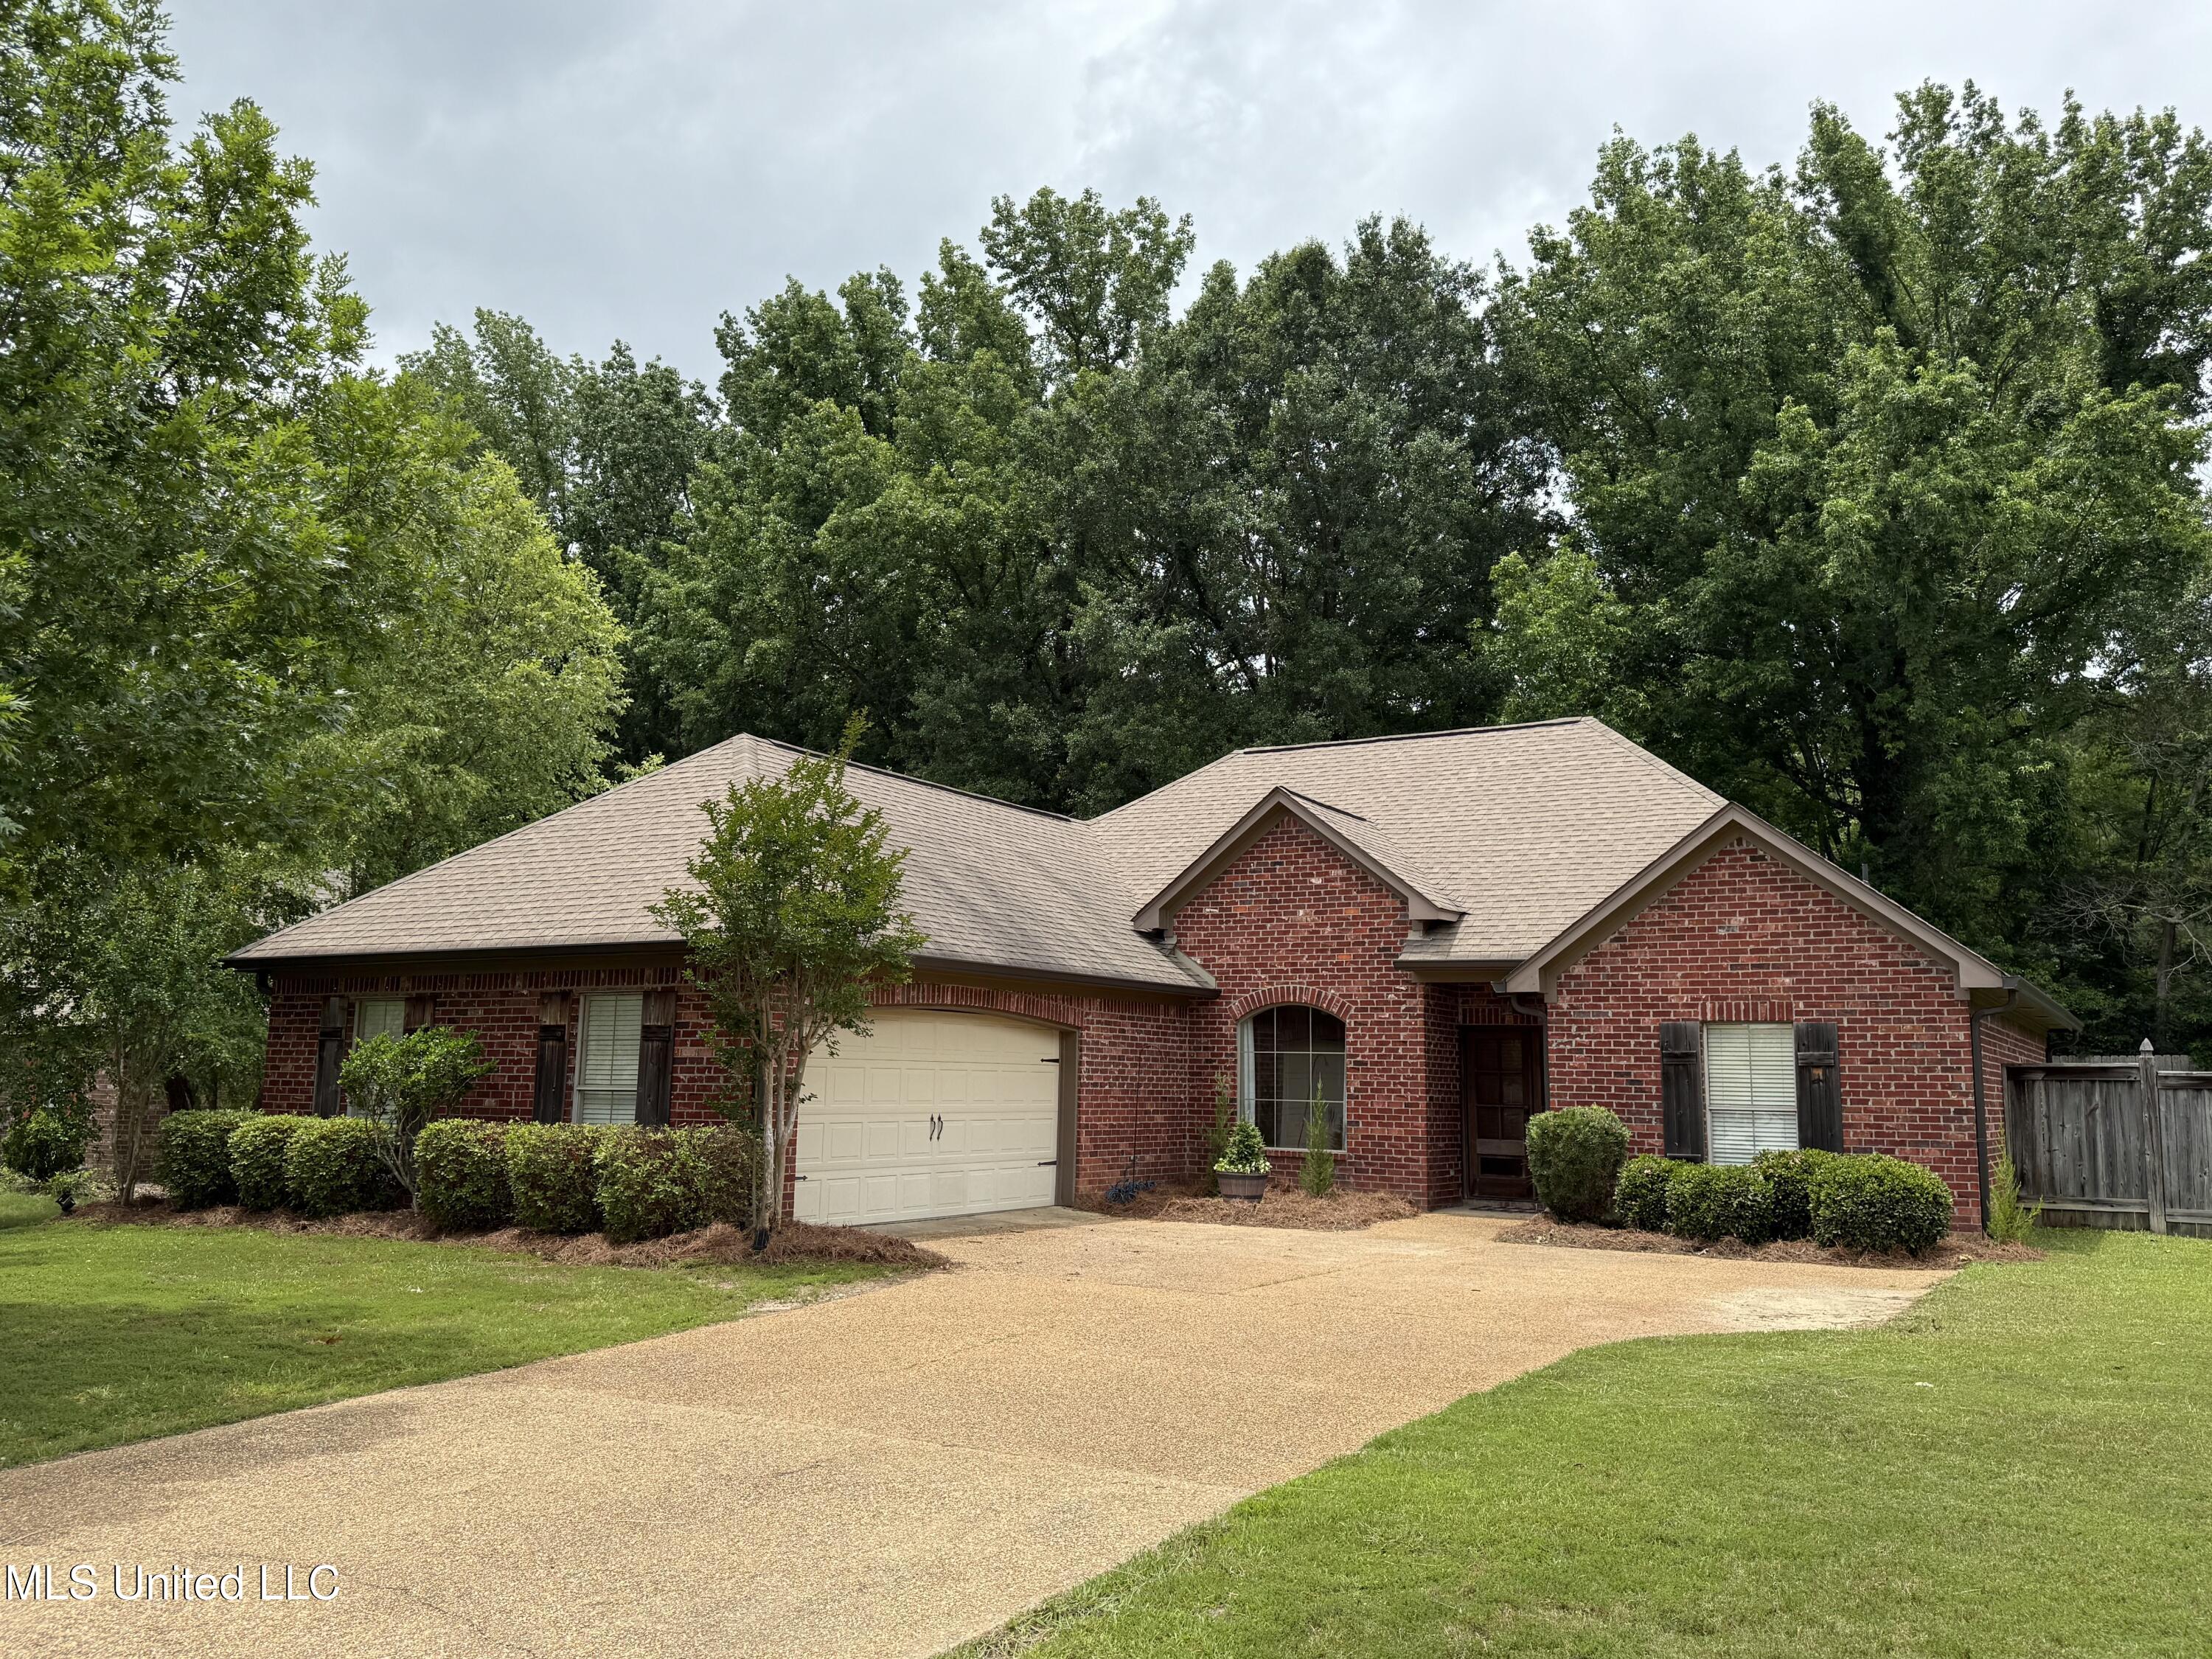
106 Ole Duke Dr, Brandon, MS 39042
$385
Cash flow
7.7%
Cash-on-Cash Return
7.5%
Cap rate
0.9%
Rent to Value Ratio
197 out of 209 properties for sale in Brandon, MS
Limited Results Shown
Create a free account, or log in to reveal all property listings and enjoy the complete experience.
Active
$399,000
3
bds
|
3
ba
|
0
sqft
|
built
1983
110 Stonington Ct, Brandon, MS 39047
$83
Cash flow
1.1%
Cash-on-Cash Return
5.9%
Cap rate
0.8%
Rent to Value Ratio
Active
$250,000
2
bds
|
2
ba
|
0
sqft
|
built
2001
420 Stoneybrook Dr, Brandon, MS 39042
$66
Cash flow
1.4%
Cash-on-Cash Return
6.0%
Cap rate
0.8%
Rent to Value Ratio
Pending
$199,900
3
bds
|
2
ba
|
0
sqft
|
built
1991
309 Pelahatchie Shore Dr, Brandon, MS 39047
$286
Cash flow
7.5%
Cash-on-Cash Return
7.4%
Cap rate
1.0%
Rent to Value Ratio

Pending
$362,500
3
bds
|
3
ba
|
0
sqft
|
built
1993
568 Cliffview Dr, Brandon, MS 39047
$-81
Cash flow
-1.2%
Cash-on-Cash Return
5.4%
Cap rate
0.7%
Rent to Value Ratio
Active
$206,000
3
bds
|
3
ba
|
0
sqft
|
built
1976
108 Fairdale Pl, Brandon, MS 39042
$375
Cash flow
9.5%
Cash-on-Cash Return
7.9%
Cap rate
1.0%
Rent to Value Ratio
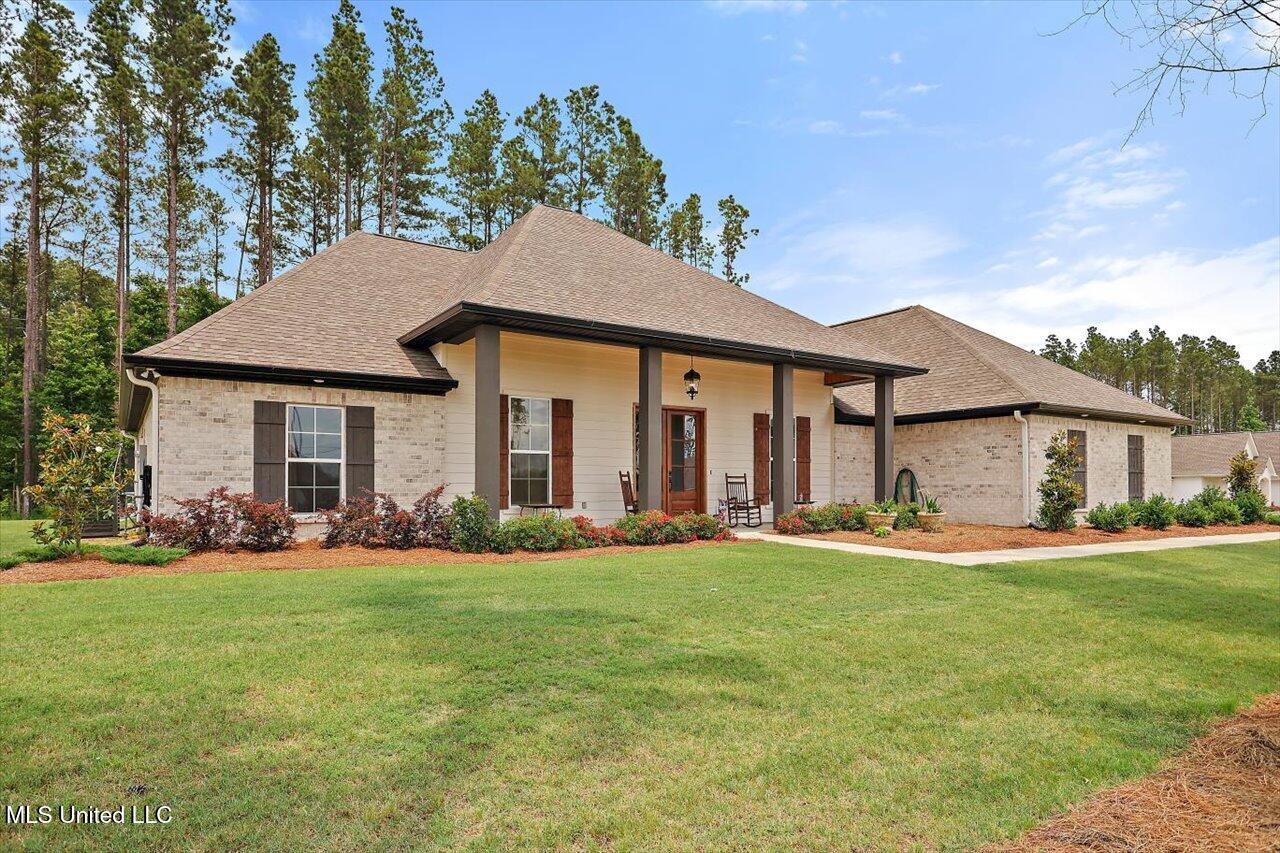
Pending
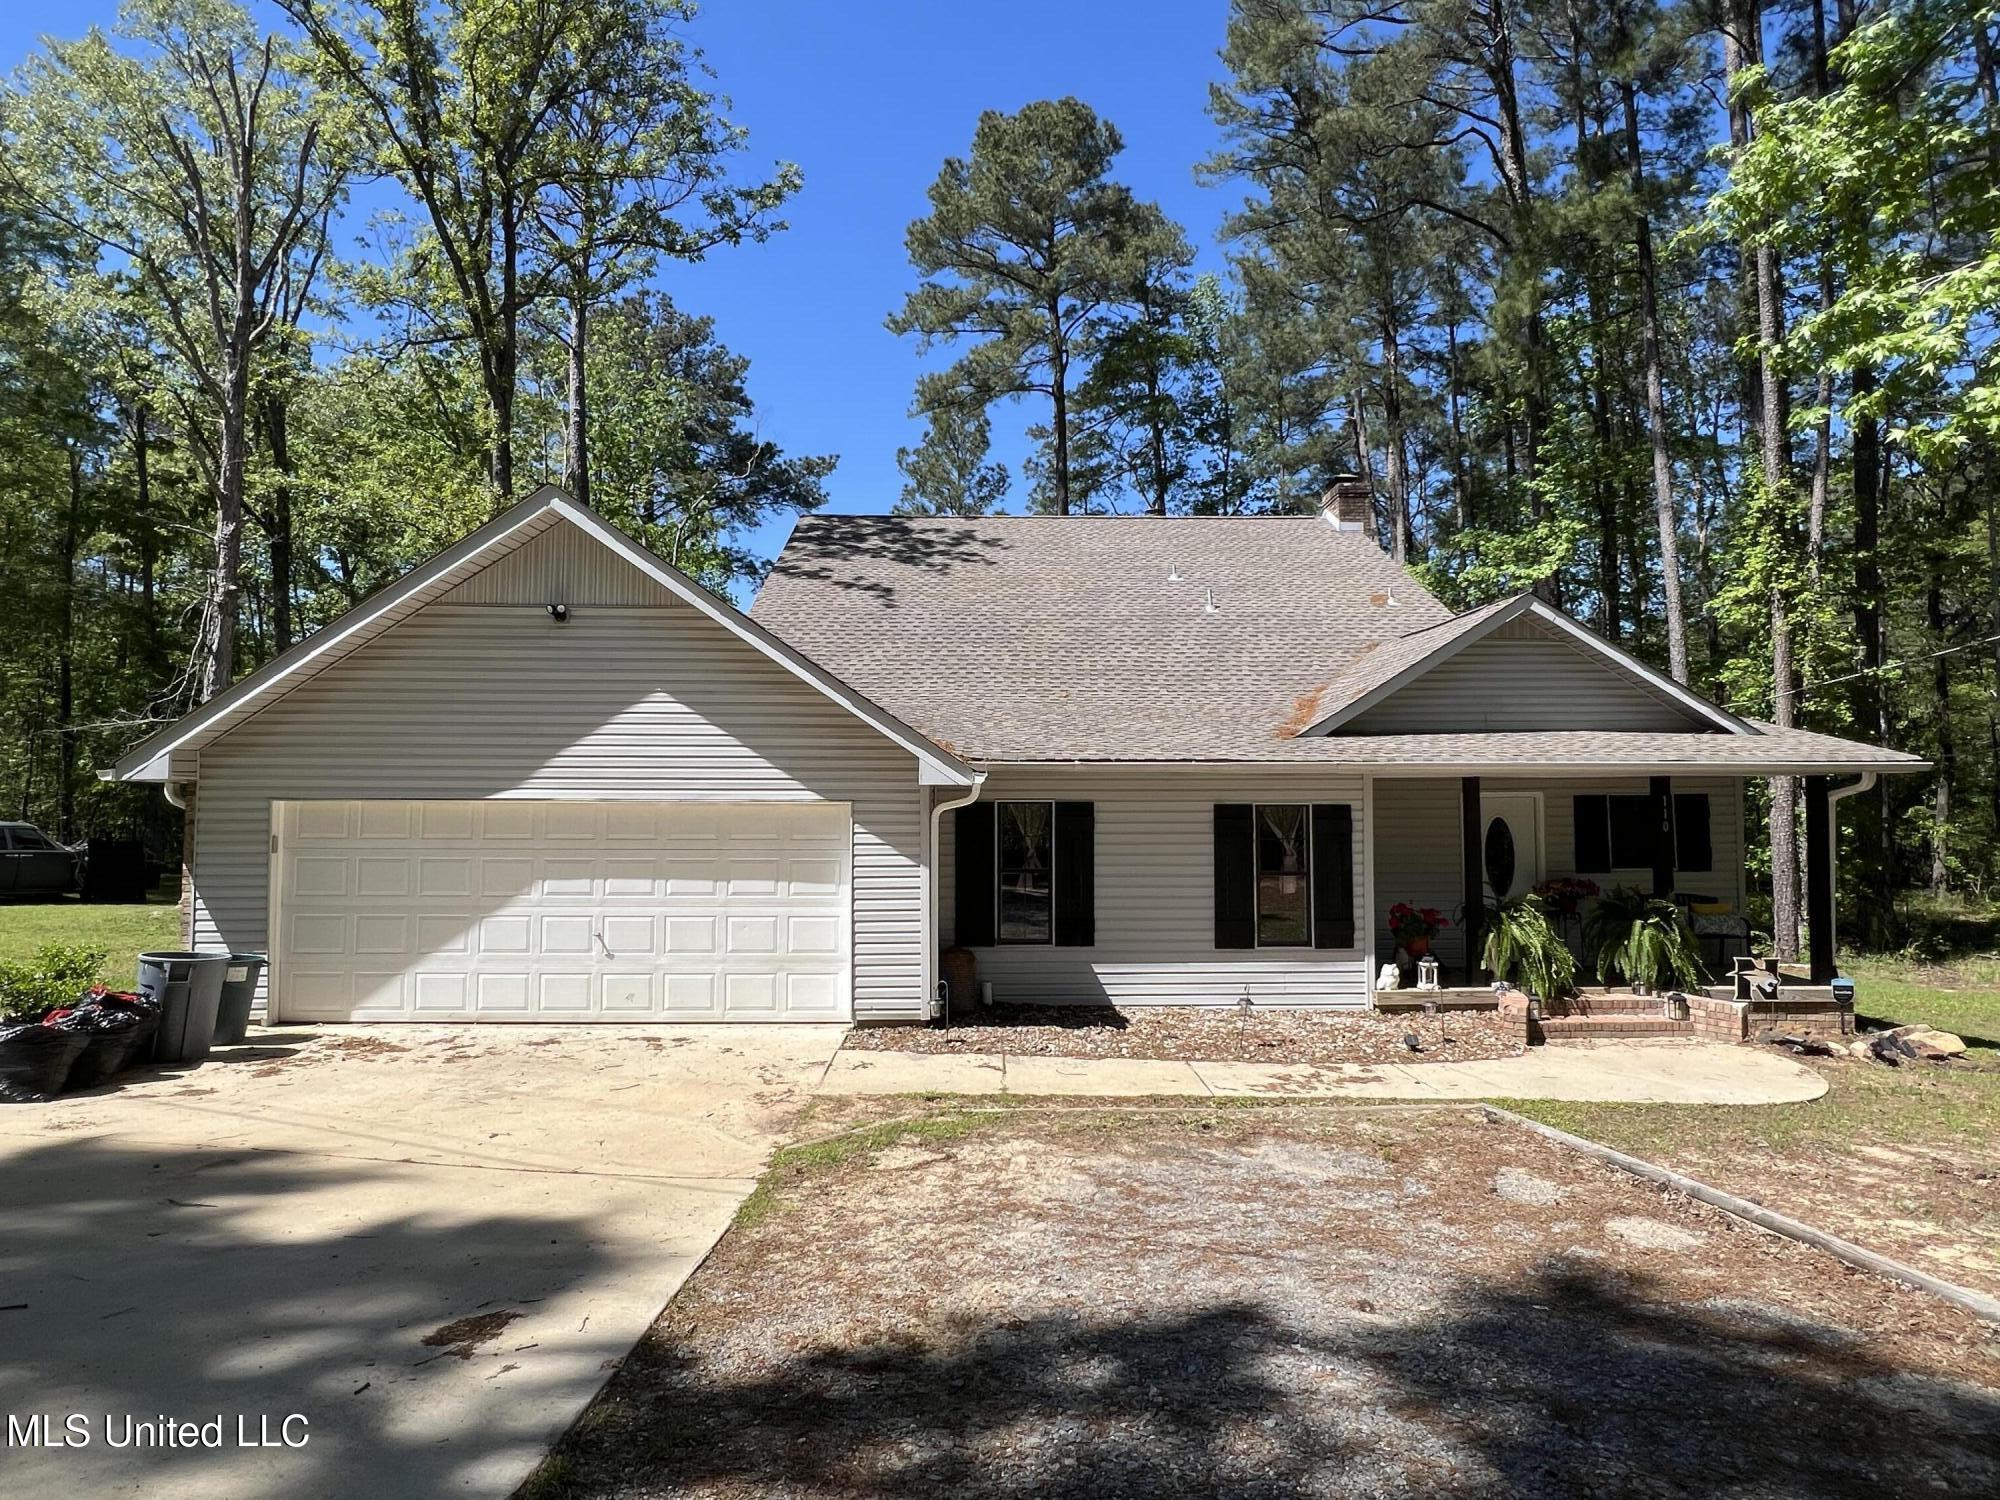
$212,000
3
bds
|
2
ba
|
0
sqft
|
built
1974
157 Fern Valley Rd, Brandon, MS 39042
$444
Cash flow
10.9%
Cash-on-Cash Return
8.2%
Cap rate
1.0%
Rent to Value Ratio
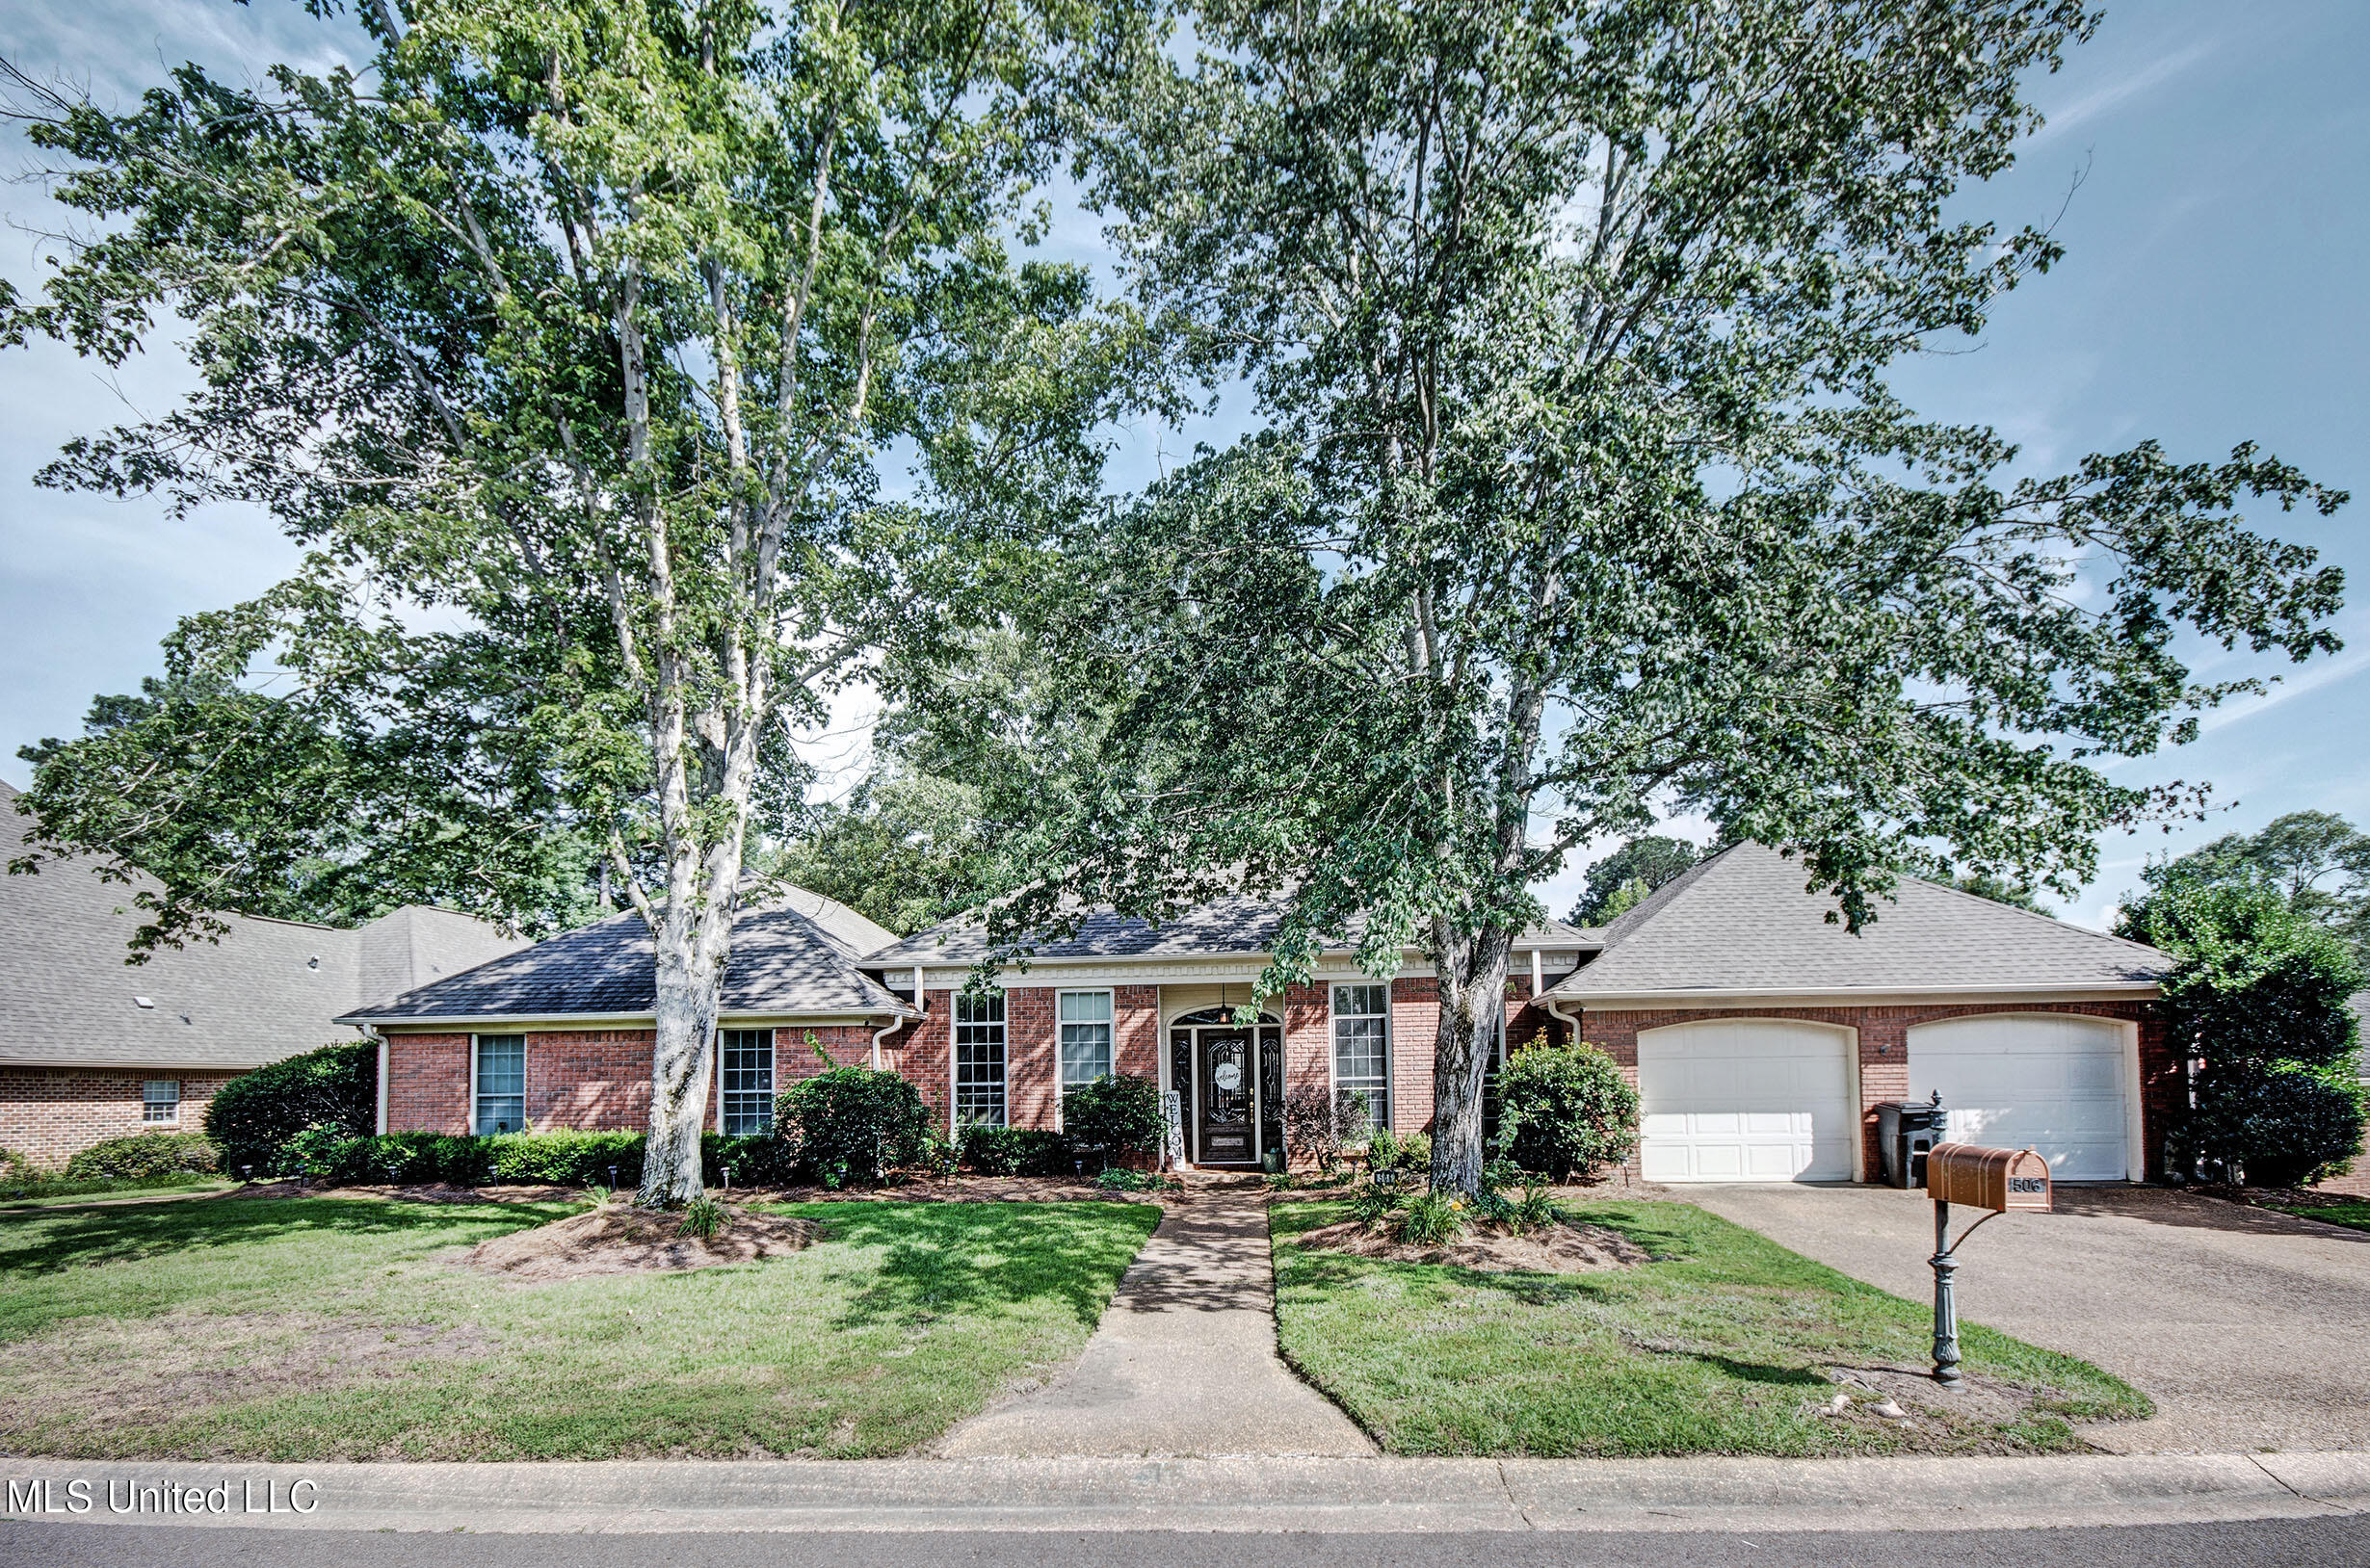
Active
$340,000
3
bds
|
2
ba
|
0
sqft
|
built
1992
506 Ridge Cir, Brandon, MS 39047
$-28
Cash flow
-0.4%
Cash-on-Cash Return
5.6%
Cap rate
0.8%
Rent to Value Ratio
Active
$289,900
3
bds
|
2
ba
|
0
sqft
|
built
2006
623 Chambord Dr, Brandon, MS 39042
$12
Cash flow
0.2%
Cash-on-Cash Return
5.7%
Cap rate
0.8%
Rent to Value Ratio
Active
$389,000
5
bds
|
4
ba
|
0
sqft
|
built
1989
110 Hawks Nest Cv, Brandon, MS 39042
$52
Cash flow
0.7%
Cash-on-Cash Return
5.8%
Cap rate
0.7%
Rent to Value Ratio
Active
$324,900
3
bds
|
2
ba
|
0
sqft
|
built
2006
537 Turtle Ln, Brandon, MS 39047
$97
Cash flow
1.6%
Cash-on-Cash Return
6.0%
Cap rate
0.9%
Rent to Value Ratio
Active
$699,900
5
bds
|
4
ba
|
0
sqft
|
built
1997
121 Poplar Ridge Dr, Brandon, MS 39047
$-1,107
Cash flow
-8.3%
Cash-on-Cash Return
3.8%
Cap rate
0.6%
Rent to Value Ratio
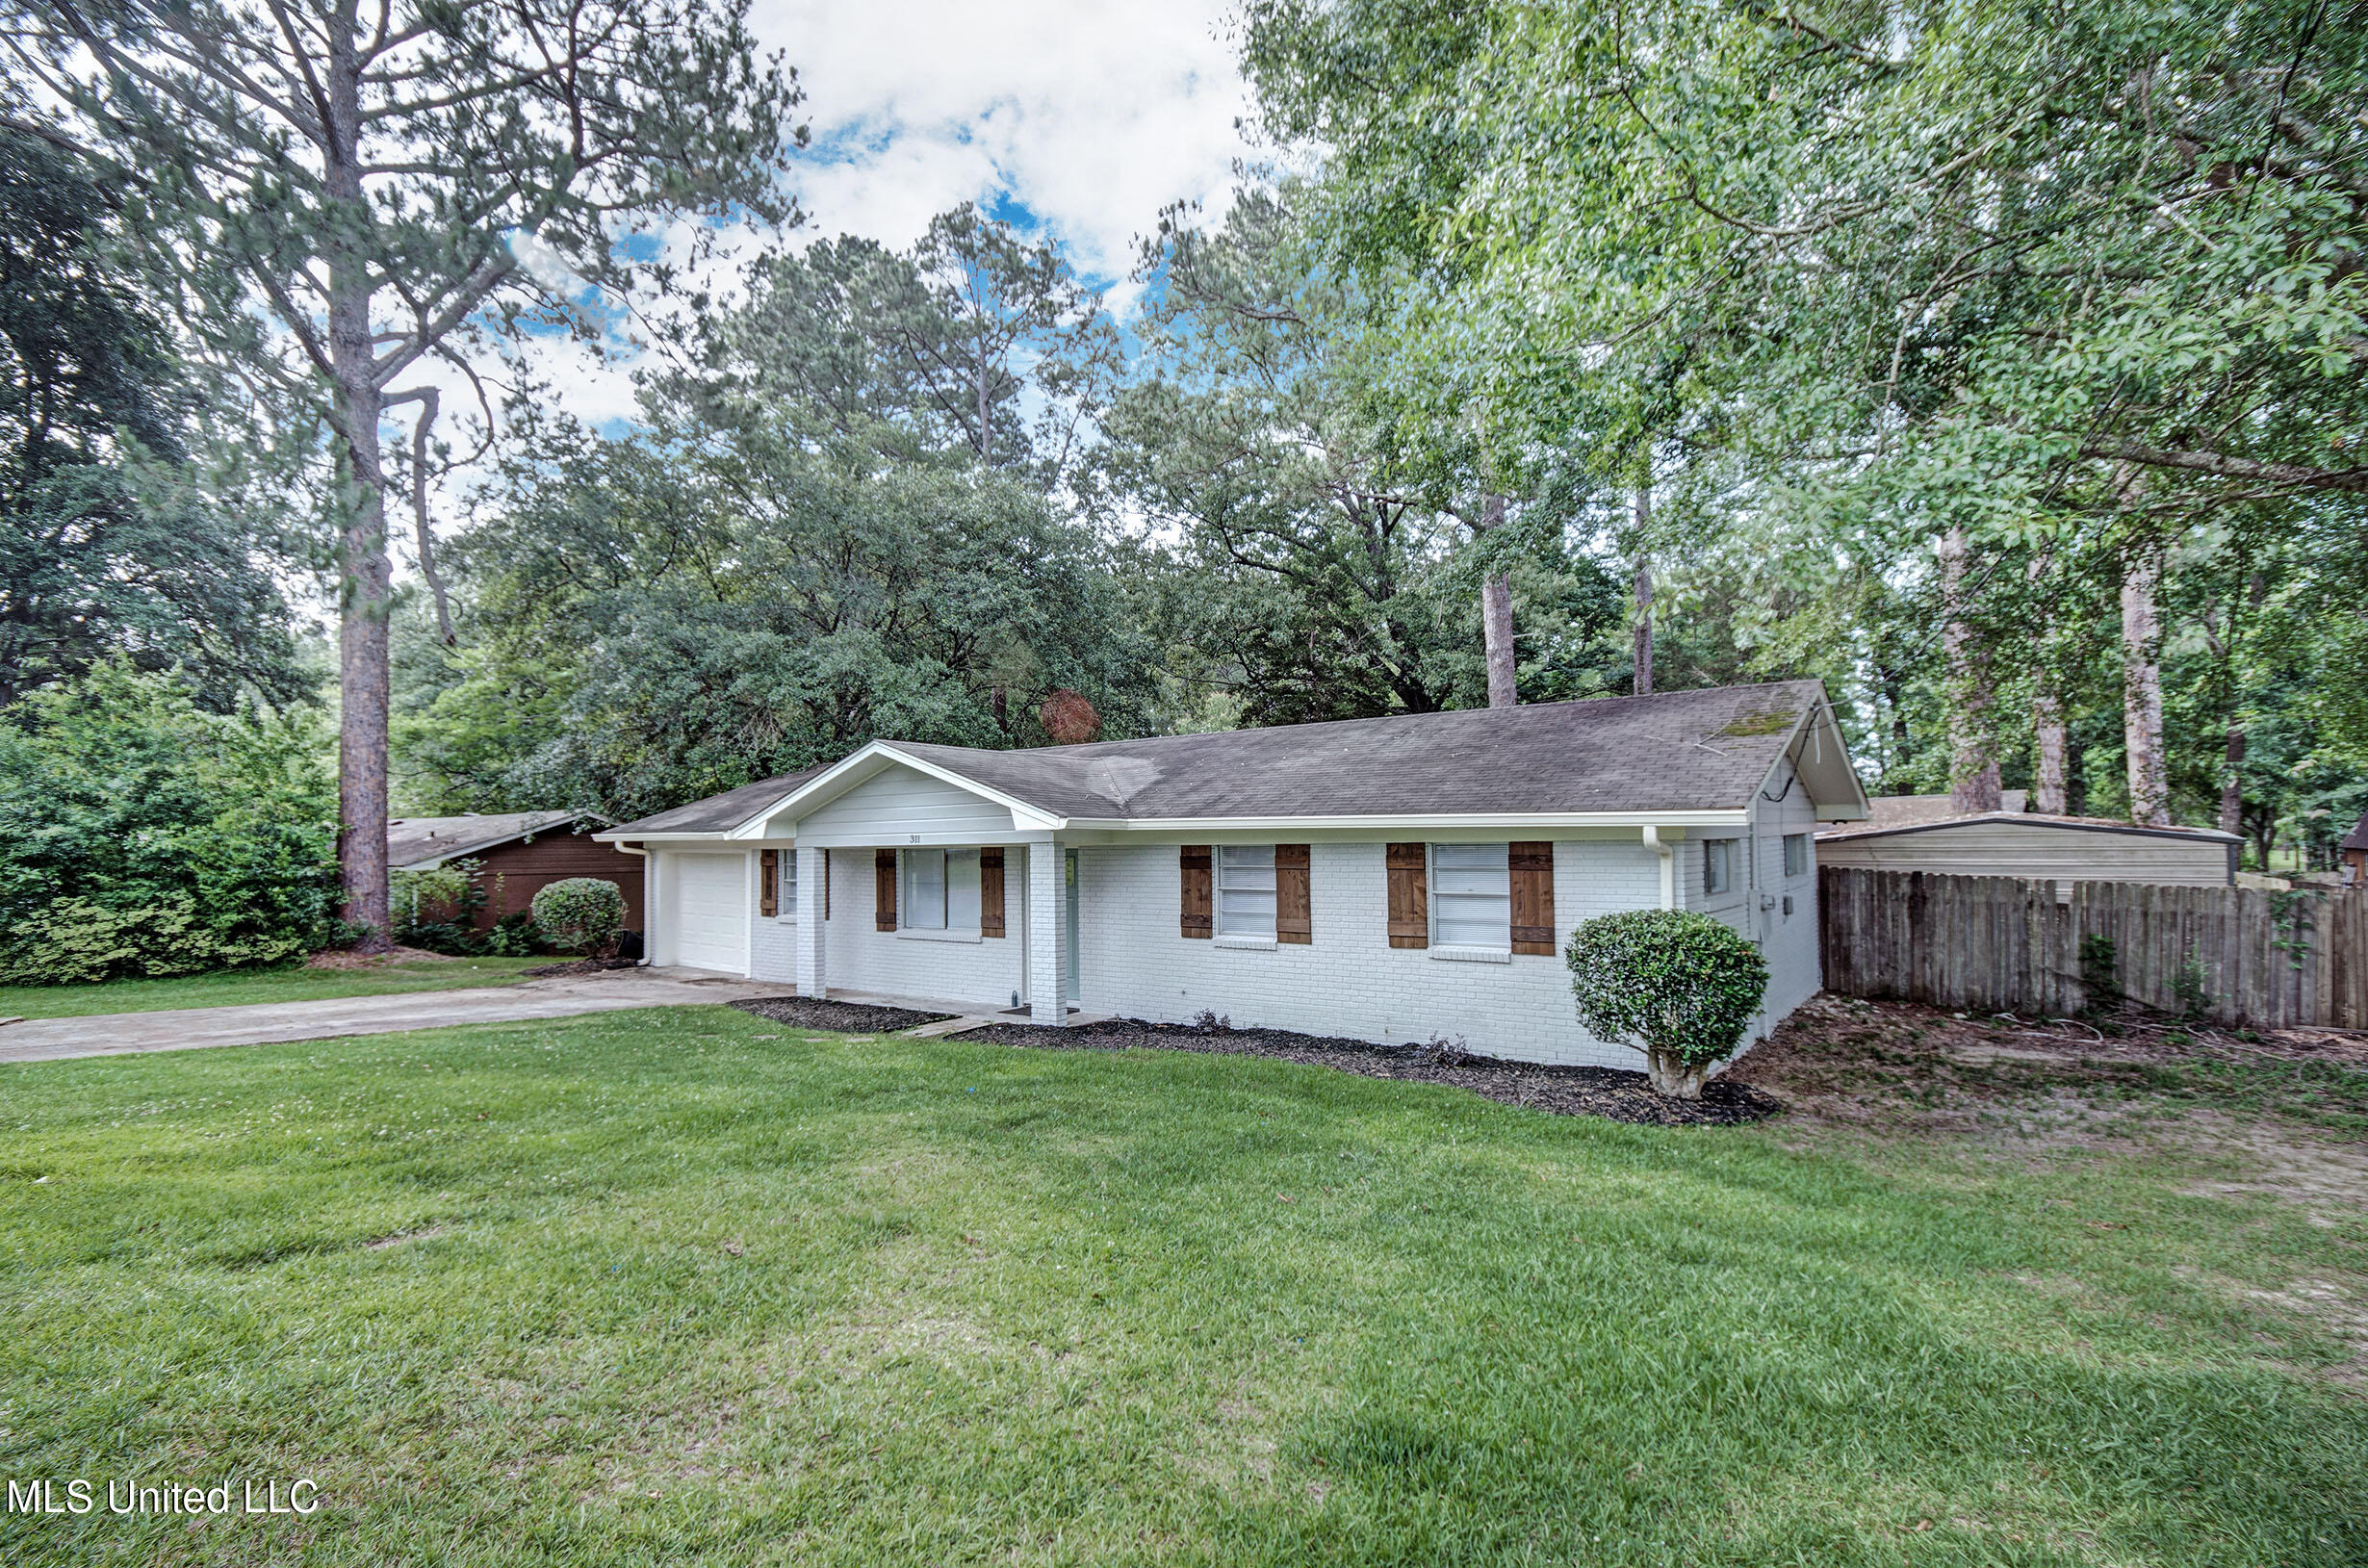
Pending
$225,000
3
bds
|
2
ba
|
0
sqft
|
built
1967
311 Danbar St, Brandon, MS 39042
$315
Cash flow
7.3%
Cash-on-Cash Return
7.4%
Cap rate
0.9%
Rent to Value Ratio

Active
$325,000
4
bds
|
2
ba
|
0
sqft
|
built
1987
907 Tetbury Pl, Brandon, MS 39047
$11
Cash flow
0.2%
Cash-on-Cash Return
5.7%
Cap rate
0.8%
Rent to Value Ratio
Active
$442,500
4
bds
|
3
ba
|
0
sqft
|
built
2004
312 Faith Way, Brandon, MS 39042
$-469
Cash flow
-5.5%
Cash-on-Cash Return
4.4%
Cap rate
0.6%
Rent to Value Ratio
Active
$310,000
3
bds
|
2
ba
|
0
sqft
|
built
2009
104 Belle Oak Dr, Brandon, MS 39042
$-65
Cash flow
-1.1%
Cash-on-Cash Return
5.4%
Cap rate
0.7%
Rent to Value Ratio

Active
$315,000
3
bds
|
2
ba
|
0
sqft
|
built
1998
1415 Windrose Dr, Brandon, MS 39047
$-114
Cash flow
-1.9%
Cash-on-Cash Return
5.2%
Cap rate
0.7%
Rent to Value Ratio
Active
$587,777
4
bds
|
4
ba
|
0
sqft
|
built
1999
1025 Monet Cv, Brandon, MS 39047
$-335
Cash flow
-3.0%
Cash-on-Cash Return
5.0%
Cap rate
0.7%
Rent to Value Ratio
Active
$385,000
4
bds
|
3
ba
|
0
sqft
|
built
2005
221 Penny Ln, Brandon, MS 39042
$-126
Cash flow
-1.7%
Cash-on-Cash Return
5.3%
Cap rate
0.7%
Rent to Value Ratio
Active
$359,000
5
bds
|
3
ba
|
0
sqft
|
built
1975
136 Westlake Dr, Brandon, MS 39047
$136
Cash flow
2.0%
Cash-on-Cash Return
6.1%
Cap rate
0.8%
Rent to Value Ratio
Active
$565,000
5
bds
|
4
ba
|
0
sqft
|
built
1975
100 Sandpiper Rd, Brandon, MS 39047
$-766
Cash flow
-7.1%
Cash-on-Cash Return
4.1%
Cap rate
0.5%
Rent to Value Ratio
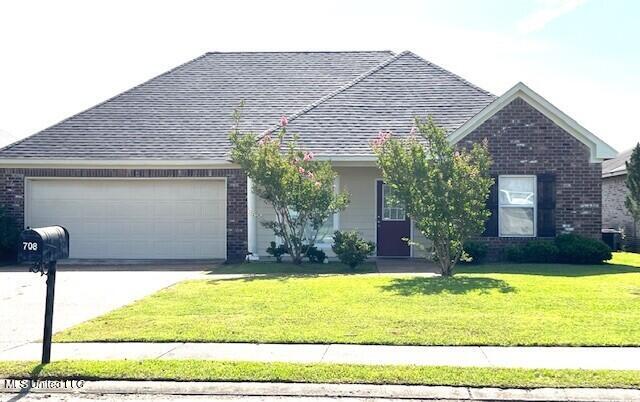
Active
$242,000
3
bds
|
2
ba
|
0
sqft
|
built
2006
708 Bo Blaze Cv, Brandon, MS 39047
$-128
Cash flow
-2.8%
Cash-on-Cash Return
5.0%
Cap rate
0.7%
Rent to Value Ratio
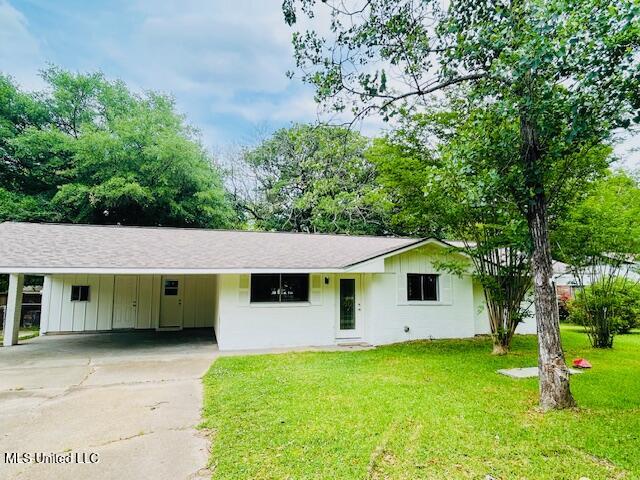
Active
$200,000
3
bds
|
2
ba
|
0
sqft
|
built
1968
810 Louis Wilson Dr, Brandon, MS 39042
$160
Cash flow
4.2%
Cash-on-Cash Return
6.6%
Cap rate
0.9%
Rent to Value Ratio
Active
$536,999
4
bds
|
3
ba
|
0
sqft
|
built
2023
221 Lost Oak Ln, Brandon, MS 39047
$-413
Cash flow
-4.0%
Cash-on-Cash Return
4.8%
Cap rate
0.7%
Rent to Value Ratio
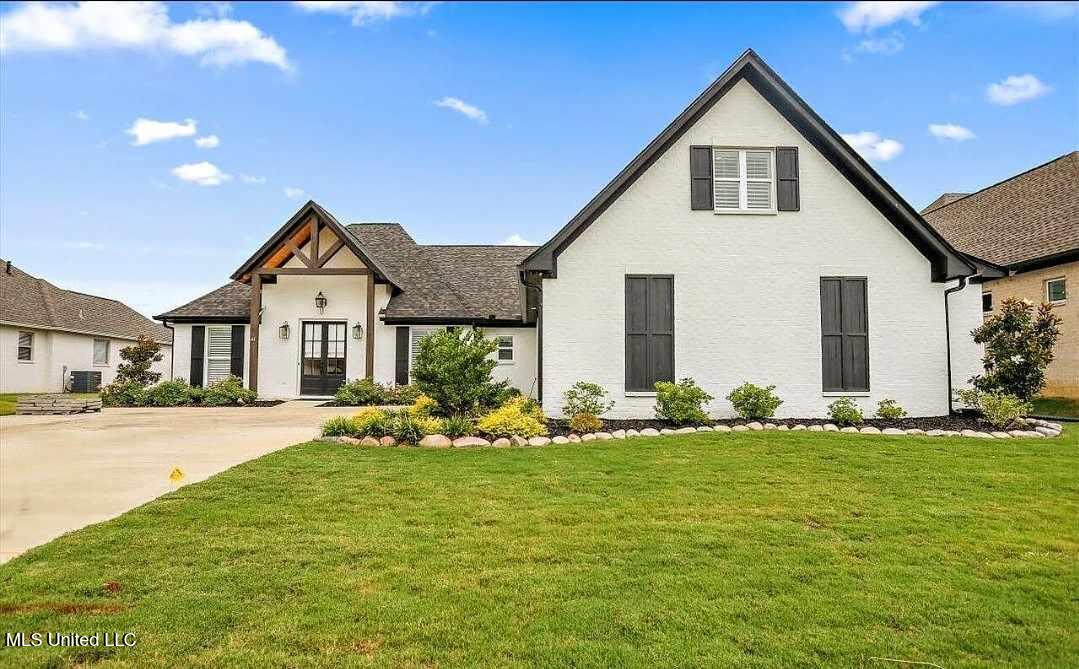
Active
$259,999
3
bds
|
2
ba
|
0
sqft
|
built
1994
106 Ole Duke Dr, Brandon, MS 39042
$385
Cash flow
7.7%
Cash-on-Cash Return
7.5%
Cap rate
0.9%
Rent to Value Ratio
Active
$574,900
4
bds
|
3
ba
|
0
sqft
|
built
2021
461 Brazos Dr, Brandon, MS 39047
$-174
Cash flow
-1.6%
Cash-on-Cash Return
5.3%
Cap rate
0.7%
Rent to Value Ratio

Pending
$500,000
3
bds
|
4
ba
|
0
sqft
|
built
2002
114 Sandstone, Brandon, MS 39047
$-126
Cash flow
-1.3%
Cash-on-Cash Return
5.4%
Cap rate
0.7%
Rent to Value Ratio
Pending
$270,000
4
bds
|
2
ba
|
0
sqft
|
built
2013
515 Belle Oak Pl, Brandon, MS 39042
$198
Cash flow
3.8%
Cash-on-Cash Return
6.6%
Cap rate
0.9%
Rent to Value Ratio
Active
$345,000
4
bds
|
3
ba
|
0
sqft
|
built
1971
105 Rankin Rd, Brandon, MS 39042
$-125
Cash flow
-1.9%
Cash-on-Cash Return
5.2%
Cap rate
0.7%
Rent to Value Ratio
Active
$274,000
4
bds
|
3
ba
|
0
sqft
|
built
1972
18 Crossgates Dr, Brandon, MS 39042
$242
Cash flow
4.6%
Cash-on-Cash Return
6.7%
Cap rate
0.8%
Rent to Value Ratio
Active
$262,500
3
bds
|
2
ba
|
0
sqft
|
built
1985
110 Waterwood Dr, Brandon, MS 39047
$-128
Cash flow
-2.5%
Cash-on-Cash Return
5.1%
Cap rate
0.8%
Rent to Value Ratio
Pending
$245,000
3
bds
|
2
ba
|
0
sqft
|
built
2005
302 Bedford Ct, Brandon, MS 39047
$93
Cash flow
2.0%
Cash-on-Cash Return
6.1%
Cap rate
0.8%
Rent to Value Ratio
Active
$259,000
3
bds
|
2
ba
|
0
sqft
|
built
1996
533 Greenhead Cir, Brandon, MS 39047
$52
Cash flow
1.0%
Cash-on-Cash Return
5.9%
Cap rate
0.8%
Rent to Value Ratio
Pending
$179,000
2
bds
|
2
ba
|
0
sqft
|
built
1974
404 Lakebend Pl, Brandon, MS 39042
$178
Cash flow
5.2%
Cash-on-Cash Return
6.9%
Cap rate
1.0%
Rent to Value Ratio
Active
$249,950
3
bds
|
2
ba
|
0
sqft
|
built
2007
935 Frisky Dr, Brandon, MS 39047
$-41
Cash flow
-0.9%
Cash-on-Cash Return
5.5%
Cap rate
0.8%
Rent to Value Ratio
Active
$259,999
3
bds
|
2
ba
|
0
sqft
|
built
2006
809 Jason Cv, Brandon, MS 39047
$21
Cash flow
0.4%
Cash-on-Cash Return
5.8%
Cap rate
0.8%
Rent to Value Ratio

Active
$264,500
3
bds
|
2
ba
|
0
sqft
|
built
2008
409 Sand Stone Pl, Brandon, MS 39042
$93
Cash flow
1.8%
Cash-on-Cash Return
6.1%
Cap rate
0.9%
Rent to Value Ratio
Active
$325,000
3
bds
|
2
ba
|
0
sqft
|
built
1999
3 Carriage Court Pl, Brandon, MS 39047
$9
Cash flow
0.1%
Cash-on-Cash Return
5.7%
Cap rate
0.8%
Rent to Value Ratio
Active
$284,900
3
bds
|
2
ba
|
0
sqft
|
built
2007
908 Fairview Pl, Brandon, MS 39047
$93
Cash flow
1.7%
Cash-on-Cash Return
6.1%
Cap rate
0.8%
Rent to Value Ratio
Active
$485,900
4
bds
|
4
ba
|
0
sqft
|
built
2014
109 Elizabeth Dr, Brandon, MS 39042
$-493
Cash flow
-5.3%
Cash-on-Cash Return
4.5%
Cap rate
0.6%
Rent to Value Ratio
Active
$408,900
4
bds
|
2
ba
|
0
sqft
|
built
2014
311 Emerald Way, Brandon, MS 39047
$-291
Cash flow
-3.7%
Cash-on-Cash Return
4.8%
Cap rate
0.7%
Rent to Value Ratio