Brandon, MS Investment Properties for Sale
Browse homes for sale and investment properties in Brandon, MS. Refine your search by price, property type, or more.
Best cash flowing properties in Brandon, MS
Active
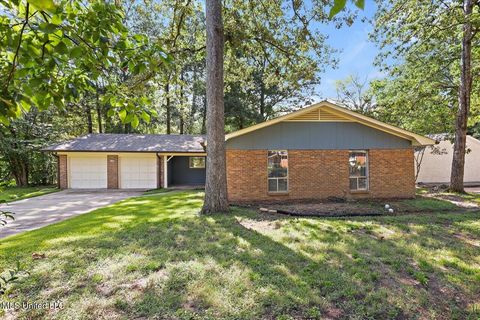
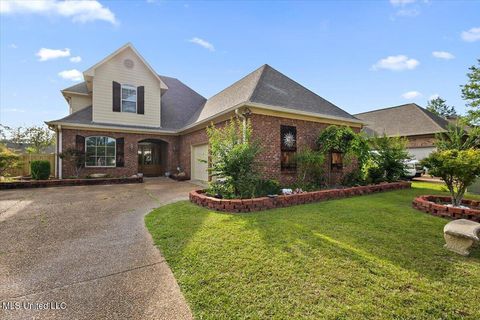
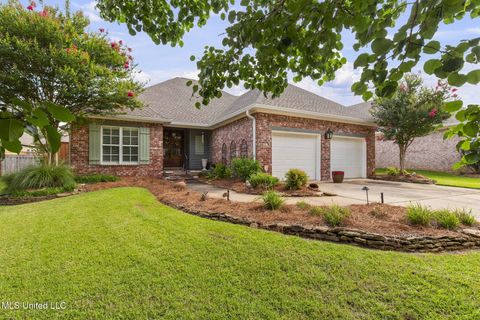
$260,000
3
bds
|
2
ba
|
0
sqft
|
built
1970
104 Holly Trl, Brandon, MS 39047
$432
Cash flow
8.7%
Cash-on-Cash Return
7.7%
Cap rate
1.0%
Rent to Value Ratio
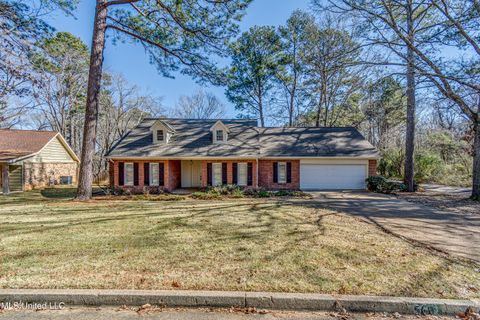
Active
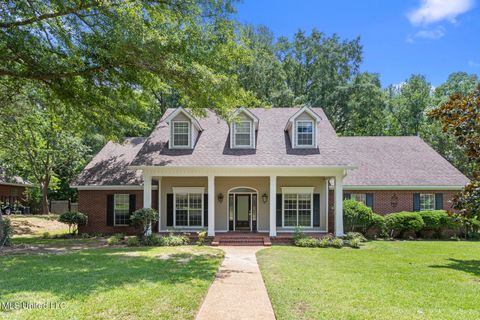
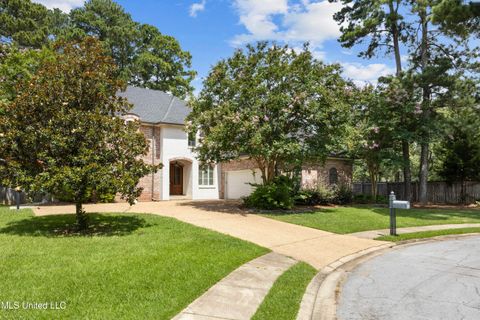
$294,800
3
bds
|
2
ba
|
0
sqft
|
built
1984
560 Dixton Dr, Brandon, MS 39047
$305
Cash flow
5.4%
Cash-on-Cash Return
6.9%
Cap rate
0.9%
Rent to Value Ratio
149 out of 154 properties for sale in Brandon, MS
Limited Results Shown
Create a free account, or log in to reveal all property listings and enjoy the complete experience.
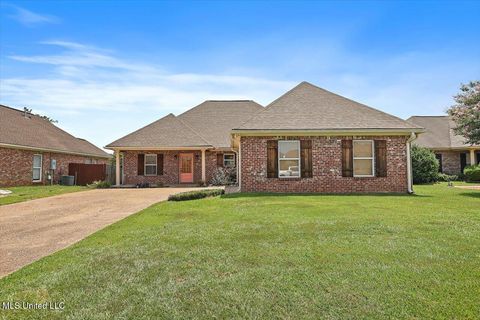
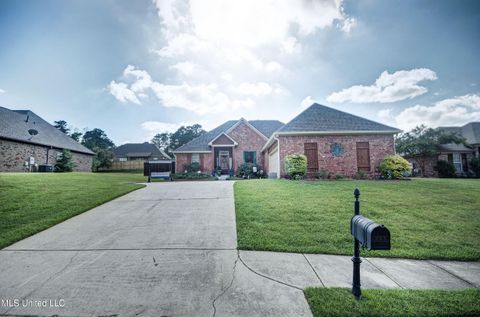
Active
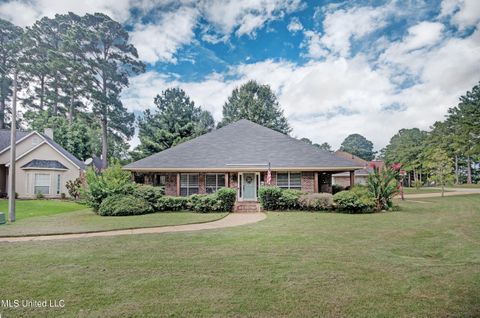
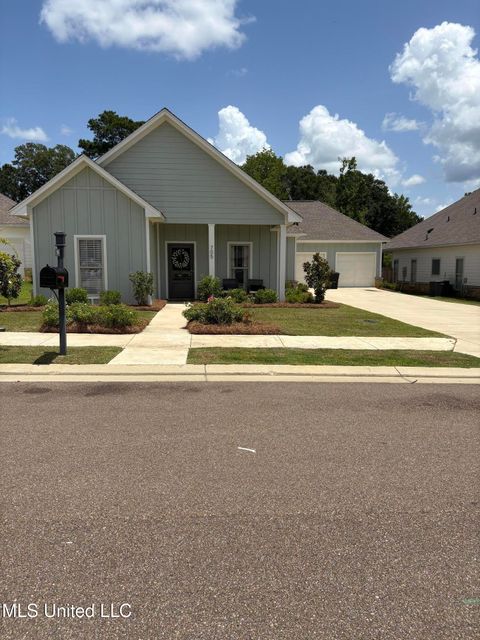
$294,800
3
bds
|
2
ba
|
0
sqft
|
built
2005
328 Red Cedar Dr, Brandon, MS 39047
$-127
Cash flow
-2.2%
Cash-on-Cash Return
5.2%
Cap rate
0.7%
Rent to Value Ratio
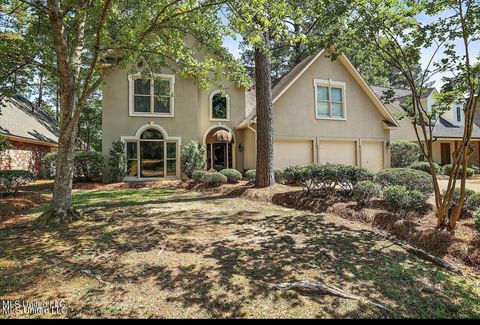
Active
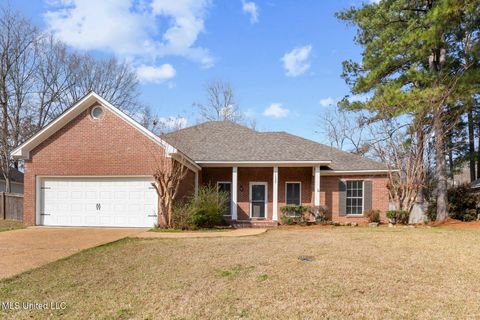
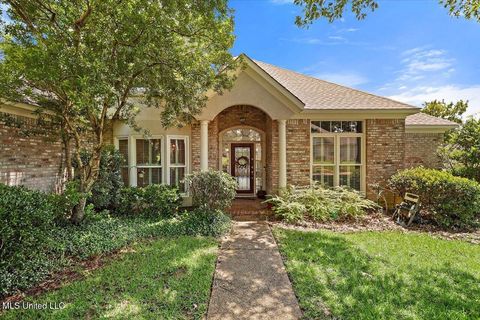
$499,900
5
bds
|
4
ba
|
0
sqft
|
built
1994
132 Pine Ridge Cir, Brandon, MS 39047
$-255
Cash flow
-2.7%
Cash-on-Cash Return
5.1%
Cap rate
0.7%
Rent to Value Ratio

Active
$394,000
4
bds
|
3
ba
|
0
sqft
|
built
1988
556 Cliffview Dr, Brandon, MS 39047
$-36
Cash flow
-0.5%
Cash-on-Cash Return
5.6%
Cap rate
0.7%
Rent to Value Ratio

Active
$750,000
5
bds
|
4
ba
|
0
sqft
|
built
2015
230 Eastwood Dr, Brandon, MS 39042
$-938
Cash flow
-6.5%
Cash-on-Cash Return
4.2%
Cap rate
0.6%
Rent to Value Ratio
Active
$395,000
3
bds
|
3
ba
|
0
sqft
|
built
2007
115 Provonce Park, Brandon, MS 39042
$-211
Cash flow
-2.8%
Cash-on-Cash Return
5.0%
Cap rate
0.7%
Rent to Value Ratio
Active
$365,000
4
bds
|
3
ba
|
0
sqft
|
built
1997
52 Eastgate Dr, Brandon, MS 39042
$-111
Cash flow
-1.6%
Cash-on-Cash Return
5.3%
Cap rate
0.7%
Rent to Value Ratio
Active
$314,900
3
bds
|
2
ba
|
0
sqft
|
built
2002
106 Bay Pointe Pl, Brandon, MS 39047
$42
Cash flow
0.7%
Cash-on-Cash Return
5.8%
Cap rate
0.8%
Rent to Value Ratio
Active
$257,000
3
bds
|
2
ba
|
0
sqft
|
built
1999
1120 Ellington Ct, Brandon, MS 39042
$81
Cash flow
1.6%
Cash-on-Cash Return
6.1%
Cap rate
0.9%
Rent to Value Ratio
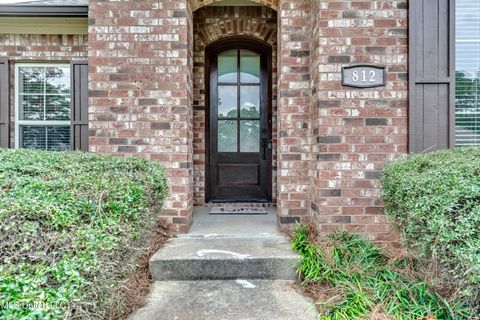
Active
$283,000
3
bds
|
2
ba
|
0
sqft
|
built
2007
812 Willow Grande Cir, Brandon, MS 39047
$-32
Cash flow
-0.6%
Cash-on-Cash Return
5.5%
Cap rate
0.8%
Rent to Value Ratio
Active
$615,000
3
bds
|
4
ba
|
0
sqft
|
built
1996
154 Pine Knoll Cv, Brandon, MS 39047
$-396
Cash flow
-3.4%
Cash-on-Cash Return
4.9%
Cap rate
0.7%
Rent to Value Ratio
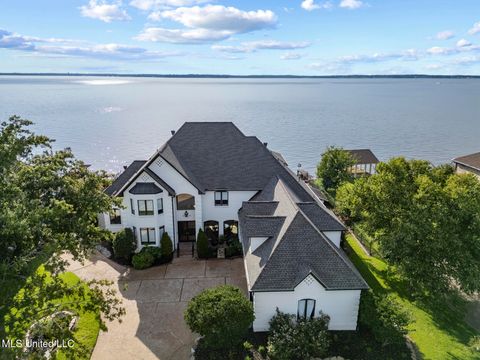
Active
$1,470,000
5
bds
|
6
ba
|
0
sqft
|
built
1999
64 Grandview Cir, Brandon, MS 39047
$-3,304
Cash flow
-11.7%
Cash-on-Cash Return
3.0%
Cap rate
0.4%
Rent to Value Ratio
Active
$324,900
3
bds
|
2
ba
|
0
sqft
|
built
2011
868 Willow Grande Cir, Brandon, MS 39047
$52
Cash flow
0.8%
Cash-on-Cash Return
5.9%
Cap rate
0.8%
Rent to Value Ratio
Active
$379,900
4
bds
|
2
ba
|
0
sqft
|
built
2016
1178 Sanctuary Dr, Brandon, MS 39042
$-38
Cash flow
-0.5%
Cash-on-Cash Return
5.6%
Cap rate
0.7%
Rent to Value Ratio
Active
$525,000
4
bds
|
4
ba
|
0
sqft
|
built
2005
624 Falon Way, Brandon, MS 39047
$-544
Cash flow
-5.4%
Cash-on-Cash Return
4.4%
Cap rate
0.6%
Rent to Value Ratio
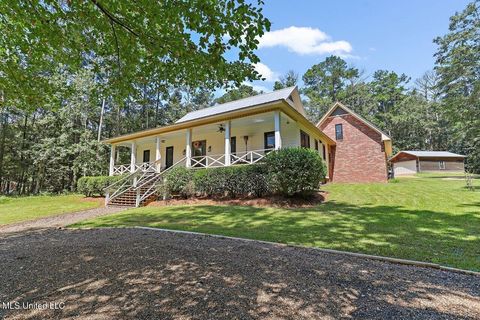
Active
$2,300,000
4
bds
|
5
ba
|
0
sqft
|
built
1900
3826 Highway 18, Brandon, MS 39042
$-8,262
Cash flow
-18.7%
Cash-on-Cash Return
1.4%
Cap rate
0.2%
Rent to Value Ratio
Active
$550,000
5
bds
|
4
ba
|
0
sqft
|
built
1995
1220 Foxpoint, Brandon, MS 39047
$-435
Cash flow
-4.1%
Cash-on-Cash Return
4.7%
Cap rate
0.7%
Rent to Value Ratio
Active
$288,400
3
bds
|
2
ba
|
0
sqft
|
built
2007
318 Towne St, Brandon, MS 39042
$166
Cash flow
3.0%
Cash-on-Cash Return
6.4%
Cap rate
0.9%
Rent to Value Ratio
Active
$290,000
3
bds
|
2
ba
|
0
sqft
|
built
1972
36 Pebble Hill Dr, Brandon, MS 39042
$89
Cash flow
1.6%
Cash-on-Cash Return
6.0%
Cap rate
0.8%
Rent to Value Ratio
Active
$805,000
4
bds
|
3
ba
|
0
sqft
|
built
2004
840 Westerly Dr, Brandon, MS 39042
$-1,385
Cash flow
-9.0%
Cash-on-Cash Return
3.6%
Cap rate
0.5%
Rent to Value Ratio

Active
$849,900
5
bds
|
5
ba
|
0
sqft
|
built
2015
505 Arbor Ln, Brandon, MS 39047
$-1,561
Cash flow
-9.6%
Cash-on-Cash Return
3.5%
Cap rate
0.5%
Rent to Value Ratio
Active
$369,000
4
bds
|
3
ba
|
0
sqft
|
built
2007
111 Meadow Pointe Cv, Brandon, MS 39042
$-260
Cash flow
-3.7%
Cash-on-Cash Return
4.8%
Cap rate
0.8%
Rent to Value Ratio
Active
$574,900
4
bds
|
4
ba
|
0
sqft
|
built
2023
212 Lost Oak Ln, Brandon, MS 39047
$-270
Cash flow
-2.5%
Cash-on-Cash Return
5.1%
Cap rate
0.7%
Rent to Value Ratio
Active
$419,900
5
bds
|
4
ba
|
0
sqft
|
built
1996
301 Apple Blossom Ct, Brandon, MS 39047
$-57
Cash flow
-0.7%
Cash-on-Cash Return
5.5%
Cap rate
0.7%
Rent to Value Ratio
Active
$349,000
3
bds
|
2
ba
|
0
sqft
|
built
2005
304 Eastside Vw, Brandon, MS 39047
$-174
Cash flow
-2.6%
Cash-on-Cash Return
5.1%
Cap rate
0.7%
Rent to Value Ratio
Active
$299,000
3
bds
|
2
ba
|
0
sqft
|
built
1998
1415 Windrose Dr, Brandon, MS 39047
$-38
Cash flow
-0.7%
Cash-on-Cash Return
5.5%
Cap rate
0.8%
Rent to Value Ratio
Active
$259,900
3
bds
|
2
ba
|
0
sqft
|
built
2012
249 Greenfield Ridge Dr, Brandon, MS 39042
$40
Cash flow
0.8%
Cash-on-Cash Return
5.9%
Cap rate
0.8%
Rent to Value Ratio
Active
$315,000
3
bds
|
2
ba
|
0
sqft
|
built
1998
1137 Ellington Ct, Brandon, MS 39042
$-7
Cash flow
-0.1%
Cash-on-Cash Return
5.7%
Cap rate
0.7%
Rent to Value Ratio
Active
$365,000
4
bds
|
3
ba
|
0
sqft
|
built
2006
119 Turtle Ridge Dr, Brandon, MS 39047
$-148
Cash flow
-2.1%
Cash-on-Cash Return
5.2%
Cap rate
0.7%
Rent to Value Ratio
Active
$328,500
3
bds
|
2
ba
|
0
sqft
|
built
2023
104 Shelby Mae Cir, Brandon, MS 39042
$-10
Cash flow
-0.2%
Cash-on-Cash Return
5.6%
Cap rate
0.8%
Rent to Value Ratio
Active
$339,000
3
bds
|
2
ba
|
0
sqft
|
built
2003
225 E Towne Dr, Brandon, MS 39042
$-143
Cash flow
-2.2%
Cash-on-Cash Return
5.2%
Cap rate
0.7%
Rent to Value Ratio
Active
$569,000
4
bds
|
4
ba
|
0
sqft
|
built
2007
509 Eastlake Forest Dr, Brandon, MS 39047
$-914
Cash flow
-8.4%
Cash-on-Cash Return
3.8%
Cap rate
0.5%
Rent to Value Ratio
Active
$350,000
3
bds
|
3
ba
|
0
sqft
|
built
2022
705 Hartwood Cv, Brandon, MS 39042
$-344
Cash flow
-5.1%
Cash-on-Cash Return
4.5%
Cap rate
0.7%
Rent to Value Ratio
Active
$675,000
4
bds
|
3
ba
|
0
sqft
|
built
1991
219 Northwind Dr, Brandon, MS 39047
$-832
Cash flow
-6.4%
Cash-on-Cash Return
4.2%
Cap rate
0.6%
Rent to Value Ratio
Active
$340,000
3
bds
|
2
ba
|
0
sqft
|
built
1992
506 Ridge Cir, Brandon, MS 39047
$-28
Cash flow
-0.4%
Cash-on-Cash Return
5.6%
Cap rate
0.8%
Rent to Value Ratio
Active
$429,900
4
bds
|
4
ba
|
0
sqft
|
built
2012
636 Hidden Hills Xing, Brandon, MS 39047
$-113
Cash flow
-1.4%
Cash-on-Cash Return
5.4%
Cap rate
0.7%
Rent to Value Ratio
Active
$400,000
5
bds
|
3
ba
|
0
sqft
|
built
2002
124 Fox Hollow Bnd, Brandon, MS 39047
$-149
Cash flow
-1.9%
Cash-on-Cash Return
5.2%
Cap rate
0.7%
Rent to Value Ratio
Active
$599,000
3
bds
|
3
ba
|
0
sqft
|
built
2015
226 Port Arbor, Brandon, MS 39047
$-836
Cash flow
-7.3%
Cash-on-Cash Return
4.0%
Cap rate
0.6%
Rent to Value Ratio
Active
$485,000
4
bds
|
4
ba
|
0
sqft
|
built
1997
407 Daniel Dr, Brandon, MS 39047
$-338
Cash flow
-3.6%
Cash-on-Cash Return
4.8%
Cap rate
0.6%
Rent to Value Ratio