Brandon, MS Investment Properties for Sale
Browse homes for sale and investment properties in Brandon, MS. Refine your search by price, property type, or more.
Best cash flowing properties in Brandon, MS
Active
$250,000
4
bds
|
3
ba
|
0
sqft
|
built
1976
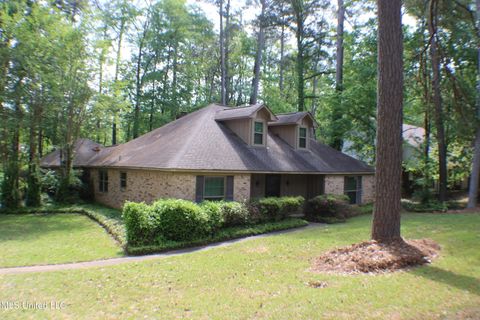
1109 Martin Dr, Brandon, MS 39047
$487
Cash flow
10.2%
Cash-on-Cash Return
8.0%
Cap rate
1.0%
Rent to Value Ratio
Active
$304,700
4
bds
|
2
ba
|
0
sqft
|
built
1972
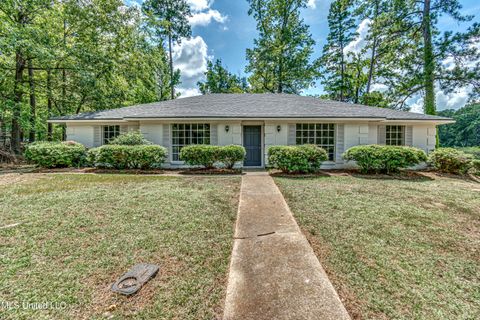
107 Woodgate Dr, Brandon, MS 39042
$275
Cash flow
4.7%
Cash-on-Cash Return
6.8%
Cap rate
0.9%
Rent to Value Ratio
162 out of 167 properties for sale in Brandon, MS
Limited Results Shown
Create a free account, or log in to reveal all property listings and enjoy the complete experience.
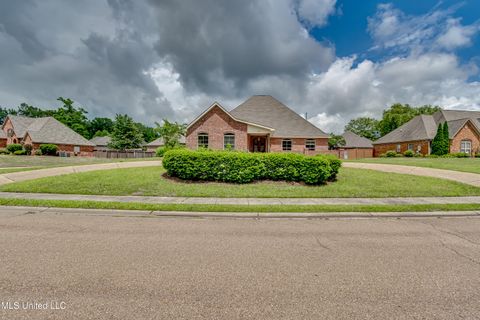
Active
$334,000
4
bds
|
2
ba
|
0
sqft
|
built
1994
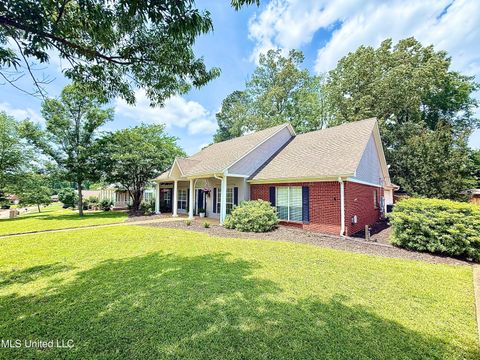
196 Woodlands Green Dr, Brandon, MS 39047
$173
Cash flow
2.7%
Cash-on-Cash Return
6.3%
Cap rate
0.8%
Rent to Value Ratio
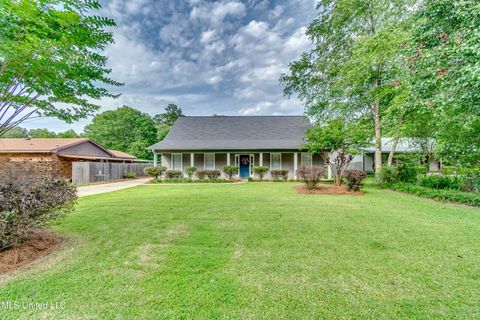
Active
$474,000
5
bds
|
5
ba
|
0
sqft
|
built
1974
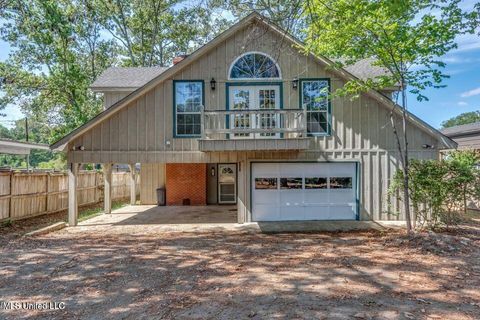
363 Lake Harbor Rd, Brandon, MS 39047
$-213
Cash flow
-2.3%
Cash-on-Cash Return
5.1%
Cap rate
0.7%
Rent to Value Ratio
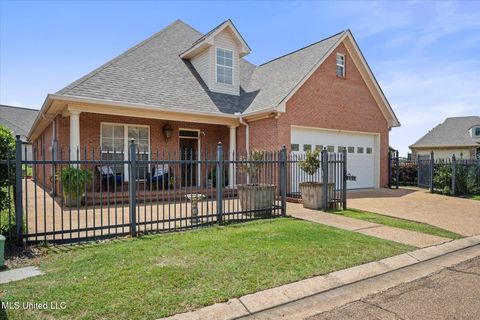
Active
$379,900
4
bds
|
3
ba
|
0
sqft
|
built
2007
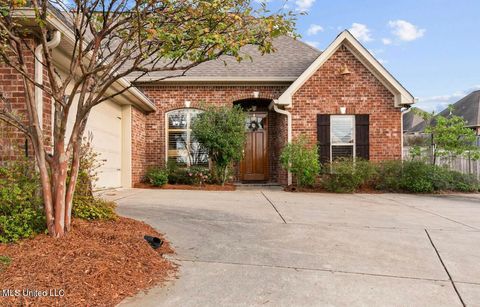
104 Faith Way, Brandon, MS 39042
$-317
Cash flow
-4.4%
Cash-on-Cash Return
4.7%
Cap rate
0.8%
Rent to Value Ratio
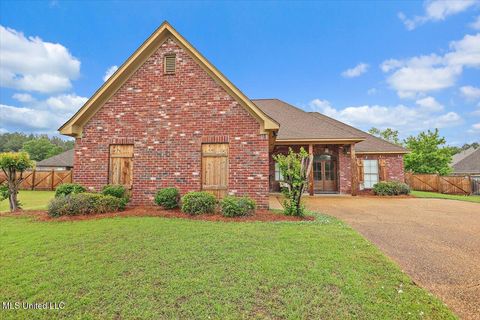
Active
$389,999
4
bds
|
2
ba
|
0
sqft
|
built
2000
218 Harbor Ln, Brandon, MS 39047
$-211
Cash flow
-2.8%
Cash-on-Cash Return
5.0%
Cap rate
0.6%
Rent to Value Ratio
Active
$409,000
4
bds
|
3
ba
|
0
sqft
|
built
2004
25 Savannah Cir, Brandon, MS 39047
$-350
Cash flow
-4.5%
Cash-on-Cash Return
4.7%
Cap rate
0.7%
Rent to Value Ratio
Active
$295,600
3
bds
|
2
ba
|
0
sqft
|
built
2009
902 Belle Oak Cv, Brandon, MS 39042
$-1
Cash flow
0.0%
Cash-on-Cash Return
5.7%
Cap rate
0.8%
Rent to Value Ratio
Active
$419,800
4
bds
|
3
ba
|
0
sqft
|
built
2015
454 Glendale Pl, Brandon, MS 39047
$74
Cash flow
0.9%
Cash-on-Cash Return
5.9%
Cap rate
0.8%
Rent to Value Ratio
Active
$389,900
4
bds
|
3
ba
|
0
sqft
|
built
1990
3099 E Fairway Dr, Brandon, MS 39047
$137
Cash flow
1.8%
Cash-on-Cash Return
6.1%
Cap rate
0.9%
Rent to Value Ratio
Active
$385,000
5
bds
|
4
ba
|
0
sqft
|
built
1989
420 Fox Bay Dr, Brandon, MS 39047
$68
Cash flow
0.9%
Cash-on-Cash Return
5.9%
Cap rate
0.8%
Rent to Value Ratio
Active
$250,000
3
bds
|
2
ba
|
0
sqft
|
built
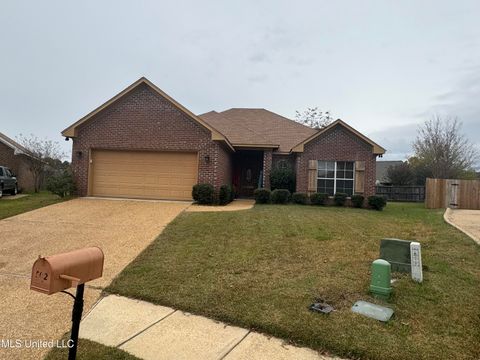
2007
502 Spring Hill Pl, Brandon, MS 39047
$263
Cash flow
5.5%
Cash-on-Cash Return
6.9%
Cap rate
0.9%
Rent to Value Ratio
Active
$585,000
4
bds
|
4
ba
|
0
sqft
|
built
2018
413 Miles Cv, Brandon, MS 39047
$-540
Cash flow
-4.8%
Cash-on-Cash Return
4.6%
Cap rate
0.7%
Rent to Value Ratio
Active
$479,000
4
bds
|
3
ba
|
0
sqft
|
built
2021
803 White Rock Ln, Brandon, MS 39047
$-119
Cash flow
-1.3%
Cash-on-Cash Return
5.4%
Cap rate
0.8%
Rent to Value Ratio
Active
$475,000
5
bds
|
5
ba
|
0
sqft
|
built
2010
114 Parkway Cv, Brandon, MS 39047
$207
Cash flow
2.3%
Cash-on-Cash Return
6.2%
Cap rate
0.8%
Rent to Value Ratio
Active
$334,900
4
bds
|
4
ba
|
0
sqft
|
built
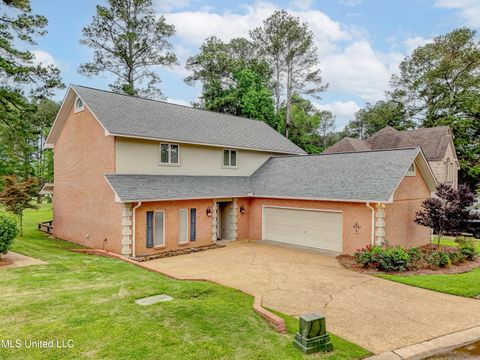
1977
408 Millrun Rd, Brandon, MS 39047
$45
Cash flow
0.7%
Cash-on-Cash Return
5.8%
Cap rate
0.9%
Rent to Value Ratio
Active
$344,900
3
bds
|
2
ba
|
0
sqft
|
built
1987
26 Woodgate Dr, Brandon, MS 39042
$-25
Cash flow
-0.4%
Cash-on-Cash Return
5.6%
Cap rate
0.7%
Rent to Value Ratio
Active
$712,000
5
bds
|
5
ba
|
0
sqft
|
built
2015
233 Arbor Trl, Brandon, MS 39047
$-1,482
Cash flow
-10.9%
Cash-on-Cash Return
3.2%
Cap rate
0.6%
Rent to Value Ratio
Active
$269,900
3
bds
|
3
ba
|
0
sqft
|
built
1993
102 Parkview Ln, Brandon, MS 39047
$157
Cash flow
3.0%
Cash-on-Cash Return
6.4%
Cap rate
0.9%
Rent to Value Ratio
Active
$265,000
3
bds
|
2
ba
|
0
sqft
|
built
1977
214 Dublin Ct, Brandon, MS 39047
$-32
Cash flow
-0.6%
Cash-on-Cash Return
5.5%
Cap rate
0.7%
Rent to Value Ratio
Active
$270,000
4
bds
|
3
ba
|
0
sqft
|
built
1974
54 Willowbrook Ln, Brandon, MS 39042
$213
Cash flow
4.1%
Cash-on-Cash Return
6.6%
Cap rate
0.9%
Rent to Value Ratio
Active
$484,430
5
bds
|
5
ba
|
0
sqft
|
built
2019
150 Pine Ridge Cir, Brandon, MS 39047
$94
Cash flow
1.0%
Cash-on-Cash Return
5.9%
Cap rate
0.8%
Rent to Value Ratio
Active
$315,000
4
bds
|
3
ba
|
0
sqft
|
built
1979
61 Sunline Dr, Brandon, MS 39042
$-60
Cash flow
-1.0%
Cash-on-Cash Return
5.5%
Cap rate
0.8%
Rent to Value Ratio
Active
$638,000
4
bds
|
4
ba
|
0
sqft
|
built
1960
223 Gulde Rd, Brandon, MS 39042
$-362
Cash flow
-3.0%
Cash-on-Cash Return
5.0%
Cap rate
0.6%
Rent to Value Ratio
Active
$1,189,950
5
bds
|
5
ba
|
0
sqft
|
built
1999
116 Port Ln, Brandon, MS 39047
$-2,274
Cash flow
-10.0%
Cash-on-Cash Return
3.4%
Cap rate
0.5%
Rent to Value Ratio
Active
$699,000
4
bds
|
4
ba
|
0
sqft
|
built
2004
1109 Foxpoint, Brandon, MS 39047
$-494
Cash flow
-3.7%
Cash-on-Cash Return
4.8%
Cap rate
0.6%
Rent to Value Ratio
Active
$499,900
4
bds
|
4
ba
|
0
sqft
|
built
2022
1003 Crepe Myrtle Dr, Brandon, MS 39047
$-231
Cash flow
-2.4%
Cash-on-Cash Return
5.1%
Cap rate
0.7%
Rent to Value Ratio
Active
$512,999
4
bds
|
3
ba
|
0
sqft
|
built
2007
300 Deer Holw, Brandon, MS 39047
$-731
Cash flow
-7.4%
Cash-on-Cash Return
4.0%
Cap rate
0.5%
Rent to Value Ratio
Active
$492,500
4
bds
|
3
ba
|
0
sqft
|
built
2022
1414 Rudder Way, Brandon, MS 39047
$-422
Cash flow
-4.5%
Cash-on-Cash Return
4.7%
Cap rate
0.6%
Rent to Value Ratio
Active
$660,000
5
bds
|
4
ba
|
0
sqft
|
built
2022
272 Disciple Dr, Brandon, MS 39047
$-690
Cash flow
-5.5%
Cash-on-Cash Return
4.4%
Cap rate
0.6%
Rent to Value Ratio
Active
$379,000
4
bds
|
3
ba
|
0
sqft
|
built
1998
307 Meadowview Ln, Brandon, MS 39047
$224
Cash flow
3.1%
Cash-on-Cash Return
6.4%
Cap rate
0.8%
Rent to Value Ratio
Active
$499,950
4
bds
|
4
ba
|
0
sqft
|
built
1998
1120 Pointe Cv, Brandon, MS 39042
$-219
Cash flow
-2.3%
Cash-on-Cash Return
5.2%
Cap rate
0.7%
Rent to Value Ratio
Active
$495,000
4
bds
|
3
ba
|
0
sqft
|
built
2022
1411 Rudder Way, Brandon, MS 39047
$-279
Cash flow
-2.9%
Cash-on-Cash Return
5.0%
Cap rate
0.7%
Rent to Value Ratio
Active
$525,000
4
bds
|
4
ba
|
0
sqft
|
built
2022
108 Willow Pl, Brandon, MS 39047
$-1,057
Cash flow
-10.5%
Cash-on-Cash Return
3.3%
Cap rate
0.5%
Rent to Value Ratio
Active
$261,800
3
bds
|
2
ba
|
0
sqft
|
built
1974
58 Summit Ridge Dr, Brandon, MS 39042
$200
Cash flow
4.0%
Cash-on-Cash Return
6.6%
Cap rate
0.9%
Rent to Value Ratio
Active
$378,000
5
bds
|
3
ba
|
0
sqft
|
built
1996
513 Windsor Dr, Brandon, MS 39047
$45
Cash flow
0.6%
Cash-on-Cash Return
5.8%
Cap rate
0.8%
Rent to Value Ratio
Active
$569,500
4
bds
|
3
ba
|
0
sqft
|
built
1986
23 Le Bourgeois Dr, Brandon, MS 39047
$-456
Cash flow
-4.2%
Cash-on-Cash Return
4.7%
Cap rate
0.6%
Rent to Value Ratio
Active
$410,000
3
bds
|
3
ba
|
0
sqft
|
built
2023
127 Ole Magnolia Dr, Brandon, MS 39042
$-383
Cash flow
-4.9%
Cash-on-Cash Return
4.6%
Cap rate
0.7%
Rent to Value Ratio
Active
$929,900
4
bds
|
4
ba
|
0
sqft
|
built
2019
167 Dogwood Trce, Brandon, MS 39042
$-1,720
Cash flow
-9.7%
Cash-on-Cash Return
3.5%
Cap rate
0.5%
Rent to Value Ratio
Active
$155,000
2
bds
|
1
ba
|
0
sqft
|
built
1987
154 Cumberland Rd, Brandon, MS 39047
$159
Cash flow
5.4%
Cash-on-Cash Return
6.9%
Cap rate
0.9%
Rent to Value Ratio