Buford, GA Investment Properties for Sale
Browse homes for sale and investment properties in Buford, GA. Refine your search by price, property type, or more.
Best cash flowing properties in Buford, GA

Active
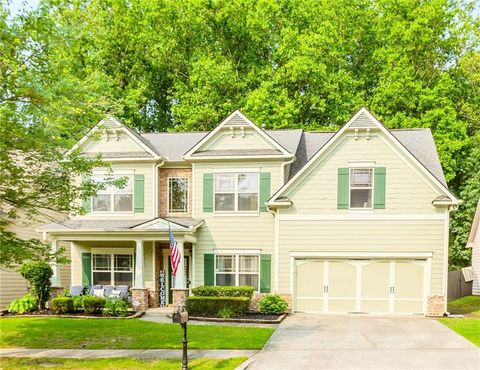
$250,000
2
bds
|
0
ba
|
905
sqft
|
built
1981
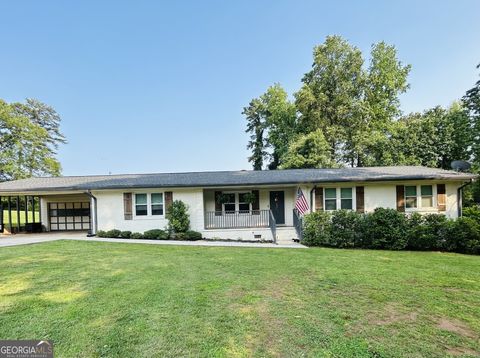
4679 Candlewyck Way, Buford, GA 30518
$-139
Cash flow
-2.9%
Cash-on-Cash Return
5.5%
Cap rate
0.7%
Rent to Value Ratio
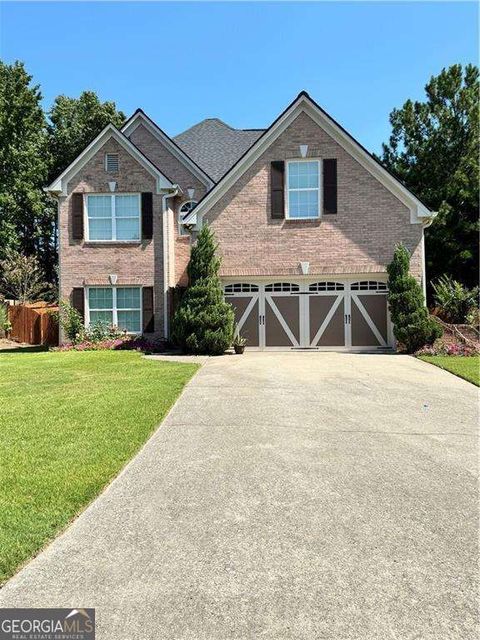
Active
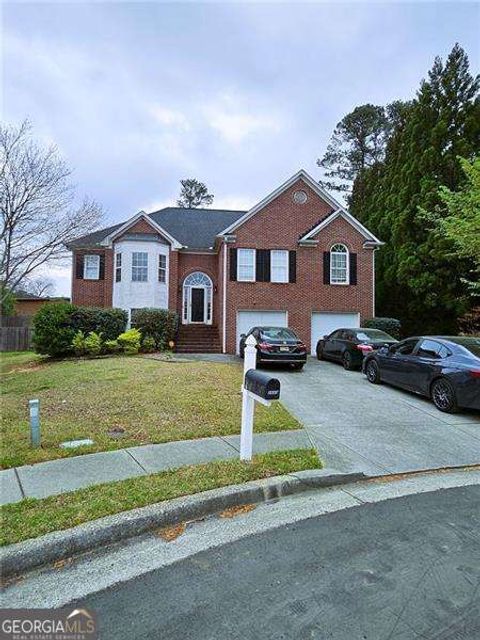
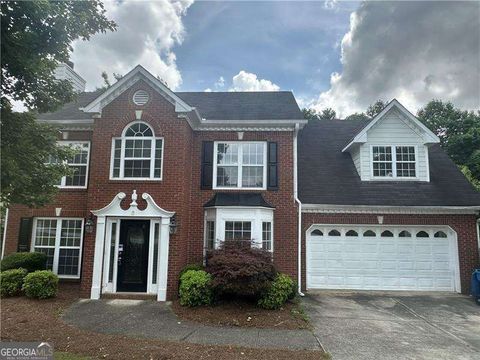
$374,900
3
bds
|
0
ba
|
1,974
sqft
|
built
2013
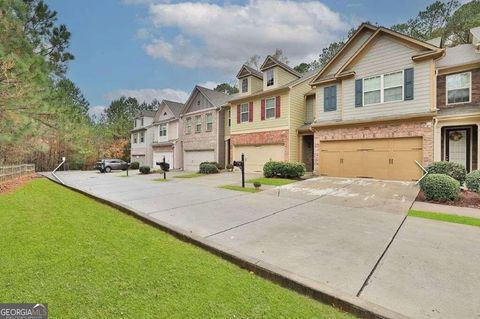
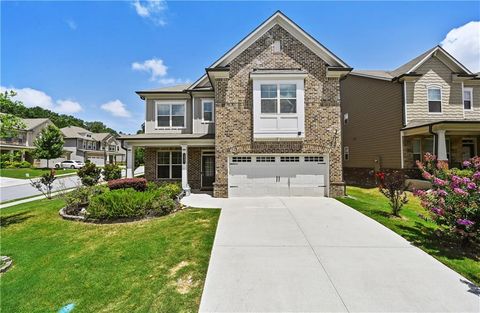
2626 Sardis Chase Ct, Buford, GA 30519
$-410
Cash flow
-5.7%
Cash-on-Cash Return
5.0%
Cap rate
0.7%
Rent to Value Ratio
279 out of 296 properties for sale in Buford, GA
Limited Results Shown
Create a free account, or log in to reveal all property listings and enjoy the complete experience.
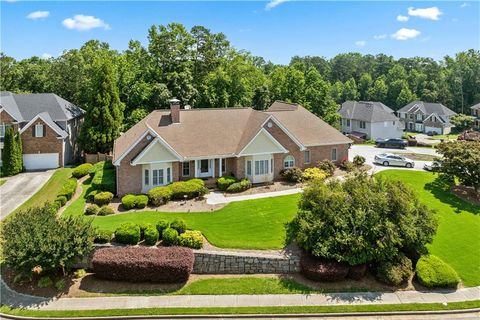
Active
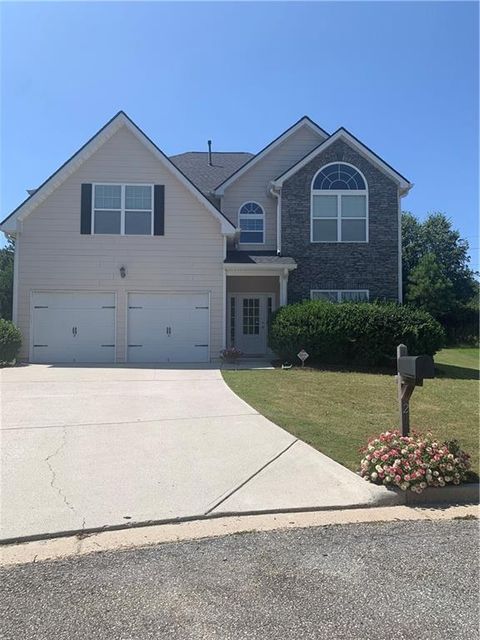
$1,675,000
6
bds
|
5
ba
|
0
sqft
|
built
1988
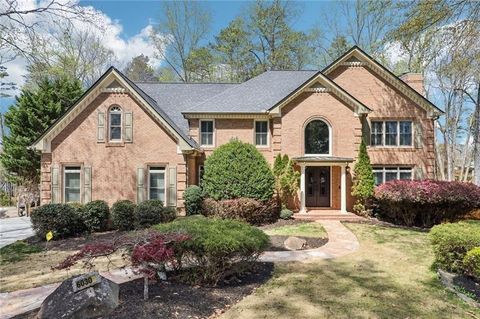
6030 Chimney Springs Rd, Buford, GA 30518
$-6,999
Cash flow
-21.8%
Cash-on-Cash Return
1.1%
Cap rate
0.2%
Rent to Value Ratio
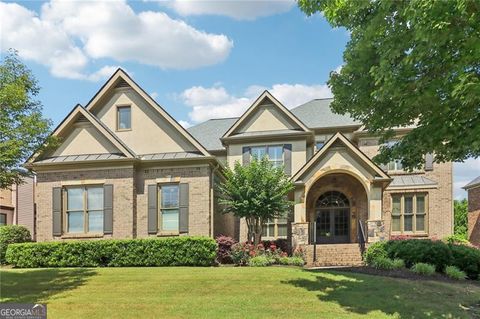
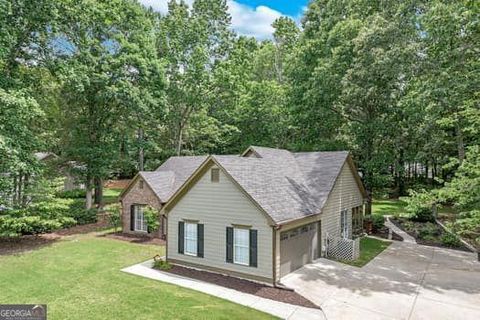
Active
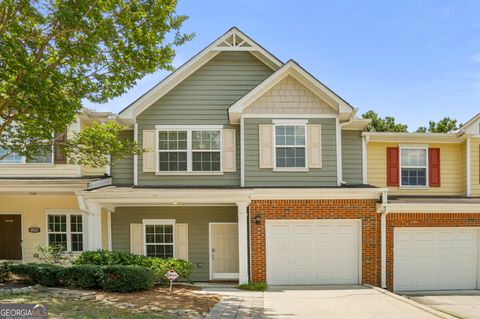
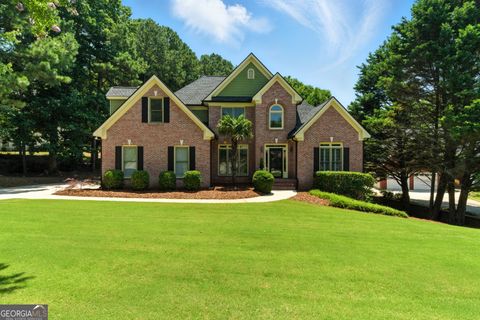
$734,000
5
bds
|
3
ba
|
3,330
sqft
|
built
2014
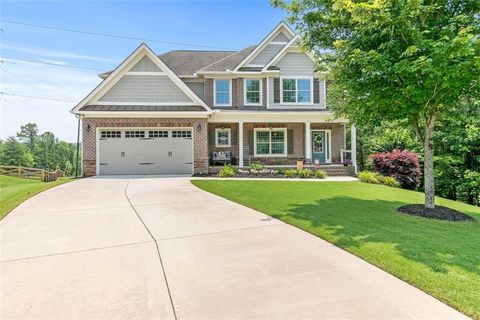
466 Sweet Apple Ln, Buford, GA 30518
$-1,979
Cash flow
-14.1%
Cash-on-Cash Return
2.9%
Cap rate
0.4%
Rent to Value Ratio
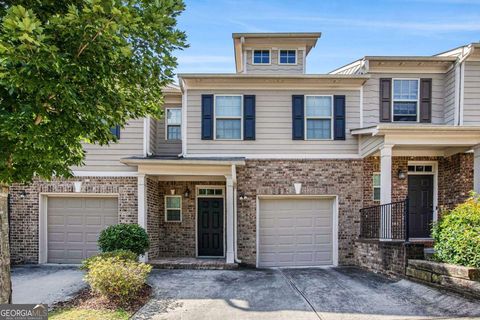
Active
$1,625,000
5
bds
|
0
ba
|
0
sqft
|
built
2023
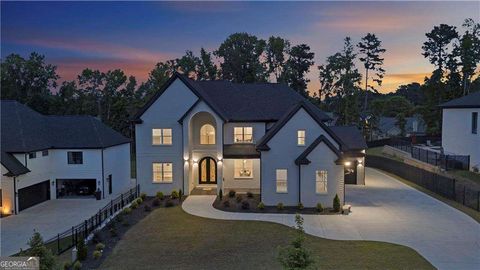
2631 Sardis Way, Buford, GA 30519
$-3,691
Cash flow
-11.9%
Cash-on-Cash Return
3.4%
Cap rate
0.5%
Rent to Value Ratio
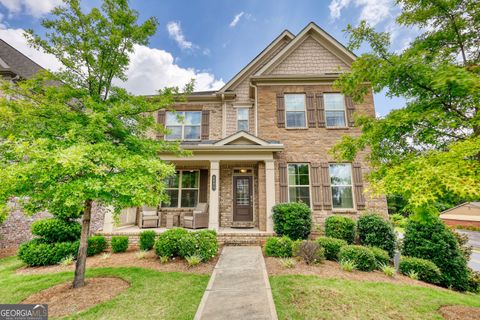
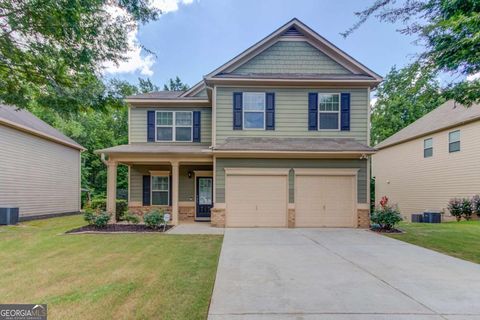
Active
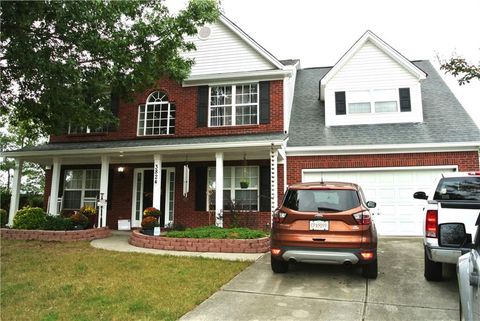
$465,000
5
bds
|
3
ba
|
2,648
sqft
|
built
2006
4273 Creekrun Cir, Buford, GA 30519
$-1,115
Cash flow
-12.5%
Cash-on-Cash Return
3.3%
Cap rate
0.5%
Rent to Value Ratio
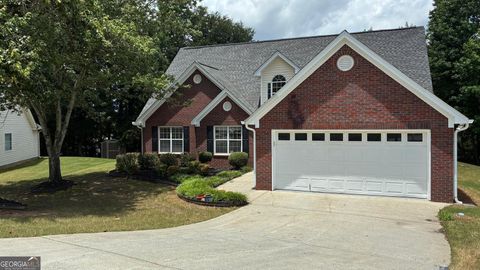
Active
$579,900
5
bds
|
0
ba
|
3,164
sqft
|
built
2001
2669 Ambria Dr, Buford, GA 30519
$-1,596
Cash flow
-14.4%
Cash-on-Cash Return
2.8%
Cap rate
0.5%
Rent to Value Ratio
Active
$535,000
5
bds
|
3
ba
|
2,990
sqft
|
built
2008
2118 Water Mill Ct, Buford, GA 30519
$-1,443
Cash flow
-14.1%
Cash-on-Cash Return
2.9%
Cap rate
0.5%
Rent to Value Ratio

Active
$465,000
4
bds
|
0
ba
|
2,793
sqft
|
built
2002
5735 Lake Windsor Pkwy, Buford, GA 30518
$-1,121
Cash flow
-12.6%
Cash-on-Cash Return
3.4%
Cap rate
0.6%
Rent to Value Ratio

Active
$469,000
4
bds
|
0
ba
|
2,242
sqft
|
built
2015
2436 Loughridge Dr, Buford, GA 30519
$-1,036
Cash flow
-11.5%
Cash-on-Cash Return
3.6%
Cap rate
0.6%
Rent to Value Ratio
Active
$299,700
2
bds
|
0
ba
|
1,683
sqft
|
built
2006
2203 Hyssop Way, Buford, GA 30519
$-545
Cash flow
-9.5%
Cash-on-Cash Return
4.1%
Cap rate
0.7%
Rent to Value Ratio

Active
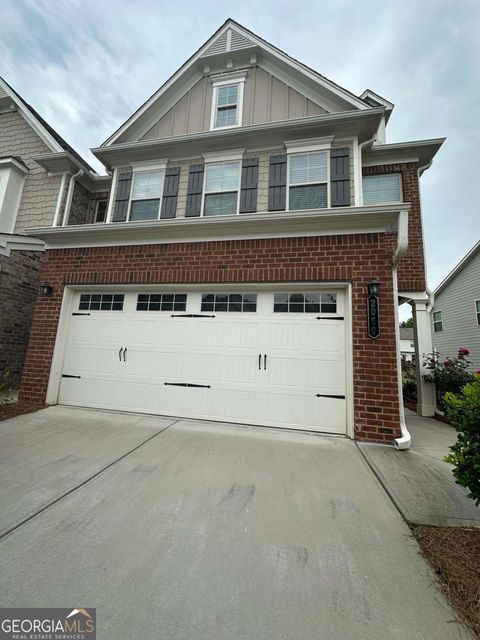
$524,900
4
bds
|
0
ba
|
0
sqft
|
built
2018
2099 Lakeview Bend Way, Buford, GA 30519
$-1,625
Cash flow
-16.2%
Cash-on-Cash Return
2.5%
Cap rate
0.5%
Rent to Value Ratio
Active
$454,900
4
bds
|
0
ba
|
2,593
sqft
|
built
2000
2346 Hampton Park Dr, Buford, GA 30519
$-1,083
Cash flow
-12.4%
Cash-on-Cash Return
3.4%
Cap rate
0.5%
Rent to Value Ratio
Active
$445,000
3
bds
|
2
ba
|
2,508
sqft
|
built
1998
2233 Hansford Pass, Buford, GA 30519
$-823
Cash flow
-9.6%
Cash-on-Cash Return
4.0%
Cap rate
0.5%
Rent to Value Ratio
Active
$395,000
3
bds
|
0
ba
|
0
sqft
|
built
2021
2378 Morgan Creek Rd, Buford, GA 30519
$-782
Cash flow
-10.3%
Cash-on-Cash Return
3.8%
Cap rate
0.6%
Rent to Value Ratio
Active
$965,000
5
bds
|
0
ba
|
5,788
sqft
|
built
2007
2539 Sagebrush Trl, Buford, GA 30519
$-3,646
Cash flow
-19.7%
Cash-on-Cash Return
1.7%
Cap rate
0.3%
Rent to Value Ratio
Active
$625,000
4
bds
|
0
ba
|
4,562
sqft
|
built
1998
2832 Windrush Dr, Buford, GA 30518
$-1,588
Cash flow
-13.3%
Cash-on-Cash Return
3.2%
Cap rate
0.5%
Rent to Value Ratio
Active
$419,000
4
bds
|
0
ba
|
2,162
sqft
|
built
2000
4189 Duncan Ives Dr, Buford, GA 30519
$-1,010
Cash flow
-12.6%
Cash-on-Cash Return
3.4%
Cap rate
0.6%
Rent to Value Ratio
Active
$424,900
3
bds
|
0
ba
|
0
sqft
|
built
2021
2060 Lanier Harbor Pt, Buford, GA 30518
$-558
Cash flow
-6.9%
Cash-on-Cash Return
4.7%
Cap rate
0.6%
Rent to Value Ratio
Active
$489,900
4
bds
|
3
ba
|
0
sqft
|
built
2001
3824 Smith Creek Ct, Buford, GA 30519
$-1,119
Cash flow
-11.9%
Cash-on-Cash Return
3.4%
Cap rate
0.5%
Rent to Value Ratio
Active
$925,000
4
bds
|
0
ba
|
0
sqft
|
built
2006
3099 Hidden Falls Dr, Buford, GA 30519
$-3,320
Cash flow
-18.7%
Cash-on-Cash Return
2.0%
Cap rate
0.3%
Rent to Value Ratio
Active
$749,900
4
bds
|
0
ba
|
3,298
sqft
|
built
2004
3217 Aberrone Pl, Buford, GA 30519
$-2,382
Cash flow
-16.6%
Cash-on-Cash Return
2.5%
Cap rate
0.4%
Rent to Value Ratio

Active
$605,000
4
bds
|
0
ba
|
0
sqft
|
built
1996
7025 Bavarian Wood Pl, Buford, GA 30518
$-1,742
Cash flow
-15.0%
Cash-on-Cash Return
2.7%
Cap rate
0.5%
Rent to Value Ratio

Active
$725,000
2
bds
|
3
ba
|
1,936
sqft
|
built
1977
6077 Lake Lanier Heights Rd, Buford, GA 30518
$-2,518
Cash flow
-18.1%
Cash-on-Cash Return
2.1%
Cap rate
0.4%
Rent to Value Ratio
Active
$549,900
6
bds
|
0
ba
|
3,628
sqft
|
built
2003
4591 Millstone Walk Dr, Buford, GA 30519
$-1,569
Cash flow
-14.9%
Cash-on-Cash Return
2.7%
Cap rate
0.5%
Rent to Value Ratio
Active
$745,000
7
bds
|
0
ba
|
3,246
sqft
|
built
2002
4046 Creekview Ridge Dr, Buford, GA 30518
$-2,458
Cash flow
-17.2%
Cash-on-Cash Return
2.3%
Cap rate
0.4%
Rent to Value Ratio

Active
$415,000
3
bds
|
0
ba
|
1,898
sqft
|
built
2021
1969 Lanier Harbor Pt, Buford, GA 30518
$-738
Cash flow
-9.3%
Cash-on-Cash Return
4.1%
Cap rate
0.6%
Rent to Value Ratio

Active
$615,000
5
bds
|
0
ba
|
3,957
sqft
|
built
2003
2359 Saint Kennedy Ln, Buford, GA 30518
$-1,906
Cash flow
-16.2%
Cash-on-Cash Return
2.5%
Cap rate
0.5%
Rent to Value Ratio

Active
$1,500,000
6
bds
|
0
ba
|
4,591
sqft
|
built
2022
103 Maddox Rd, Buford, GA 30518
$-3,308
Cash flow
-11.5%
Cash-on-Cash Return
3.6%
Cap rate
0.5%
Rent to Value Ratio

Active
$374,900
3
bds
|
0
ba
|
0
sqft
|
built
1985
2031 Dennis Pl, Buford, GA 30519
$-683
Cash flow
-9.5%
Cash-on-Cash Return
4.0%
Cap rate
0.6%
Rent to Value Ratio
Active
$499,900
4
bds
|
0
ba
|
2,297
sqft
|
built
1995
3560 Elinburg Dr, Buford, GA 30519
$-1,165
Cash flow
-12.2%
Cash-on-Cash Return
3.5%
Cap rate
0.6%
Rent to Value Ratio
Active
$849,900
5
bds
|
0
ba
|
4,614
sqft
|
built
2005
2452 Stone Manor Dr, Buford, GA 30519
$-2,589
Cash flow
-15.9%
Cash-on-Cash Return
2.6%
Cap rate
0.5%
Rent to Value Ratio
Active
$747,887
5
bds
|
0
ba
|
3,180
sqft
|
built
2018
4895 Sterling Close, Buford, GA 30518
$-1,869
Cash flow
-13.0%
Cash-on-Cash Return
3.1%
Cap rate
0.5%
Rent to Value Ratio
Active
$435,000
4
bds
|
0
ba
|
2,138
sqft
|
built
2001
3066 Gem Creek Rd, Buford, GA 30519
$-1,235
Cash flow
-14.8%
Cash-on-Cash Return
2.9%
Cap rate
0.5%
Rent to Value Ratio
Active
$799,000
7
bds
|
8
ba
|
0
sqft
|
built
1987
2012 Arbor Springs Way, Buford, GA 30519
$-3,031
Cash flow
-19.8%
Cash-on-Cash Return
1.7%
Cap rate
0.4%
Rent to Value Ratio
Active
$399,900
3
bds
|
0
ba
|
1,480
sqft
|
built
1992
2105 Huntington Hill Trce, Buford, GA 30519
$-678
Cash flow
-8.8%
Cash-on-Cash Return
4.2%
Cap rate
0.6%
Rent to Value Ratio
Active
$330,000
3
bds
|
0
ba
|
1,684
sqft
|
built
2016
2725 Morgan Glen Rd, Buford, GA 30519
$-757
Cash flow
-12.0%
Cash-on-Cash Return
3.5%
Cap rate
0.6%
Rent to Value Ratio
Active
$482,500
4
bds
|
0
ba
|
2,600
sqft
|
built
2013
2030 Beyers Landing Dr, Buford, GA 30519
$-1,060
Cash flow
-11.5%
Cash-on-Cash Return
3.6%
Cap rate
0.5%
Rent to Value Ratio
Active
$704,000
3
bds
|
0
ba
|
2,976
sqft
|
built
1964
2410 Thrasher Rd, Buford, GA 30519
$-2,092
Cash flow
-15.5%
Cash-on-Cash Return
2.7%
Cap rate
0.4%
Rent to Value Ratio
Active
$525,000
5
bds
|
3
ba
|
0
sqft
|
built
2018
2300 Ivy Birch Ln, Buford, GA 30519
$-1,222
Cash flow
-12.1%
Cash-on-Cash Return
3.4%
Cap rate
0.6%
Rent to Value Ratio