Burnham, IL Investment Properties for Sale
Browse homes for sale and investment properties in Burnham, IL. Refine your search by price, property type, or more.
Best cash flowing properties in Burnham, IL
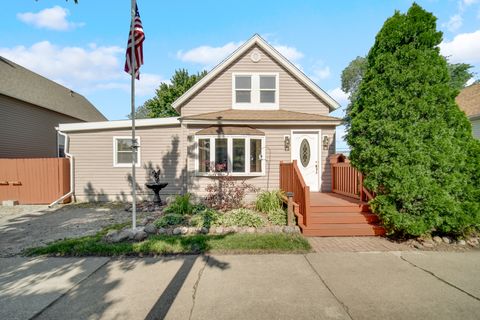
Active
$234,900
5
bds
|
2
ba
|
2,900
sqft
|
built
1893
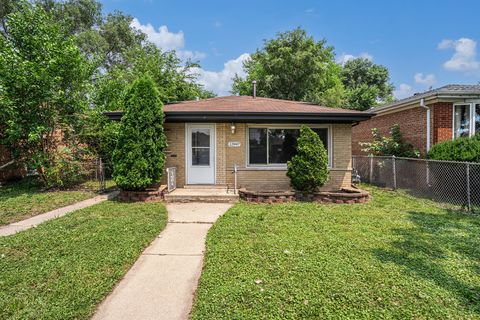
14020 S Green Bay Ave, Burnham, IL 60633
$388
Cash flow
8.6%
Cash-on-Cash Return
7.7%
Cap rate
1.2%
Rent to Value Ratio
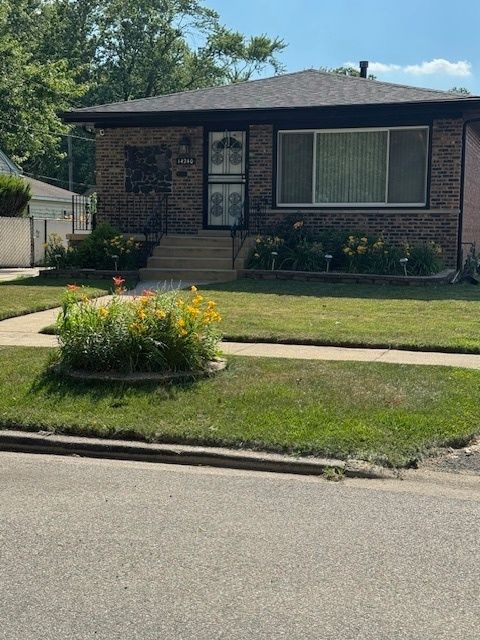
Active
$209,900
3
bds
|
2
ba
|
1,091
sqft
|
built
1971
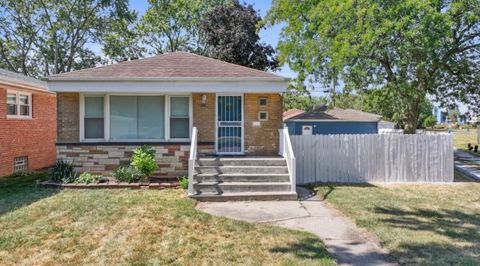
14240 S Manistee Ave, Burnham, IL 60633
$-37
Cash flow
-0.9%
Cash-on-Cash Return
5.5%
Cap rate
1.0%
Rent to Value Ratio
7 out of 7 properties for sale in Burnham, IL
Limited Results Shown
Create a free account, or log in to reveal all property listings and enjoy the complete experience.
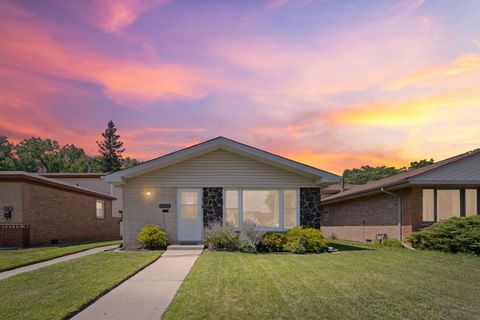
Active
$230,000
3
bds
|
2
ba
|
1,100
sqft
|
built
1971
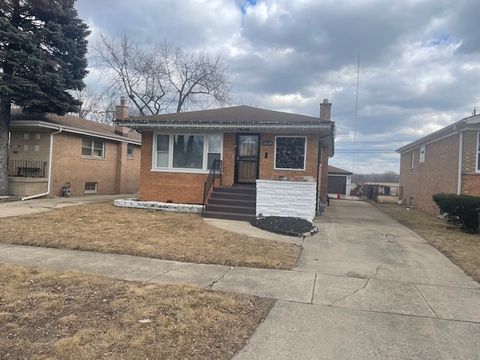
14112 S Saginaw Ave, Burnham, IL 60633
$-240
Cash flow
-5.4%
Cash-on-Cash Return
4.4%
Cap rate
0.9%
Rent to Value Ratio
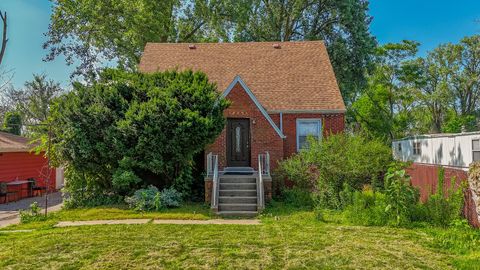
Active
$224,900
3
bds
|
2
ba
|
939
sqft
|
built
1953
2910 E 138th Pl, Burnham, IL 60633
$-180
Cash flow
-4.2%
Cash-on-Cash Return
4.7%
Cap rate
1.0%
Rent to Value Ratio
Active
$164,900
3
bds
|
2
ba
|
1,078
sqft
|
built
1972
13947 S Saginaw Ave, Burnham, IL 60633
$-139
Cash flow
-4.4%
Cash-on-Cash Return
4.7%
Cap rate
1.2%
Rent to Value Ratio
Active
$215,000
3
bds
|
2
ba
|
1,074
sqft
|
built
1957
14322 S Hoxie Ave, Burnham, IL 60633
$-264
Cash flow
-6.4%
Cash-on-Cash Return
4.2%
Cap rate
1.1%
Rent to Value Ratio
Active
$235,000
3
bds
|
2
ba
|
0
sqft
|
built
1967
14119 S Manistee Ave, Burnham, IL 60633
$-173
Cash flow
-3.8%
Cash-on-Cash Return
4.8%
Cap rate
0.9%
Rent to Value Ratio