Ventura County Investment Properties for Sale
Browse homes for sale and investment properties in Ventura County. Refine your search by price, property type, or more.
Best cash flowing properties in Ventura County
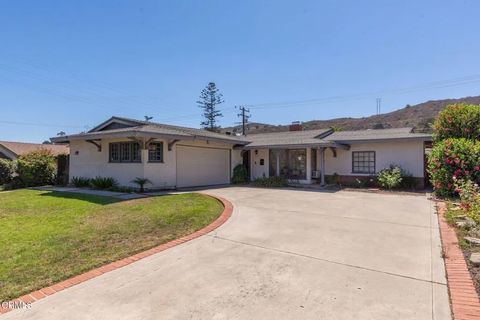
Active
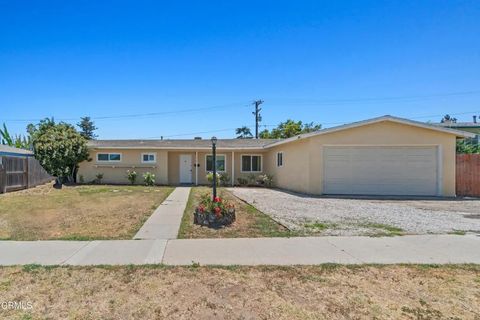
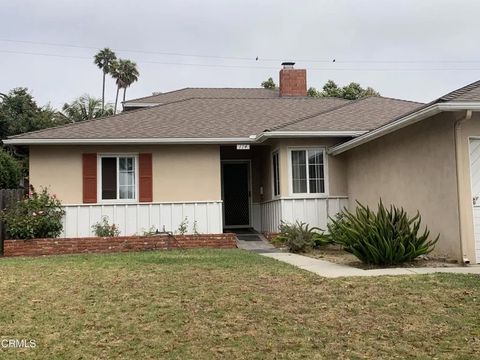
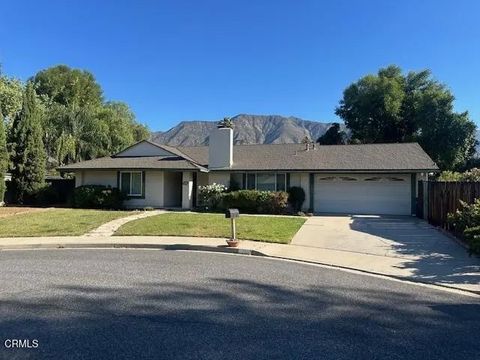
$762,900
4
bds
|
2
ba
|
1,348
sqft
|
built
1960
2538 Dumetz St, Camarillo, CA 93010
$-1,167
Cash flow
-8.0%
Cash-on-Cash Return
4.2%
Cap rate
0.5%
Rent to Value Ratio
Active
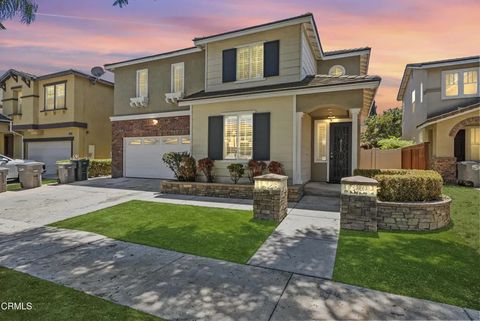
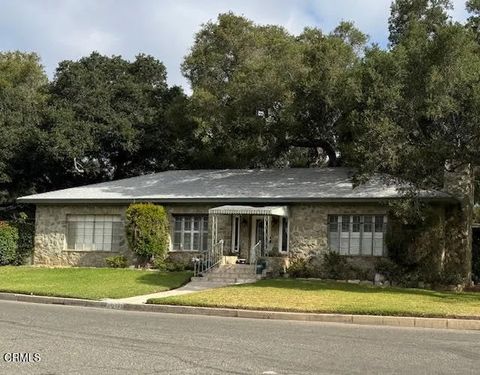
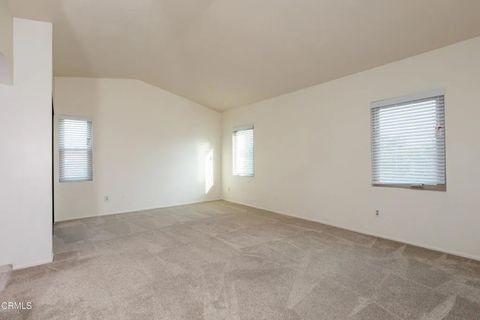
$995,000
5
bds
|
3
ba
|
3,032
sqft
|
built
2003
1424 Vida Dr, Oxnard, CA 93030
$-1,236
Cash flow
-6.5%
Cash-on-Cash Return
4.6%
Cap rate
0.6%
Rent to Value Ratio
65 out of 694 properties for sale in Ventura County
Limited Results Shown
Create a free account, or log in to reveal all property listings and enjoy the complete experience.
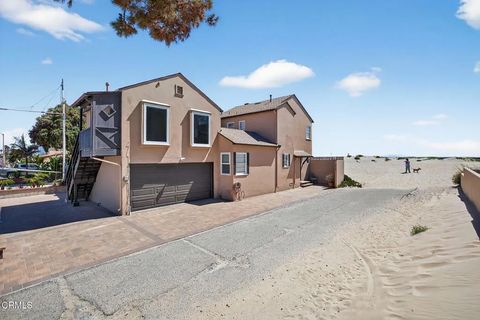
Active
$2,995,000
3
bds
|
2
ba
|
0
sqft
|
built
1962
541 Cuesta Del Mar Dr, Oxnard, CA 93033
$-12,384
Cash flow
-21.6%
Cash-on-Cash Return
1.1%
Cap rate
0.1%
Rent to Value Ratio
Active
$739,000
2
bds
|
1
ba
|
934
sqft
|
built
1962
53 Prospect St, Oak View, CA 93022
$-1,529
Cash flow
-10.8%
Cash-on-Cash Return
3.6%
Cap rate
0.4%
Rent to Value Ratio
Active
$750,000
2
bds
|
1
ba
|
1,705
sqft
|
built
1890
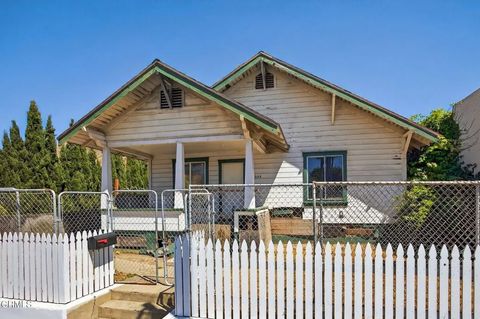
234 N Ventura Ave, Ventura, CA 93001
$-1,998
Cash flow
-13.9%
Cash-on-Cash Return
2.9%
Cap rate
0.3%
Rent to Value Ratio
Active
$999,000
3
bds
|
2
ba
|
2,025
sqft
|
built
1970
7802 El Dorado St, Ventura, CA 93004
$-2,291
Cash flow
-12.0%
Cash-on-Cash Return
3.3%
Cap rate
0.4%
Rent to Value Ratio
Active
$1,999,999
4
bds
|
5
ba
|
2,662
sqft
|
built
1980
4844 Oceanaire St, Oxnard, CA 93035
$-5,697
Cash flow
-14.9%
Cash-on-Cash Return
2.6%
Cap rate
0.3%
Rent to Value Ratio
Active
$899,000
4
bds
|
4
ba
|
2,205
sqft
|
built
1983
467 W Simpson St, Ventura, CA 93001
$-2,614
Cash flow
-15.2%
Cash-on-Cash Return
2.6%
Cap rate
0.3%
Rent to Value Ratio
Active
$899,999
6
bds
|
3
ba
|
0
sqft
|
built
1928
182 E Mc Farlane Dr, Ventura, CA 93001
$-2,343
Cash flow
-13.6%
Cash-on-Cash Return
2.9%
Cap rate
0.4%
Rent to Value Ratio
Active
$7,850,000
4
bds
|
5
ba
|
4,000
sqft
|
built
1939
12615 Koenigstein Rd, Santa Paula, CA 93060
$-37,762
Cash flow
-25.1%
Cash-on-Cash Return
0.3%
Cap rate
0.0%
Rent to Value Ratio

Active
$925,000
3
bds
|
2
ba
|
1,244
sqft
|
built
1959
489 Mara Ave, Ventura, CA 93004
$-2,193
Cash flow
-12.4%
Cash-on-Cash Return
3.2%
Cap rate
0.4%
Rent to Value Ratio
Active
$750,000
2
bds
|
2
ba
|
1,511
sqft
|
built
1987
1069 Belleza St, Camarillo, CA 93012
$-1,366
Cash flow
-9.5%
Cash-on-Cash Return
3.9%
Cap rate
0.5%
Rent to Value Ratio
Active
$2,600,000
6
bds
|
3
ba
|
2,936
sqft
|
built
1965
2851 Seahorse Ave, Ventura, CA 93001
$-8,248
Cash flow
-16.6%
Cash-on-Cash Return
2.3%
Cap rate
0.3%
Rent to Value Ratio
Active
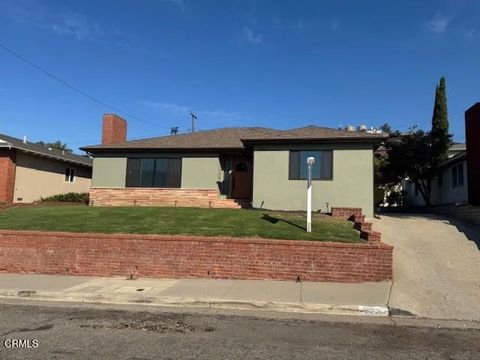
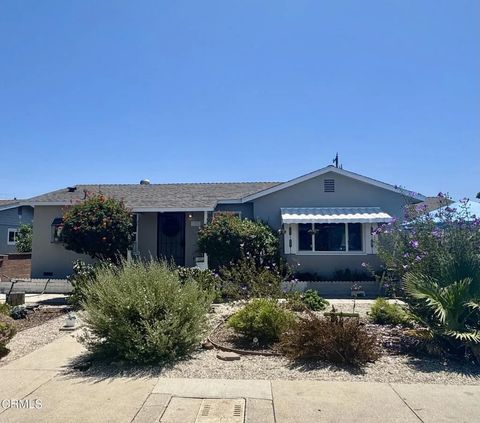
$795,000
4
bds
|
2
ba
|
1,378
sqft
|
built
1957
1214 Mariposa Dr, Santa Paula, CA 93060
$-1,536
Cash flow
-10.1%
Cash-on-Cash Return
3.7%
Cap rate
0.5%
Rent to Value Ratio
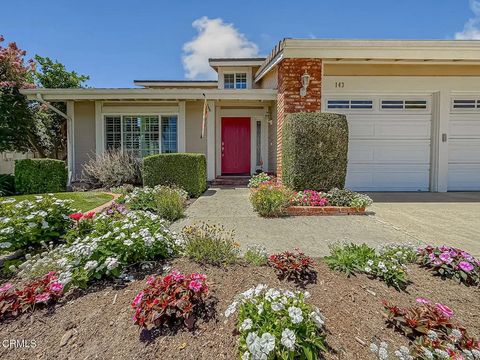
Active
$1,299,000
4
bds
|
3
ba
|
2,269
sqft
|
built
1982
143 Flora Vista Ave, Camarillo, CA 93012
$-3,463
Cash flow
-13.9%
Cash-on-Cash Return
2.9%
Cap rate
0.3%
Rent to Value Ratio
Active
$999,000
3
bds
|
3
ba
|
2,077
sqft
|
built
1977
196 Mariposa Dr, Camarillo, CA 93012
$-2,015
Cash flow
-10.5%
Cash-on-Cash Return
3.6%
Cap rate
0.4%
Rent to Value Ratio
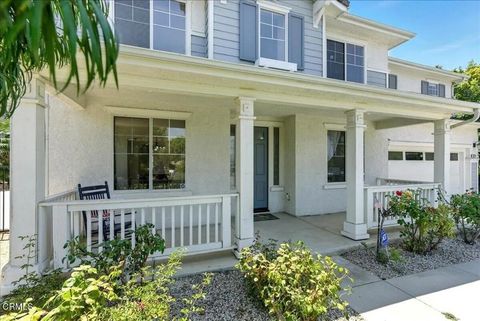
Active
$1,099,000
5
bds
|
3
ba
|
3,136
sqft
|
built
1999
3172 China Fir Pl, Simi Valley, CA 93065
$-1,370
Cash flow
-6.5%
Cash-on-Cash Return
4.6%
Cap rate
0.6%
Rent to Value Ratio
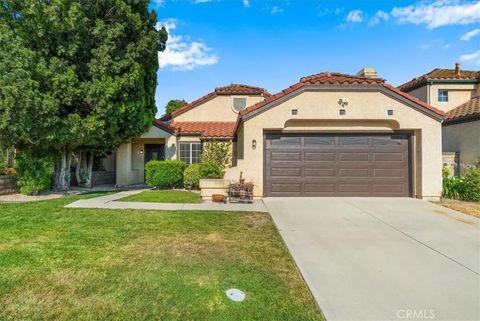
Active
$899,000
3
bds
|
2
ba
|
1,800
sqft
|
built
1989
2538 Lowell Ct, Simi Valley, CA 93065
$-1,372
Cash flow
-8.0%
Cash-on-Cash Return
4.2%
Cap rate
0.5%
Rent to Value Ratio
Active
$1,375,000
5
bds
|
3
ba
|
2,510
sqft
|
built
1957
114 San Marino Ave, Ventura, CA 93003
$-3,503
Cash flow
-13.3%
Cash-on-Cash Return
3.0%
Cap rate
0.4%
Rent to Value Ratio
Active
$759,000
3
bds
|
2
ba
|
1,647
sqft
|
built
1947
1239 Fern Oaks Dr, Santa Paula, CA 93060
$-1,423
Cash flow
-9.8%
Cash-on-Cash Return
3.8%
Cap rate
0.5%
Rent to Value Ratio
Active
$859,000
3
bds
|
2
ba
|
1,706
sqft
|
built
1953
963 La Vuelta Pl, Santa Paula, CA 93060
$-1,653
Cash flow
-10.0%
Cash-on-Cash Return
3.8%
Cap rate
0.5%
Rent to Value Ratio
Active
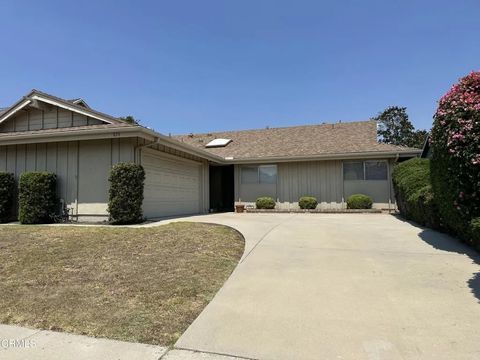
$869,900
4
bds
|
3
ba
|
1,787
sqft
|
built
1965
874 Gardner Ave, Ventura, CA 93004
$-1,570
Cash flow
-9.4%
Cash-on-Cash Return
3.9%
Cap rate
0.5%
Rent to Value Ratio
Active
$2,989,500
3
bds
|
3
ba
|
0
sqft
|
built
1941
3025 Ocean Dr, Oxnard, CA 93035
$-11,644
Cash flow
-20.3%
Cash-on-Cash Return
1.4%
Cap rate
0.2%
Rent to Value Ratio
Active
$975,000
3
bds
|
3
ba
|
1,485
sqft
|
built
1976
3310 Sunset Ln, Oxnard, CA 93035
$-2,584
Cash flow
-13.8%
Cash-on-Cash Return
2.9%
Cap rate
0.5%
Rent to Value Ratio
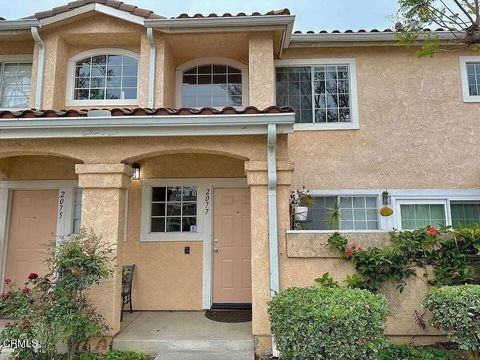
Active
$589,000
2
bds
|
2
ba
|
1,362
sqft
|
built
1990
2077 Blackberry Cir, Oxnard, CA 93036
$-1,579
Cash flow
-14.0%
Cash-on-Cash Return
2.9%
Cap rate
0.5%
Rent to Value Ratio

Active
$1,389,000
4
bds
|
3
ba
|
3,200
sqft
|
built
1978
1271 Cliff Ave, Fillmore, CA 93015
$-3,022
Cash flow
-11.4%
Cash-on-Cash Return
3.5%
Cap rate
0.4%
Rent to Value Ratio
Active
$1,675,000
4
bds
|
3
ba
|
2,584
sqft
|
built
1989
2124 Cervato Dr, Camarillo, CA 93012
$-4,537
Cash flow
-14.1%
Cash-on-Cash Return
2.8%
Cap rate
0.3%
Rent to Value Ratio
Active
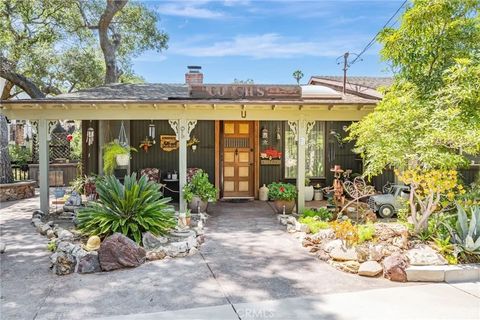
$949,000
3
bds
|
2
ba
|
1,449
sqft
|
built
1976
1120 Sunnyglenn Ave, Ojai, CA 93023
$-1,694
Cash flow
-9.3%
Cash-on-Cash Return
3.9%
Cap rate
0.5%
Rent to Value Ratio
Active
$1,195,000
4
bds
|
3
ba
|
2,415
sqft
|
built
1984
1675 Arroyo Seco Dr, Ventura, CA 93004
$-2,938
Cash flow
-12.8%
Cash-on-Cash Return
3.1%
Cap rate
0.4%
Rent to Value Ratio
Active
$899,000
5
bds
|
3
ba
|
0
sqft
|
built
1950
120 Palm Dr, Camarillo, CA 93010
$-1,786
Cash flow
-10.4%
Cash-on-Cash Return
3.7%
Cap rate
0.4%
Rent to Value Ratio
Active
$1,197,000
2
bds
|
2
ba
|
1,935
sqft
|
built
1948
1126 Katherine Rd, Simi Valley, CA 93063
$-2,258
Cash flow
-9.8%
Cash-on-Cash Return
3.8%
Cap rate
0.5%
Rent to Value Ratio
Active
$1,250,000
3
bds
|
3
ba
|
2,392
sqft
|
built
1979
191 Harborview Ct, Ventura, CA 93003
$-2,802
Cash flow
-11.7%
Cash-on-Cash Return
3.4%
Cap rate
0.4%
Rent to Value Ratio
Active
$895,000
2
bds
|
1
ba
|
1,232
sqft
|
built
1926
253 Cedar St, Ventura, CA 93001
$-2,042
Cash flow
-11.9%
Cash-on-Cash Return
3.3%
Cap rate
0.4%
Rent to Value Ratio
Active
$1,869,000
4
bds
|
3
ba
|
2,057
sqft
|
built
2020
572 Skyline Rd, Ventura, CA 93003
$-6,346
Cash flow
-17.7%
Cash-on-Cash Return
2.0%
Cap rate
0.2%
Rent to Value Ratio
Active
$1,695,000
2
bds
|
3
ba
|
2,216
sqft
|
built
2020
5572 Rainier St, Ventura, CA 93003
$-5,052
Cash flow
-15.6%
Cash-on-Cash Return
2.5%
Cap rate
0.3%
Rent to Value Ratio
Active
$1,999,000
4
bds
|
4
ba
|
0
sqft
|
built
1940
136 N Garfield Ave, Oxnard, CA 93030
$-8,176
Cash flow
-21.3%
Cash-on-Cash Return
1.2%
Cap rate
0.1%
Rent to Value Ratio
Active
$1,300,000
6
bds
|
4
ba
|
0
sqft
|
built
1983
941 Dunes St, Oxnard, CA 93035
$-4,159
Cash flow
-16.7%
Cash-on-Cash Return
2.2%
Cap rate
0.3%
Rent to Value Ratio
Active
$1,450,000
6
bds
|
4
ba
|
3,717
sqft
|
built
1966
2266 Adrian St, Thousand Oaks, CA 91320
$-3,882
Cash flow
-14.0%
Cash-on-Cash Return
2.9%
Cap rate
0.3%
Rent to Value Ratio
Active
$1,599,900
5
bds
|
4
ba
|
0
sqft
|
built
1973
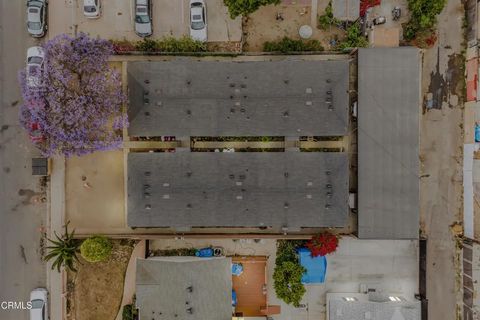
4941 Catamaran St, Oxnard, CA 93035
$-5,675
Cash flow
-18.5%
Cash-on-Cash Return
1.8%
Cap rate
0.2%
Rent to Value Ratio
Active
$2,249,000
3
bds
|
2
ba
|
2,438
sqft
|
built
1971
1277 Devon Ln, Ventura, CA 93001
$-6,887
Cash flow
-16.0%
Cash-on-Cash Return
2.4%
Cap rate
0.3%
Rent to Value Ratio