California Investment Properties for Sale
Browse homes for sale and investment properties in California. Refine your search by price, property type, or more.
Best cash flowing properties in California
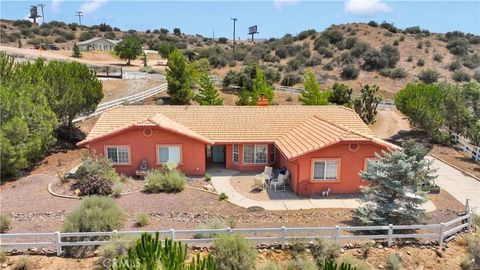
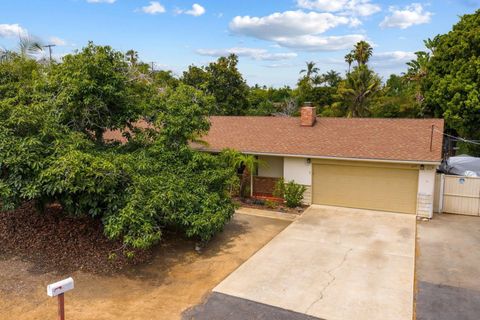
Active
$350,000
4
bds
|
2
ba
|
2,444
sqft
|
built
1951
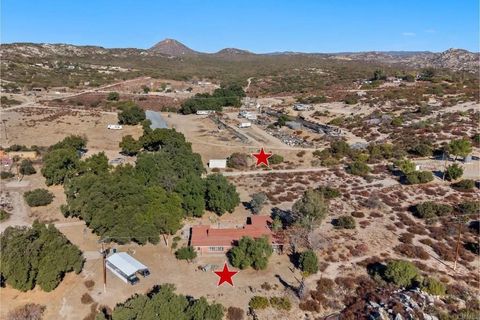
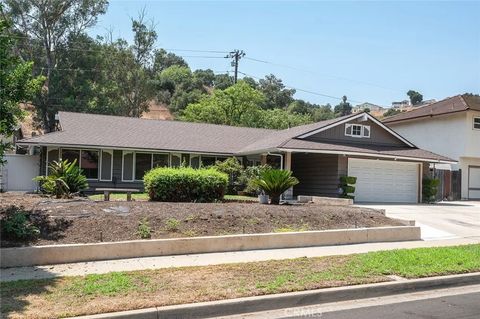
1536 Campo Truck Trl, Campo, CA 91906
$921
Cash flow
13.7%
Cash-on-Cash Return
9.2%
Cap rate
1.1%
Rent to Value Ratio
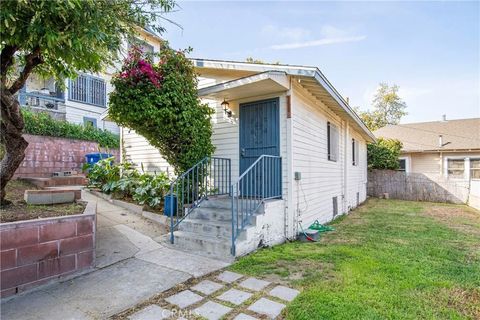
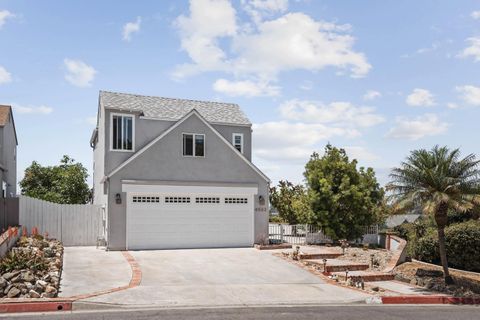
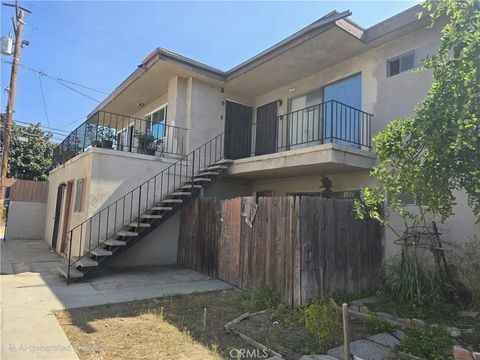
Active
$415,000
3
bds
|
2
ba
|
2,124
sqft
|
built
1987
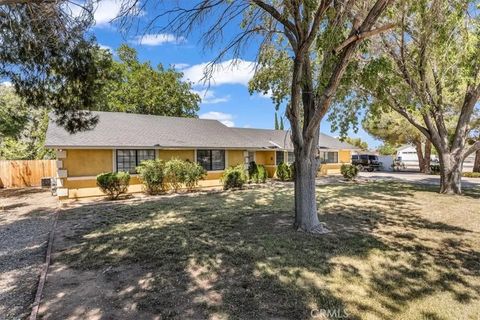
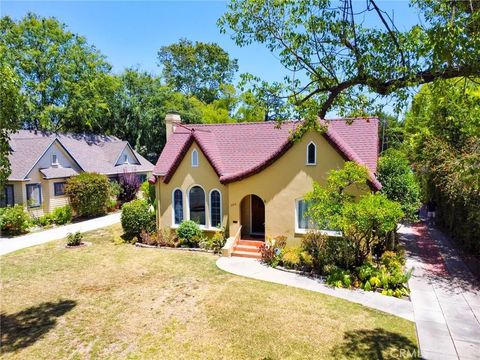
12856 Morning Star Rd, Apple Valley, CA 92308
$-235
Cash flow
-3.0%
Cash-on-Cash Return
5.4%
Cap rate
0.7%
Rent to Value Ratio
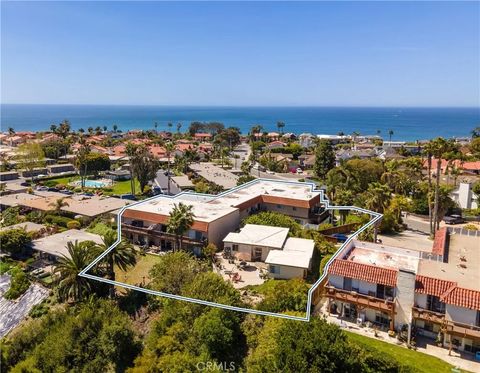
4,933 out of 27,048 properties for sale in California
Limited Results Shown
Create a free account, or log in to reveal all property listings and enjoy the complete experience.
Active
$1,499,000
6
bds
|
4
ba
|
0
sqft
|
built
1958
1030 W Romneya Dr, Anaheim, CA 92801
$-5,096
Cash flow
-17.7%
Cash-on-Cash Return
2.0%
Cap rate
0.2%
Rent to Value Ratio

Active
$999,000
2
bds
|
1
ba
|
1,650
sqft
|
built
1970
819 Georgia St, Imperial Beach, CA 91932
$-2,636
Cash flow
-13.8%
Cash-on-Cash Return
2.9%
Cap rate
0.4%
Rent to Value Ratio
Active
$425,000
4
bds
|
2
ba
|
0
sqft
|
built
1955
752 E 6th St, Chico, CA 95928
$-769
Cash flow
-9.4%
Cash-on-Cash Return
3.9%
Cap rate
0.5%
Rent to Value Ratio
Active
$544,900
3
bds
|
2
ba
|
1,804
sqft
|
built
1998
6599 Oak Hill Rd, Oak Hills, CA 92344
$-823
Cash flow
-7.9%
Cash-on-Cash Return
4.3%
Cap rate
0.5%
Rent to Value Ratio

Active
$1,425,000
4
bds
|
2
ba
|
1,329
sqft
|
built
1958
2122 March Pl, San Diego, CA 92110
$-3,687
Cash flow
-13.5%
Cash-on-Cash Return
3.0%
Cap rate
0.4%
Rent to Value Ratio

Active
$999,000
6
bds
|
0
ba
|
0
sqft
|
built
1924
2525 S Cochran Ave, Los Angeles, CA 90016
$-2,843
Cash flow
-14.8%
Cash-on-Cash Return
2.7%
Cap rate
0.3%
Rent to Value Ratio

Active
$1,999,999
7
bds
|
4
ba
|
0
sqft
|
built
1954
1701 Lake St, Huntington Beach, CA 92648
$-5,946
Cash flow
-15.5%
Cash-on-Cash Return
2.1%
Cap rate
0.3%
Rent to Value Ratio
Active
$554,900
2
bds
|
1
ba
|
684
sqft
|
built
1906
3580 Griffin Ave, Los Angeles, CA 90031
$-667
Cash flow
-6.3%
Cash-on-Cash Return
4.6%
Cap rate
0.6%
Rent to Value Ratio
Active
$1,175,000
3
bds
|
3
ba
|
1,505
sqft
|
built
1988
14811 Summerbreeze Way, San Diego, CA 92128
$-2,894
Cash flow
-12.9%
Cash-on-Cash Return
3.1%
Cap rate
0.4%
Rent to Value Ratio
Active
$880,000
2
bds
|
1
ba
|
2,148
sqft
|
built
1942
2171 W 26th Pl, Los Angeles, CA 90018
$-1,069
Cash flow
-6.3%
Cash-on-Cash Return
4.6%
Cap rate
0.6%
Rent to Value Ratio
Active
$675,000
4
bds
|
2
ba
|
0
sqft
|
built
1938
3556 El Sereno Ave, Los Angeles, CA 90032
$-1,412
Cash flow
-10.9%
Cash-on-Cash Return
3.6%
Cap rate
0.4%
Rent to Value Ratio
Active
$1,250,000
9
bds
|
0
ba
|
0
sqft
|
built
2019
1711 W 60th St, Los Angeles, CA 90047
$-4,389
Cash flow
-18.3%
Cash-on-Cash Return
1.9%
Cap rate
0.2%
Rent to Value Ratio

Active
$1,674,980
5
bds
|
3
ba
|
5,188
sqft
|
built
2006
13170 Rancho Heights Rd, Pala, CA 92059
$-2,329
Cash flow
-7.3%
Cash-on-Cash Return
4.4%
Cap rate
0.5%
Rent to Value Ratio

Active
$1,600,000
4
bds
|
6
ba
|
0
sqft
|
built
1950
3107 Hollycrest Dr, Los Angeles, CA 90068
$-6,158
Cash flow
-20.1%
Cash-on-Cash Return
1.4%
Cap rate
0.2%
Rent to Value Ratio
Active
$2,695,000
4
bds
|
5
ba
|
2,446
sqft
|
built
1924
3130 2nd Ave, San Diego, CA 92103
$-7,348
Cash flow
-14.2%
Cash-on-Cash Return
2.8%
Cap rate
0.3%
Rent to Value Ratio

Active
$1,365,000
3
bds
|
2
ba
|
1,360
sqft
|
built
1985
7020 Snapdragon Dr, Carlsbad, CA 92011
$-3,606
Cash flow
-13.8%
Cash-on-Cash Return
2.9%
Cap rate
0.4%
Rent to Value Ratio
Active
$975,000
3
bds
|
2
ba
|
1,733
sqft
|
built
1955
360 Alpine Ave, Chula Vista, CA 91910
$-2,239
Cash flow
-12.0%
Cash-on-Cash Return
3.3%
Cap rate
0.4%
Rent to Value Ratio
Active
$1,249,999
4
bds
|
2
ba
|
2,268
sqft
|
built
1964
21128 Trigger Ln, Diamond Bar, CA 91765
$-3,285
Cash flow
-13.7%
Cash-on-Cash Return
2.9%
Cap rate
0.4%
Rent to Value Ratio
Active
$1,888,000
4
bds
|
3
ba
|
0
sqft
|
built
1951
900 S Los Robles Ave, Pasadena, CA 91106
$-6,511
Cash flow
-18.0%
Cash-on-Cash Return
1.9%
Cap rate
0.2%
Rent to Value Ratio
Active
$895,000
2
bds
|
1
ba
|
1,152
sqft
|
built
1918
4396 Arcadia Dr, San Diego, CA 92103
$-1,490
Cash flow
-8.7%
Cash-on-Cash Return
4.1%
Cap rate
0.5%
Rent to Value Ratio

Active
$2,300,000
7
bds
|
7
ba
|
0
sqft
|
built
1952
1228 Grand Ave, San Diego, CA 92109
$-6,593
Cash flow
-15.0%
Cash-on-Cash Return
2.6%
Cap rate
0.3%
Rent to Value Ratio
Active
$1,750,000
4
bds
|
3
ba
|
2,003
sqft
|
built
1974
11646 La Colina Rd, San Diego, CA 92131
$-3,398
Cash flow
-10.1%
Cash-on-Cash Return
3.7%
Cap rate
0.5%
Rent to Value Ratio
Active
$1,695,000
4
bds
|
3
ba
|
2,132
sqft
|
built
1953
520 Grant St, Oceanside, CA 92054
$-5,121
Cash flow
-15.8%
Cash-on-Cash Return
2.4%
Cap rate
0.3%
Rent to Value Ratio
Active
$599,999
4
bds
|
3
ba
|
0
sqft
|
built
1967
8616 N Loop Blvd, California City, CA 93505
$-2,068
Cash flow
-18.0%
Cash-on-Cash Return
1.9%
Cap rate
0.2%
Rent to Value Ratio
Active
$1,645,555
3
bds
|
3
ba
|
3,153
sqft
|
built
1981
142 Yale Dr, Rancho Mirage, CA 92270
$-4,647
Cash flow
-14.7%
Cash-on-Cash Return
2.7%
Cap rate
0.5%
Rent to Value Ratio

Active
$849,000
5
bds
|
0
ba
|
0
sqft
|
built
1937
3226 Palm Ave, Lynwood, CA 90262
$-2,292
Cash flow
-14.1%
Cash-on-Cash Return
2.8%
Cap rate
0.3%
Rent to Value Ratio
Active
$1,130,000
3
bds
|
2
ba
|
1,011
sqft
|
built
1940
325 Gloria St, San Diego, CA 92113
$-3,023
Cash flow
-14.0%
Cash-on-Cash Return
2.9%
Cap rate
0.3%
Rent to Value Ratio
Active
$2,195,000
3
bds
|
2
ba
|
1,240
sqft
|
built
1966
410 E Glaucus St, Encinitas, CA 92024
$-7,235
Cash flow
-17.2%
Cash-on-Cash Return
2.1%
Cap rate
0.3%
Rent to Value Ratio
Active
$1,349,000
3
bds
|
3
ba
|
1,612
sqft
|
built
1986
4503 Carnaby Ct, Carlsbad, CA 92010
$-3,841
Cash flow
-14.9%
Cash-on-Cash Return
2.7%
Cap rate
0.3%
Rent to Value Ratio
Active
$6,000,000
9
bds
|
8
ba
|
0
sqft
|
built
27512 Del Gado Rd, San Clemente, CA 92672
$-28,200
Cash flow
-24.5%
Cash-on-Cash Return
0.4%
Cap rate
0.1%
Rent to Value Ratio
Active
$899,000
3
bds
|
2
ba
|
1,157
sqft
|
built
1954
10440 Hopland St, Bellflower, CA 90706
$-2,062
Cash flow
-12.0%
Cash-on-Cash Return
3.3%
Cap rate
0.4%
Rent to Value Ratio

Active
$824,900
4
bds
|
2
ba
|
1,908
sqft
|
built
1976
237 Durgin St, Ramona, CA 92065
$-1,687
Cash flow
-10.7%
Cash-on-Cash Return
3.6%
Cap rate
0.4%
Rent to Value Ratio

Active
$725,000
4
bds
|
2
ba
|
2,328
sqft
|
built
1930
3869 Pine Hills Rd, Julian, CA 92036
$-1,182
Cash flow
-8.5%
Cash-on-Cash Return
4.1%
Cap rate
0.5%
Rent to Value Ratio
Active
$1,200,000
9
bds
|
7
ba
|
0
sqft
|
built
1964
4642 Canoga St, Montclair, CA 91763
$-4,343
Cash flow
-18.9%
Cash-on-Cash Return
1.7%
Cap rate
0.2%
Rent to Value Ratio
Active
$469,000
4
bds
|
3
ba
|
0
sqft
|
built
1974
1008 Meier Dr, Chico, CA 95926
$-1,130
Cash flow
-12.6%
Cash-on-Cash Return
3.2%
Cap rate
0.4%
Rent to Value Ratio
Active
$925,000
3
bds
|
2
ba
|
1,244
sqft
|
built
1959
489 Mara Ave, Ventura, CA 93004
$-2,193
Cash flow
-12.4%
Cash-on-Cash Return
3.2%
Cap rate
0.4%
Rent to Value Ratio
Active
$899,000
5
bds
|
5
ba
|
3,888
sqft
|
built
2008
24625 Ledbury Rd, Oro Grande, CA 92368
$-682
Cash flow
-4.0%
Cash-on-Cash Return
5.2%
Cap rate
0.6%
Rent to Value Ratio
Active
$975,000
1
bds
|
1
ba
|
0
sqft
|
built
1940
108 W Olive Ave, Redlands, CA 92373
$-2,791
Cash flow
-14.9%
Cash-on-Cash Return
2.6%
Cap rate
0.3%
Rent to Value Ratio