Chicago, IL Investment Properties for Sale
Browse homes for sale and investment properties in Chicago, IL. Refine your search by price, property type, or more.
Best cash flowing properties in Chicago, IL

Active
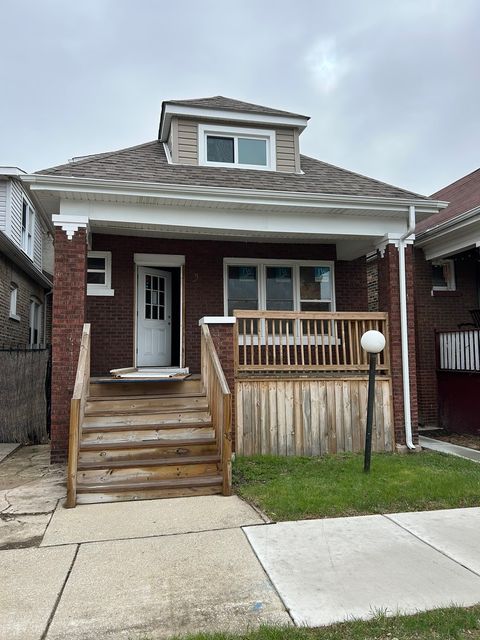
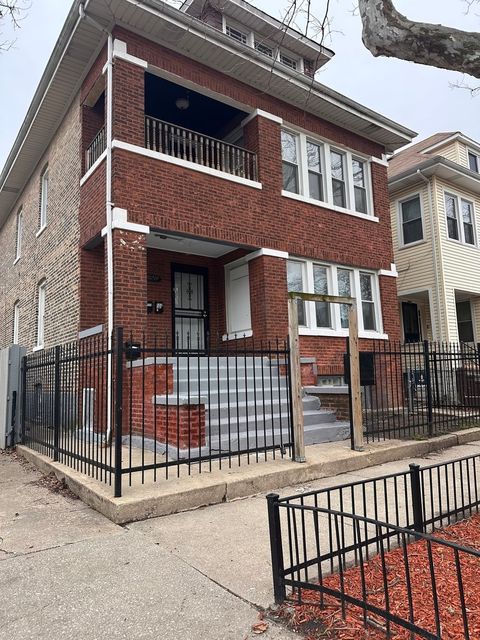
$64,900
4
bds
|
2
ba
|
1,482
sqft
|
built
1972
5700 S Lowe Ave, Chicago, IL 60621
$1,248
Cash flow
22.4%
Cash-on-Cash Return
23.1%
Cap rate
3.1%
Rent to Value Ratio
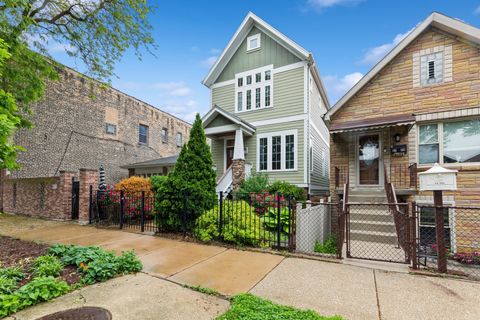
Active
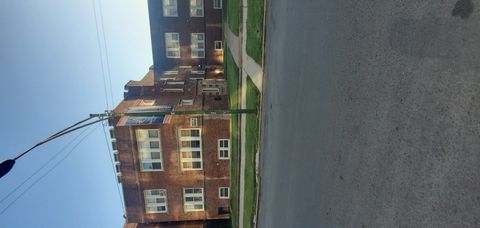
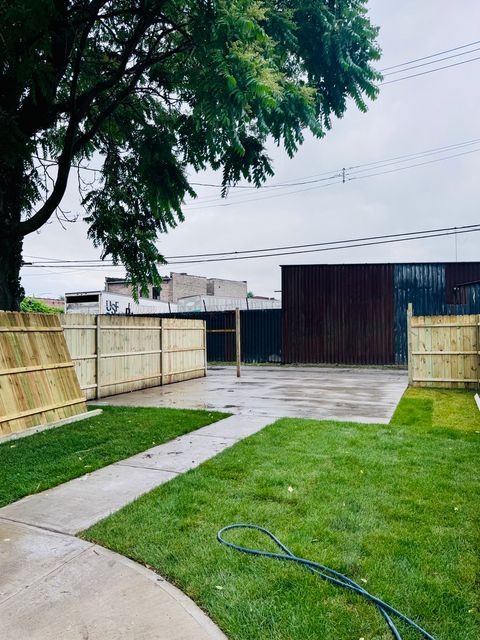
$119,900
4
bds
|
2
ba
|
1,500
sqft
|
built
1919
7825 S Rhodes Ave, Chicago, IL 60619
$440
Cash flow
19.1%
Cash-on-Cash Return
10.7%
Cap rate
1.5%
Rent to Value Ratio
3,965 out of 4,608 properties for sale in Chicago, IL
Limited Results Shown
Create a free account, or log in to reveal all property listings and enjoy the complete experience.
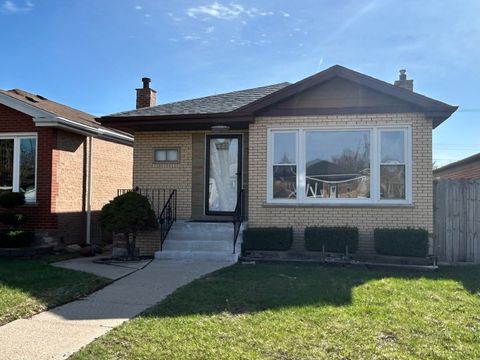
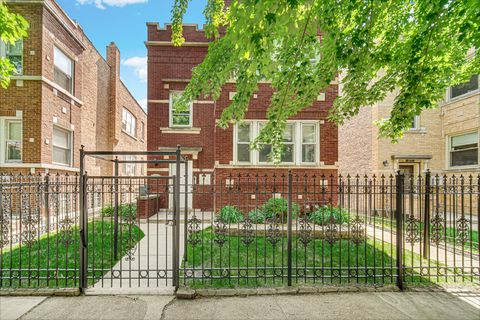
Active
$500,000
10
bds
|
4
ba
|
0
sqft
|
built
1928
8012 S Honore St, Chicago, IL 60620
$-1,504
Cash flow
-15.7%
Cash-on-Cash Return
2.7%
Cap rate
0.4%
Rent to Value Ratio
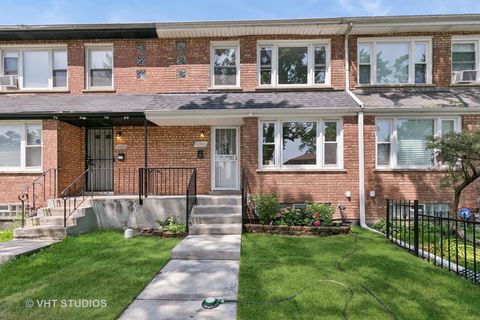
Active
$349,900
4
bds
|
3
ba
|
2,500
sqft
|
built
1925
7253 S Marshfield Ave, Chicago, IL 60636
$-699
Cash flow
-10.4%
Cash-on-Cash Return
3.9%
Cap rate
0.5%
Rent to Value Ratio
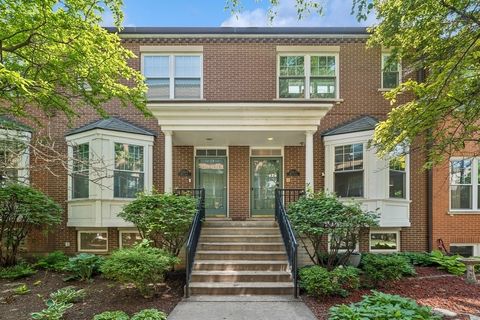
Active
$309,900
3
bds
|
2
ba
|
1,057
sqft
|
built
1958
7711 S Christiana Ave, Chicago, IL 60652
$-211
Cash flow
-3.6%
Cash-on-Cash Return
5.4%
Cap rate
0.8%
Rent to Value Ratio
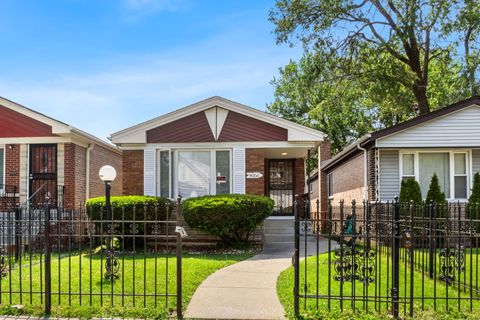
Active
$419,900
4
bds
|
2
ba
|
976
sqft
|
built
1923
4624 W Montana St, Chicago, IL 60639
$-816
Cash flow
-10.1%
Cash-on-Cash Return
3.9%
Cap rate
0.6%
Rent to Value Ratio

Active
$360,000
3
bds
|
2
ba
|
1,656
sqft
|
built
1958
5943 S Parkside Ave, Chicago, IL 60638
$-161
Cash flow
-2.3%
Cash-on-Cash Return
5.1%
Cap rate
0.8%
Rent to Value Ratio

Active
$799,000
2
bds
|
2
ba
|
2,500
sqft
|
built
1908
411 W Ontario St, Chicago, IL 60654
$-2,731
Cash flow
-17.8%
Cash-on-Cash Return
1.6%
Cap rate
0.7%
Rent to Value Ratio
Active
$64,900
4
bds
|
2
ba
|
1,482
sqft
|
built
1972
5700 S Lowe Ave, Chicago, IL 60621
$1,248
Cash flow
22.4%
Cash-on-Cash Return
23.1%
Cap rate
3.1%
Rent to Value Ratio

Active
$624,700
6
bds
|
2
ba
|
0
sqft
|
built
1921
4846 W Roscoe St, Chicago, IL 60641
$-2,001
Cash flow
-16.7%
Cash-on-Cash Return
1.8%
Cap rate
0.4%
Rent to Value Ratio

Active
$437,000
4
bds
|
2
ba
|
1,508
sqft
|
built
1924
2947 S Farrell St, Chicago, IL 60608
$-1,111
Cash flow
-13.3%
Cash-on-Cash Return
2.6%
Cap rate
0.5%
Rent to Value Ratio

Active
$629,999
3
bds
|
3
ba
|
3,242
sqft
|
built
1922
2822 N Keating Ave, Chicago, IL 60641
$-1,726
Cash flow
-14.3%
Cash-on-Cash Return
2.4%
Cap rate
0.4%
Rent to Value Ratio
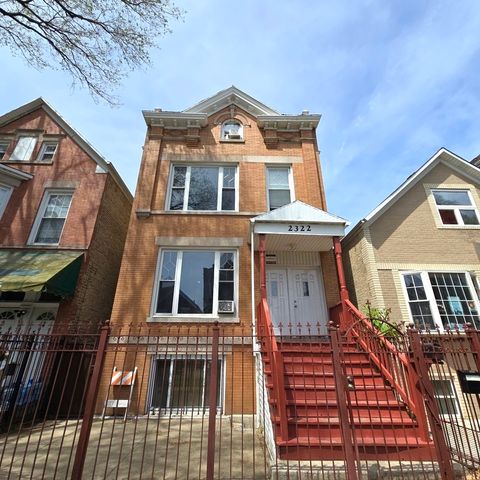
Active
$400,000
6
bds
|
4
ba
|
0
sqft
|
built
1889
2322 S Trumbull Ave, Chicago, IL 60623
$-1,298
Cash flow
-16.9%
Cash-on-Cash Return
2.4%
Cap rate
0.4%
Rent to Value Ratio
Active
$875,000
5
bds
|
3
ba
|
0
sqft
|
built
1931
4018 N Maplewood Ave, Chicago, IL 60618
$-3,577
Cash flow
-21.3%
Cash-on-Cash Return
1.4%
Cap rate
0.4%
Rent to Value Ratio
Active
$527,000
2
bds
|
3
ba
|
1,700
sqft
|
built
2005
4660 N Winthrop Ave, Chicago, IL 60640
$-1,354
Cash flow
-13.4%
Cash-on-Cash Return
3.2%
Cap rate
0.6%
Rent to Value Ratio
Active
$119,900
4
bds
|
2
ba
|
1,500
sqft
|
built
1919
7825 S Rhodes Ave, Chicago, IL 60619
$440
Cash flow
19.1%
Cash-on-Cash Return
10.7%
Cap rate
1.5%
Rent to Value Ratio
Active
$225,000
1
bds
|
1
ba
|
0
sqft
|
built
1917
1949 W Argyle St, Chicago, IL 60640
$-602
Cash flow
-14.0%
Cash-on-Cash Return
3.1%
Cap rate
0.8%
Rent to Value Ratio
Active
$675,000
3
bds
|
3
ba
|
0
sqft
|
built
1906
1708 W Chicago Ave, Chicago, IL 60622
$-2,010
Cash flow
-15.5%
Cash-on-Cash Return
2.7%
Cap rate
0.6%
Rent to Value Ratio
Active
$375,000
6
bds
|
3
ba
|
0
sqft
|
built
1922
8034 S Eberhart Ave, Chicago, IL 60619
$-497
Cash flow
-6.9%
Cash-on-Cash Return
4.7%
Cap rate
0.7%
Rent to Value Ratio
Active
$975,000
4
bds
|
4
ba
|
0
sqft
|
built
1893
3117 N Christiana Ave, Chicago, IL 60618
$-3,363
Cash flow
-18.0%
Cash-on-Cash Return
2.1%
Cap rate
0.4%
Rent to Value Ratio
Active
$3,199,000
6
bds
|
6
ba
|
6,400
sqft
|
built
2007
3830 N Wayne Ave, Chicago, IL 60613
$-13,548
Cash flow
-22.1%
Cash-on-Cash Return
1.2%
Cap rate
0.3%
Rent to Value Ratio
Active
$404,900
4
bds
|
2
ba
|
1,598
sqft
|
built
1953
1937 N Normandy Ave, Chicago, IL 60707
$-123
Cash flow
-1.6%
Cash-on-Cash Return
5.3%
Cap rate
0.8%
Rent to Value Ratio

Active
$739,900
3
bds
|
3
ba
|
0
sqft
|
built
1888
1202 W Huron St, Chicago, IL 60642
$-2,331
Cash flow
-16.4%
Cash-on-Cash Return
1.9%
Cap rate
0.4%
Rent to Value Ratio

Active
$474,900
6
bds
|
3
ba
|
1,997
sqft
|
built
1917
1428 N Central Ave, Chicago, IL 60651
$-1,350
Cash flow
-14.8%
Cash-on-Cash Return
2.3%
Cap rate
0.4%
Rent to Value Ratio

Active
$420,000
6
bds
|
2
ba
|
0
sqft
|
built
1925
8226 S Langley Ave, Chicago, IL 60619
$-606
Cash flow
-7.5%
Cash-on-Cash Return
3.9%
Cap rate
0.6%
Rent to Value Ratio

Active
$175,000
1
bds
|
1
ba
|
800
sqft
|
built
1923
4704 N Kasson Ave, Chicago, IL 60630
$-69
Cash flow
-2.1%
Cash-on-Cash Return
5.2%
Cap rate
0.9%
Rent to Value Ratio
Active
$640,000
4
bds
|
3
ba
|
0
sqft
|
built
1901
4125 W School St, Chicago, IL 60641
$-1,975
Cash flow
-16.1%
Cash-on-Cash Return
2.6%
Cap rate
0.5%
Rent to Value Ratio

Active
$200,000
2
bds
|
1
ba
|
640
sqft
|
built
1888
3441 S Ashland Ave, Chicago, IL 60608
$72
Cash flow
1.9%
Cash-on-Cash Return
6.7%
Cap rate
1.0%
Rent to Value Ratio
Active
$775,000
4
bds
|
3
ba
|
0
sqft
|
built
1890
853 N Hoyne Ave, Chicago, IL 60622
$-3,172
Cash flow
-21.4%
Cash-on-Cash Return
1.4%
Cap rate
0.4%
Rent to Value Ratio
Active
$720,000
4
bds
|
5
ba
|
0
sqft
|
built
1922
4825 N Karlov Ave, Chicago, IL 60630
$-2,427
Cash flow
-17.6%
Cash-on-Cash Return
2.2%
Cap rate
0.4%
Rent to Value Ratio
Active
$190,000
2
bds
|
2
ba
|
1,018
sqft
|
built
1953
10918 S Eberhart Ave, Chicago, IL 60628
$-38
Cash flow
-1.0%
Cash-on-Cash Return
6.0%
Cap rate
0.8%
Rent to Value Ratio
Active
$1,100,000
3
bds
|
4
ba
|
2,270
sqft
|
built
1998
250 W Scott St, Chicago, IL 60610
$-4,128
Cash flow
-19.6%
Cash-on-Cash Return
1.8%
Cap rate
0.5%
Rent to Value Ratio
Active
$239,900
3
bds
|
1
ba
|
1,038
sqft
|
built
1961
9056 S Normal Ave, Chicago, IL 60620
$128
Cash flow
2.8%
Cash-on-Cash Return
6.9%
Cap rate
0.8%
Rent to Value Ratio
Active
$295,000
10
bds
|
4
ba
|
0
sqft
|
built
1923
10739 S Wabash Ave, Chicago, IL 60628
$-699
Cash flow
-12.4%
Cash-on-Cash Return
3.4%
Cap rate
0.5%
Rent to Value Ratio
Active
$399,900
4
bds
|
1
ba
|
1,600
sqft
|
built
1920
6211 N Harlem Ave, Chicago, IL 60631
$-822
Cash flow
-10.7%
Cash-on-Cash Return
3.8%
Cap rate
0.7%
Rent to Value Ratio
Active
$789,000
4
bds
|
4
ba
|
3,200
sqft
|
built
2007
3137 S Throop St, Chicago, IL 60608
$-1,579
Cash flow
-10.4%
Cash-on-Cash Return
3.9%
Cap rate
0.6%
Rent to Value Ratio
Active
$130,000
1
bds
|
1
ba
|
825
sqft
|
built
1973
3001 S Michigan Ave, Chicago, IL 60616
$14
Cash flow
0.6%
Cash-on-Cash Return
6.4%
Cap rate
1.5%
Rent to Value Ratio
Active
$440,000
2
bds
|
2
ba
|
1,248
sqft
|
built
2008
100 E 14th St, Chicago, IL 60605
$-1,865
Cash flow
-22.1%
Cash-on-Cash Return
1.2%
Cap rate
0.6%
Rent to Value Ratio
Active
$539,000
2
bds
|
2
ba
|
1,380
sqft
|
built
2000
520 W Huron St, Chicago, IL 60654
$-2,473
Cash flow
-23.9%
Cash-on-Cash Return
0.8%
Cap rate
0.5%
Rent to Value Ratio

Active
$159,900
2
bds
|
1
ba
|
950
sqft
|
built
1924
6254 N Richmond St, Chicago, IL 60659
$-11
Cash flow
-0.4%
Cash-on-Cash Return
5.6%
Cap rate
1.1%
Rent to Value Ratio

Active
$599,999
3
bds
|
2
ba
|
1,501
sqft
|
built
1925
1033 W 14th Pl, Chicago, IL 60608
$-1,904
Cash flow
-16.6%
Cash-on-Cash Return
1.9%
Cap rate
0.5%
Rent to Value Ratio

Active
$232,000
1
bds
|
1
ba
|
0
sqft
|
built
1923
1645 W Ogden Ave, Chicago, IL 60612
$-199
Cash flow
-4.5%
Cash-on-Cash Return
4.7%
Cap rate
0.9%
Rent to Value Ratio