Chicago, IL Investment Properties for Sale
Browse homes for sale and investment properties in Chicago, IL. Refine your search by price, property type, or more.
Best cash flowing properties in Chicago, IL
Active
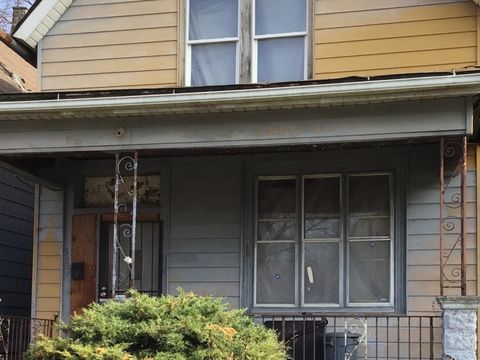
$65,000
4
bds
|
2
ba
|
704
sqft
|
built
1883
5837 S Union Ave, Chicago, IL 60621
$853
Cash flow
15.3%
Cash-on-Cash Return
15.7%
Cap rate
2.0%
Rent to Value Ratio
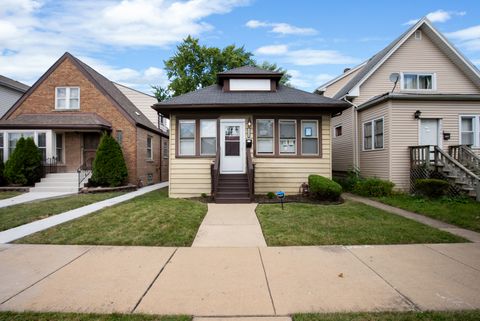
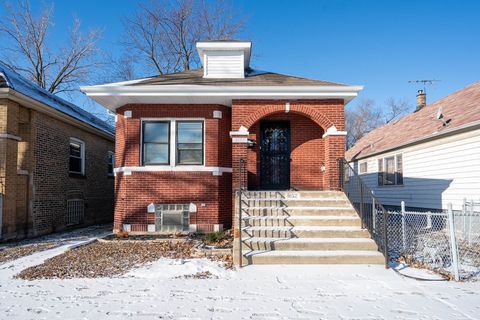
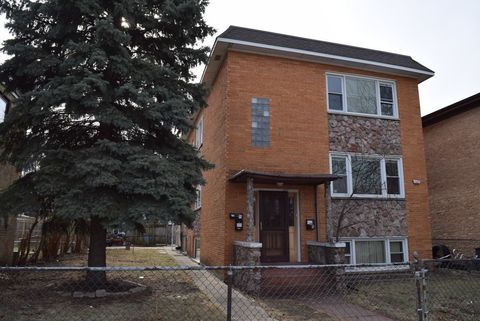
Active
$234,500
3
bds
|
1
ba
|
880
sqft
|
built
1918
1328 W 98th St, Chicago, IL 60643
$510
Cash flow
11.3%
Cash-on-Cash Return
8.3%
Cap rate
1.1%
Rent to Value Ratio
3,966 out of 4,608 properties for sale in Chicago, IL
Limited Results Shown
Create a free account, or log in to reveal all property listings and enjoy the complete experience.
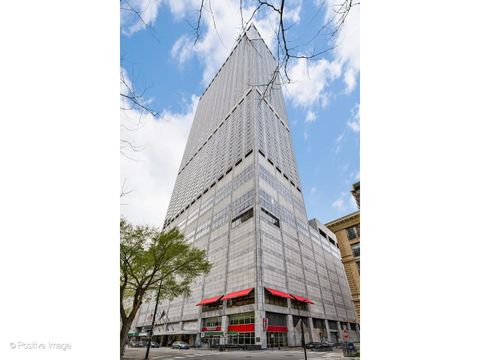
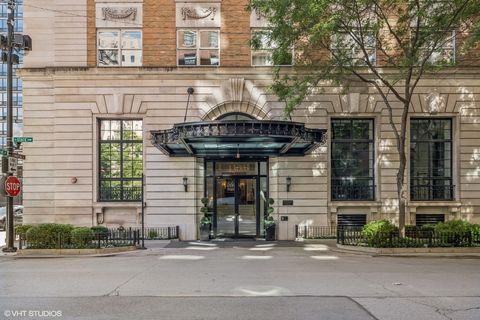
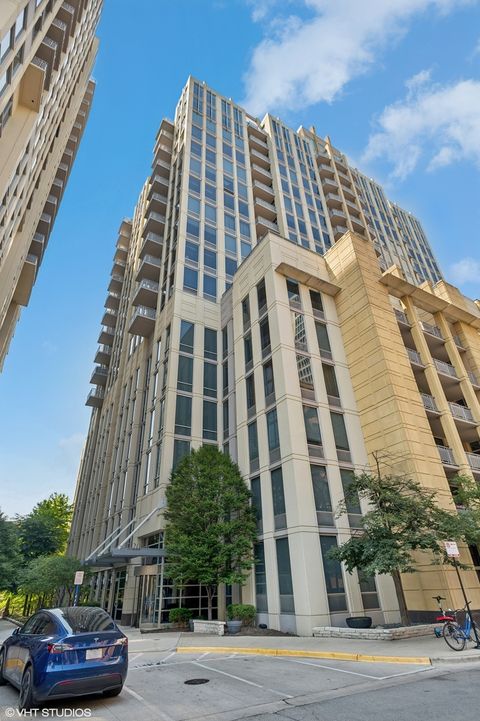
Active
$2,795,000
3
bds
|
6
ba
|
3,320
sqft
|
built
1974
180 E Pearson St, Chicago, IL 60611
$-12,854
Cash flow
-24.0%
Cash-on-Cash Return
0.2%
Cap rate
0.3%
Rent to Value Ratio
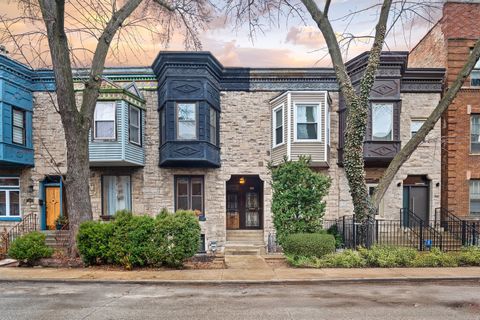
Active
$375,000
3
bds
|
1
ba
|
1,200
sqft
|
built
1892
1166 E 54th St, Chicago, IL 60615
$-474
Cash flow
-6.6%
Cash-on-Cash Return
4.2%
Cap rate
0.7%
Rent to Value Ratio
Active
$259,000
5
bds
|
3
ba
|
0
sqft
|
built
1908
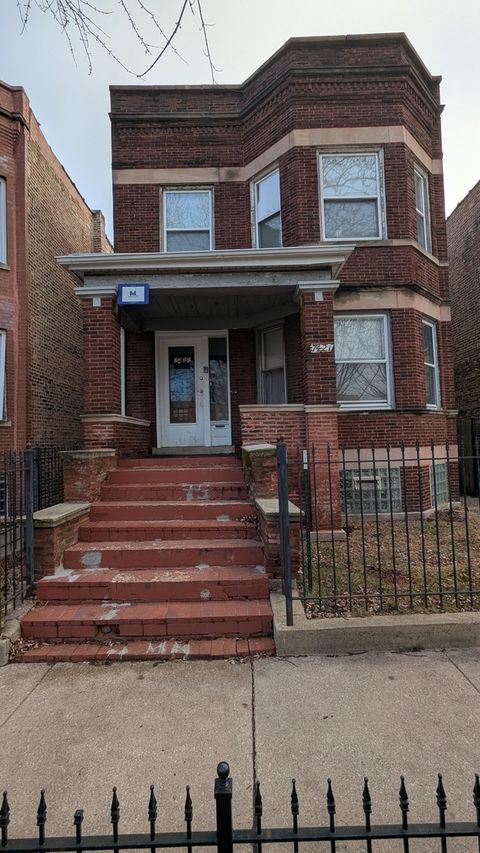
7421 S Dante Ave, Chicago, IL 60619
$-178
Cash flow
-3.6%
Cash-on-Cash Return
4.9%
Cap rate
0.7%
Rent to Value Ratio

Active
$1,499,000
3
bds
|
4
ba
|
3,000
sqft
|
built
1960
1550 N Lake Shore Dr, Chicago, IL 60610
$-7,286
Cash flow
-25.4%
Cash-on-Cash Return
-0.2%
Cap rate
0.7%
Rent to Value Ratio
Active
$360,000
7
bds
|
2
ba
|
0
sqft
|
built
1922
8348 S Saginaw Ave, Chicago, IL 60617
$-927
Cash flow
-13.4%
Cash-on-Cash Return
2.6%
Cap rate
0.4%
Rent to Value Ratio
Active
$649,990
3
bds
|
3
ba
|
1,700
sqft
|
built
1988
474 N Lake Shore Dr, Chicago, IL 60611
$-1,887
Cash flow
-15.1%
Cash-on-Cash Return
2.2%
Cap rate
0.8%
Rent to Value Ratio
Active
$330,000
4
bds
|
2
ba
|
1,250
sqft
|
built
1954
5525 S Kilbourn Ave, Chicago, IL 60629
$-138
Cash flow
-2.2%
Cash-on-Cash Return
5.2%
Cap rate
0.8%
Rent to Value Ratio
Active
$234,500
3
bds
|
1
ba
|
880
sqft
|
built
1918
1328 W 98th St, Chicago, IL 60643
$510
Cash flow
11.3%
Cash-on-Cash Return
8.3%
Cap rate
1.1%
Rent to Value Ratio
Active
$519,900
11
bds
|
4
ba
|
0
sqft
|
built
1902
1635 S Christiana Ave, Chicago, IL 60623
$-1,487
Cash flow
-14.9%
Cash-on-Cash Return
2.8%
Cap rate
0.4%
Rent to Value Ratio
Active
$270,000
4
bds
|
2
ba
|
0
sqft
|
built
1893
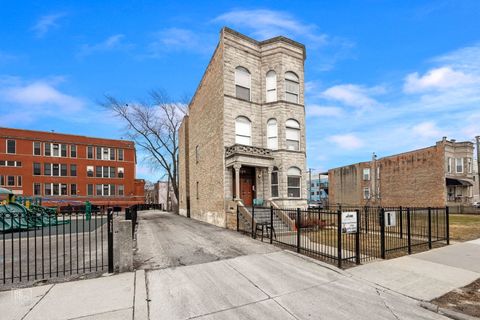
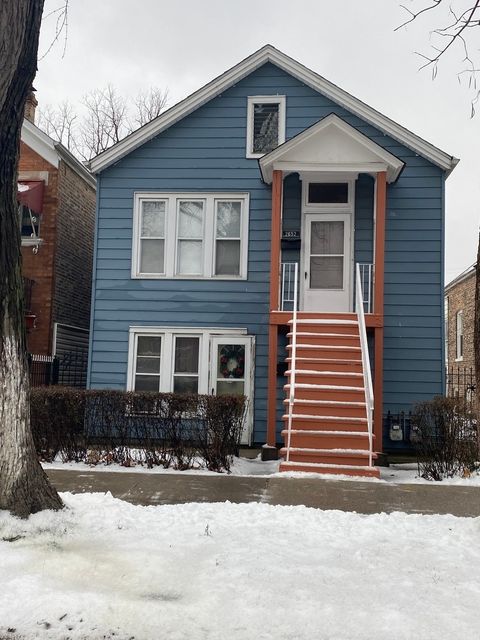
2652 S Komensky Ave, Chicago, IL 60623
$-345
Cash flow
-6.7%
Cash-on-Cash Return
4.1%
Cap rate
0.7%
Rent to Value Ratio
Active
$1,169,650
8
bds
|
4
ba
|
0
sqft
|
built
1890
6109 S Greenwood Ave, Chicago, IL 60637
$-3,707
Cash flow
-16.5%
Cash-on-Cash Return
1.9%
Cap rate
0.3%
Rent to Value Ratio

Active
$680,000
9
bds
|
4
ba
|
0
sqft
|
built
1914
4247 W Haddon Ave, Chicago, IL 60651
$-1,893
Cash flow
-14.5%
Cash-on-Cash Return
2.3%
Cap rate
0.4%
Rent to Value Ratio
Active
$619,900
2
bds
|
2
ba
|
0
sqft
|
built
1893
3100 N Saint Louis Ave, Chicago, IL 60618
$-1,930
Cash flow
-16.2%
Cash-on-Cash Return
1.9%
Cap rate
0.4%
Rent to Value Ratio
Active
$439,000
5
bds
|
3
ba
|
0
sqft
|
built
1900
2245 W 23rd St, Chicago, IL 60608
$-1,016
Cash flow
-12.1%
Cash-on-Cash Return
2.9%
Cap rate
0.6%
Rent to Value Ratio

Active
$750,000
3
bds
|
3
ba
|
1,700
sqft
|
built
2006
222 N Columbus Dr, Chicago, IL 60601
$-2,305
Cash flow
-16.0%
Cash-on-Cash Return
2.0%
Cap rate
0.8%
Rent to Value Ratio
Active
$2,795,000
3
bds
|
4
ba
|
3,945
sqft
|
built
1918
1300 N State Pkwy, Chicago, IL 60610
$-16,051
Cash flow
-30.0%
Cash-on-Cash Return
-1.2%
Cap rate
0.3%
Rent to Value Ratio

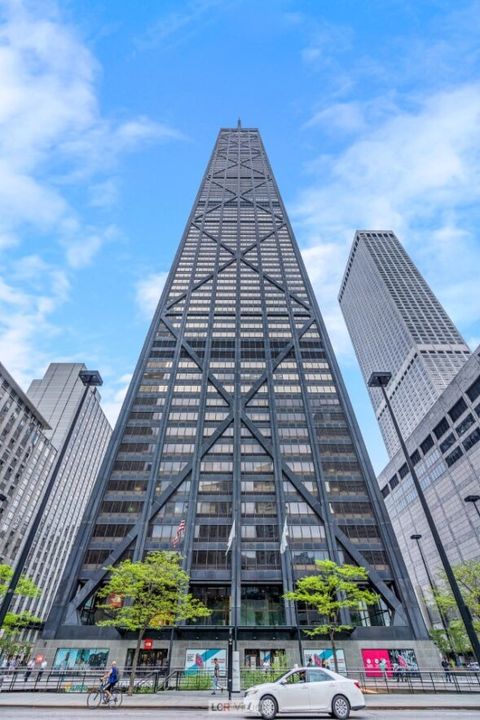
Active
$1,050,000
2
bds
|
3
ba
|
2,052
sqft
|
built
2000
800 N Michigan Ave, Chicago, IL 60611
$-4,575
Cash flow
-22.7%
Cash-on-Cash Return
0.5%
Cap rate
0.5%
Rent to Value Ratio
Active
$259,500
3
bds
|
2
ba
|
1,029
sqft
|
built
1930
9132 S Blackstone Ave, Chicago, IL 60619
$321
Cash flow
6.5%
Cash-on-Cash Return
7.2%
Cap rate
1.0%
Rent to Value Ratio
Active
$874,900
2
bds
|
3
ba
|
1,796
sqft
|
built
1969
175 E Delaware Pl, Chicago, IL 60611
$-2,580
Cash flow
-15.4%
Cash-on-Cash Return
2.1%
Cap rate
0.8%
Rent to Value Ratio

Active
$398,000
2
bds
|
2
ba
|
906
sqft
|
built
1920
5619 S California Ave, Chicago, IL 60629
$-266
Cash flow
-3.5%
Cash-on-Cash Return
4.9%
Cap rate
0.7%
Rent to Value Ratio
Active
$297,500
4
bds
|
3
ba
|
2,096
sqft
|
built
1925
9220 S Dauphin Ave, Chicago, IL 60619
$362
Cash flow
6.3%
Cash-on-Cash Return
7.1%
Cap rate
0.9%
Rent to Value Ratio
Active
$210,000
3
bds
|
1
ba
|
1,100
sqft
|
built
2000
2225 W Warren Blvd, Chicago, IL 60612
$-52
Cash flow
-1.3%
Cash-on-Cash Return
5.4%
Cap rate
0.9%
Rent to Value Ratio
Active
$495,000
3
bds
|
2
ba
|
980
sqft
|
built
1960
4551 W Foster Ave, Chicago, IL 60630
$-535
Cash flow
-5.6%
Cash-on-Cash Return
4.4%
Cap rate
0.6%
Rent to Value Ratio

Active
$675,000
3
bds
|
2
ba
|
1,850
sqft
|
built
1990
401 E Ontario St, Chicago, IL 60611
$-2,215
Cash flow
-17.1%
Cash-on-Cash Return
1.7%
Cap rate
0.8%
Rent to Value Ratio
Active
$259,000
2
bds
|
2
ba
|
0
sqft
|
built
1901
3252 S Prairie Ave, Chicago, IL 60616
$-271
Cash flow
-5.5%
Cash-on-Cash Return
4.4%
Cap rate
1.0%
Rent to Value Ratio

Active
$719,900
5
bds
|
4
ba
|
3,290
sqft
|
built
2024
6626 S Ingleside Ave, Chicago, IL 60637
$-1,237
Cash flow
-9.0%
Cash-on-Cash Return
3.6%
Cap rate
0.7%
Rent to Value Ratio

Active
$379,000
1
bds
|
1
ba
|
687
sqft
|
built
2009
225 N Columbus Dr, Chicago, IL 60601
$-1,067
Cash flow
-14.7%
Cash-on-Cash Return
2.3%
Cap rate
0.8%
Rent to Value Ratio
Active
$420,000
2
bds
|
2
ba
|
0
sqft
|
built
2004
720 N Larrabee St, Chicago, IL 60654
$-1,612
Cash flow
-20.0%
Cash-on-Cash Return
1.1%
Cap rate
0.7%
Rent to Value Ratio

Active
$925,000
9
bds
|
5
ba
|
0
sqft
|
built
1973
339 W 23rd Pl, Chicago, IL 60616
$-2,412
Cash flow
-13.6%
Cash-on-Cash Return
2.5%
Cap rate
0.4%
Rent to Value Ratio
Active
$136,500
2
bds
|
1
ba
|
1,200
sqft
|
built
1966
5643 W Lawrence Ave, Chicago, IL 60630
$246
Cash flow
9.4%
Cash-on-Cash Return
7.8%
Cap rate
1.3%
Rent to Value Ratio

Active
$1,149,000
4
bds
|
4
ba
|
0
sqft
|
built
1858
1024 W 18th St, Chicago, IL 60608
$-3,111
Cash flow
-14.1%
Cash-on-Cash Return
2.4%
Cap rate
0.4%
Rent to Value Ratio
Active
$208,000
3
bds
|
1
ba
|
1,040
sqft
|
built
1963
425 E 91st St, Chicago, IL 60619
$220
Cash flow
5.5%
Cash-on-Cash Return
6.9%
Cap rate
1.0%
Rent to Value Ratio
Active
$172,000
2
bds
|
2
ba
|
1,119
sqft
|
built
1927
6144 N Washtenaw Ave, Chicago, IL 60659
$293
Cash flow
8.9%
Cash-on-Cash Return
7.7%
Cap rate
1.3%
Rent to Value Ratio

Active
$210,000
1
bds
|
1
ba
|
800
sqft
|
built
1959
33 E Cedar St, Chicago, IL 60611
$-1,177
Cash flow
-29.2%
Cash-on-Cash Return
-1.0%
Cap rate
1.1%
Rent to Value Ratio
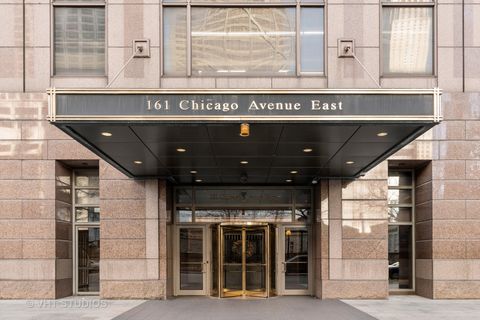
Active
$1,150,000
3
bds
|
3
ba
|
2,506
sqft
|
built
1985
161 E Chicago Ave, Chicago, IL 60611
$-4,014
Cash flow
-18.2%
Cash-on-Cash Return
1.5%
Cap rate
0.7%
Rent to Value Ratio
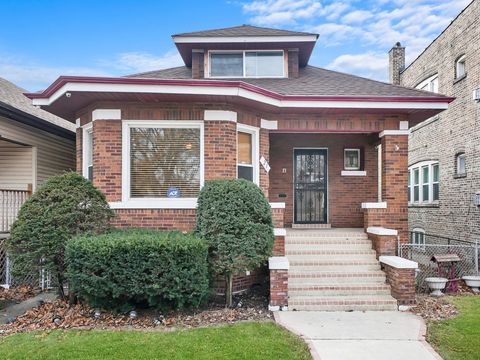
Active
$214,900
4
bds
|
2
ba
|
1,500
sqft
|
built
1921
21 E 123rd St, Chicago, IL 60628
$348
Cash flow
8.4%
Cash-on-Cash Return
7.6%
Cap rate
1.0%
Rent to Value Ratio
Active
$205,900
3
bds
|
2
ba
|
1,372
sqft
|
built
2006
4458 S Greenwood Ave, Chicago, IL 60653
$-142
Cash flow
-3.6%
Cash-on-Cash Return
4.8%
Cap rate
1.1%
Rent to Value Ratio
Active
$65,000
4
bds
|
2
ba
|
704
sqft
|
built
1883
5837 S Union Ave, Chicago, IL 60621
$853
Cash flow
15.3%
Cash-on-Cash Return
15.7%
Cap rate
2.0%
Rent to Value Ratio
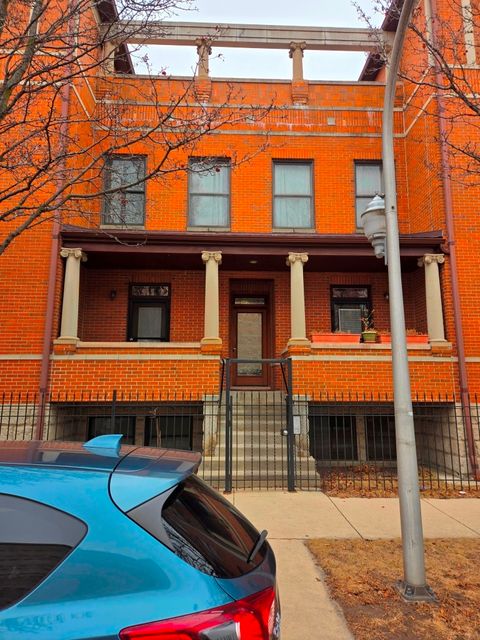
Active
$586,000
7
bds
|
2
ba
|
0
sqft
|
built
1908
6607 S Ingleside Ave, Chicago, IL 60637
$-1,106
Cash flow
-9.8%
Cash-on-Cash Return
3.4%
Cap rate
0.5%
Rent to Value Ratio
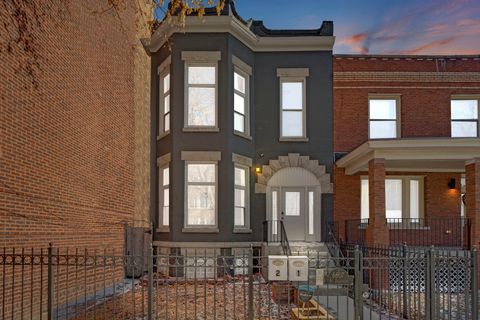
Active
$465,000
4
bds
|
2
ba
|
8,000
sqft
|
built
1923
6215 S Prairie Ave, Chicago, IL 60637
$-407
Cash flow
-4.6%
Cash-on-Cash Return
4.6%
Cap rate
0.6%
Rent to Value Ratio