Chicago, IL Investment Properties for Sale
Browse homes for sale and investment properties in Chicago, IL. Refine your search by price, property type, or more.
Best cash flowing properties in Chicago, IL
Active
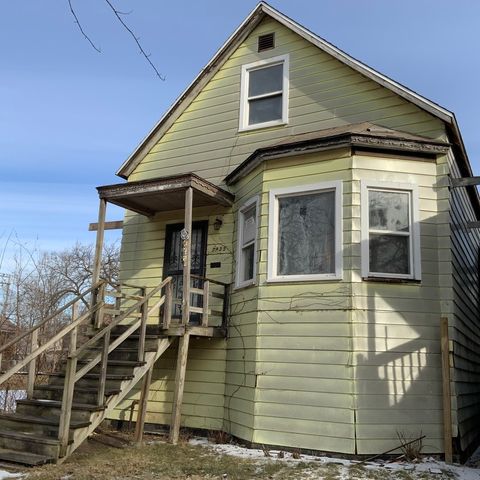
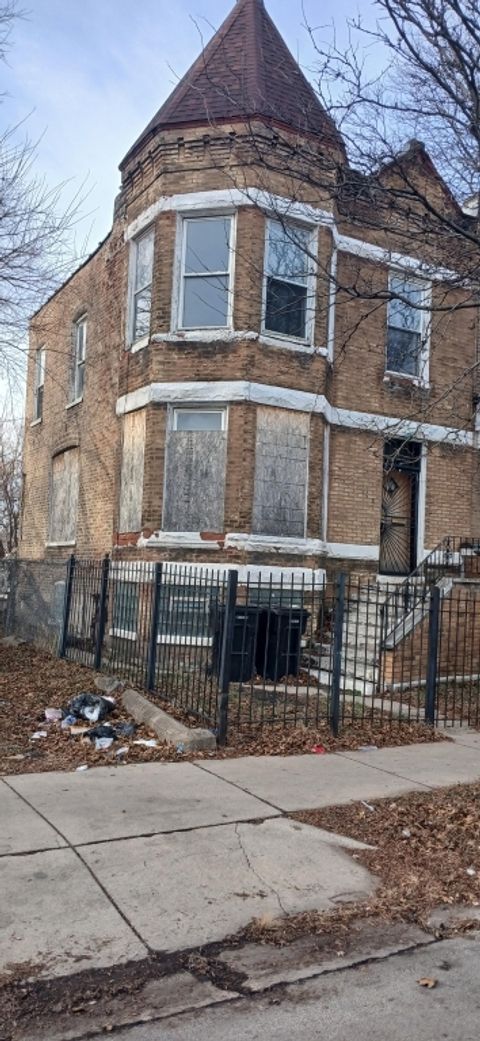
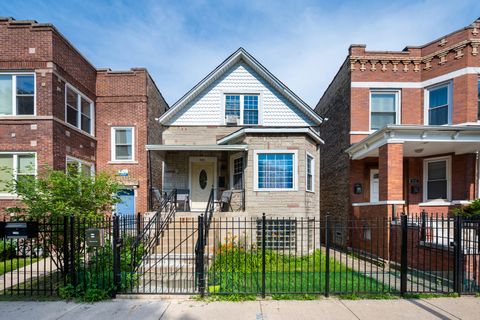
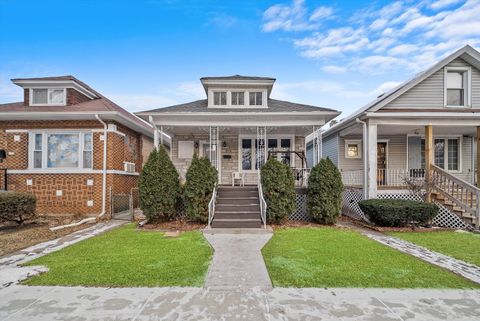
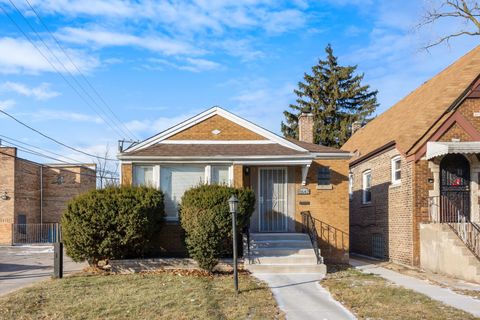
$69,500
4
bds
|
3
ba
|
2,000
sqft
|
built
1910
7935 S Coles Ave, Chicago, IL 60617
$1,300
Cash flow
21.8%
Cash-on-Cash Return
22.4%
Cap rate
2.9%
Rent to Value Ratio
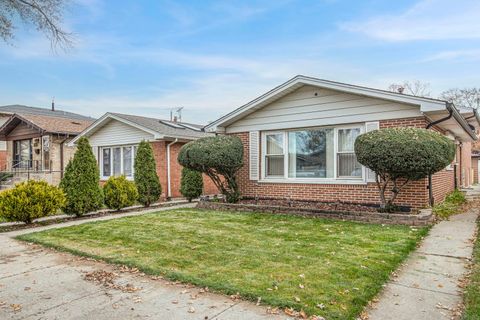
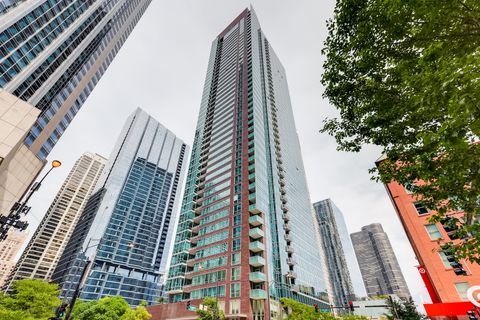
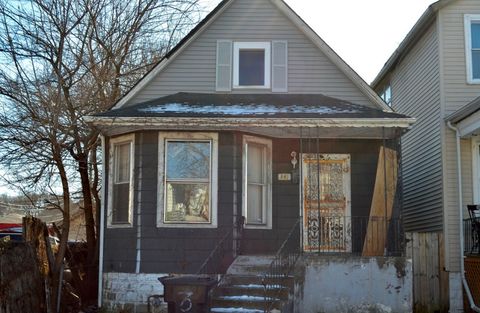
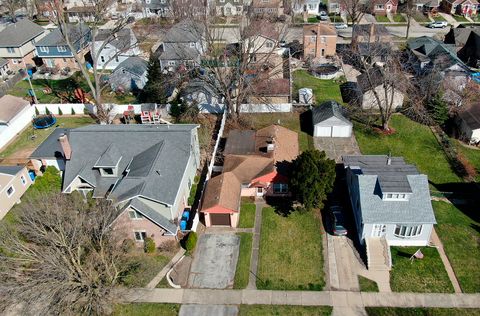
Active
$249,900
3
bds
|
2
ba
|
1,120
sqft
|
built
1964
11635 S Ada St, Chicago, IL 60643
$611
Cash flow
12.8%
Cash-on-Cash Return
8.6%
Cap rate
1.0%
Rent to Value Ratio
3,966 out of 4,608 properties for sale in Chicago, IL
Limited Results Shown
Create a free account, or log in to reveal all property listings and enjoy the complete experience.

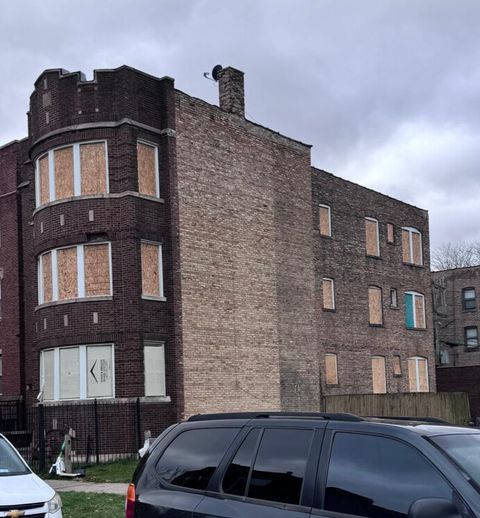
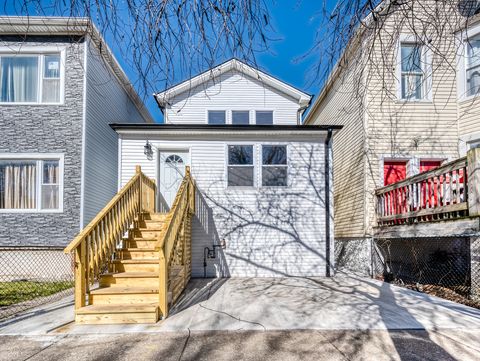
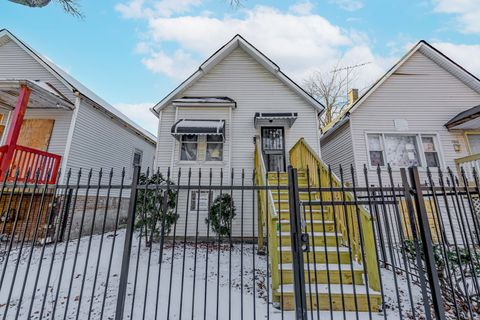
Active
$270,000
4
bds
|
2
ba
|
2,400
sqft
|
built
1921
8924 S Elizabeth St, Chicago, IL 60620
$-110
Cash flow
-2.1%
Cash-on-Cash Return
5.2%
Cap rate
0.7%
Rent to Value Ratio
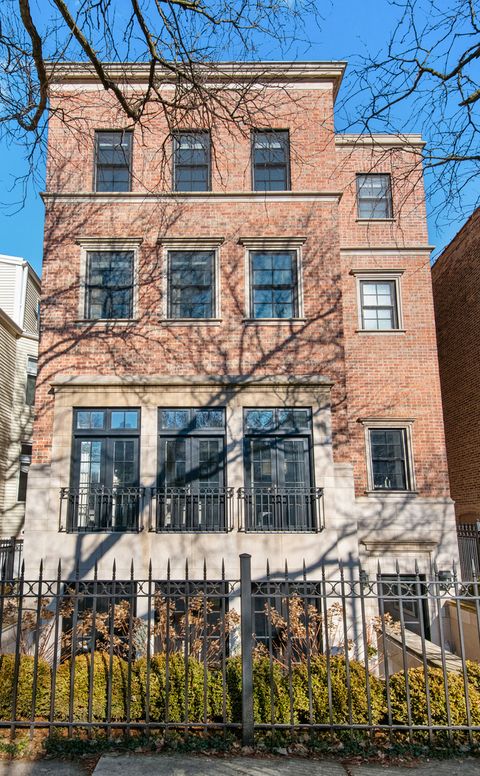
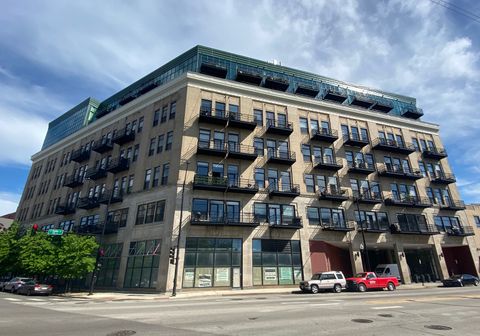
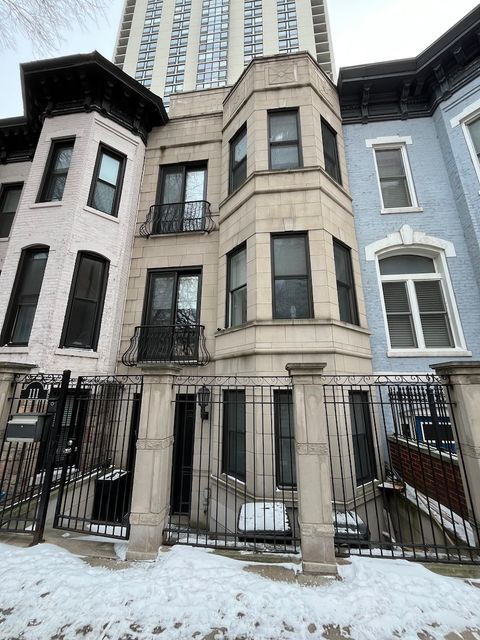
Active
$2,995,000
6
bds
|
7
ba
|
6,400
sqft
|
built
2001
1112 W Wrightwood Ave, Chicago, IL 60614
$-10,665
Cash flow
-18.6%
Cash-on-Cash Return
1.4%
Cap rate
0.3%
Rent to Value Ratio
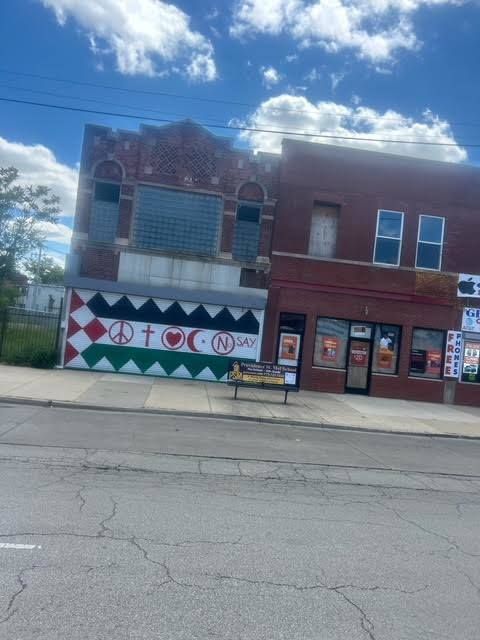
Active
$289,000
bds
|
3
ba
|
0
sqft
|
built
1927
4753 W Madison St, Chicago, IL 60644
$-513
Cash flow
-9.3%
Cash-on-Cash Return
3.6%
Cap rate
0.5%
Rent to Value Ratio

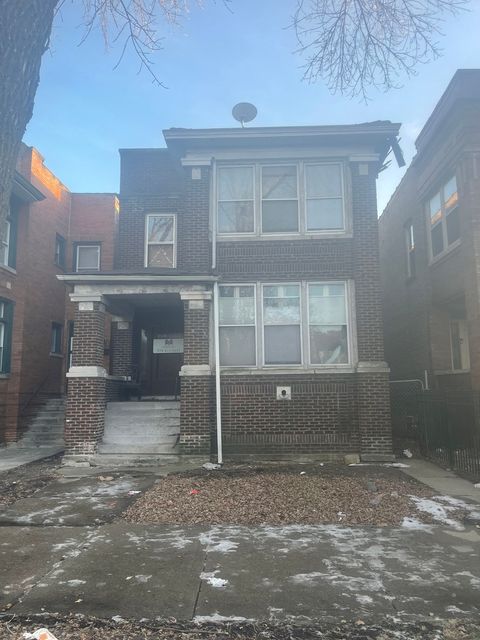
Active
$90,000
5
bds
|
2
ba
|
0
sqft
|
built
1920
7002 S Paulina St, Chicago, IL 60636
$487
Cash flow
28.2%
Cash-on-Cash Return
12.2%
Cap rate
1.6%
Rent to Value Ratio

Active
$2,495,000
3
bds
|
4
ba
|
3,080
sqft
|
built
2008
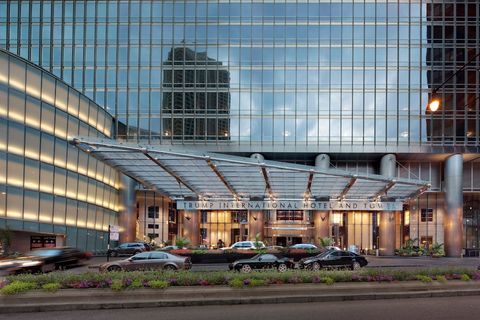
401 N Wabash Ave, Chicago, IL 60611
$-9,881
Cash flow
-20.7%
Cash-on-Cash Return
0.9%
Cap rate
0.5%
Rent to Value Ratio
Active
$115,000
3
bds
|
1
ba
|
1,484
sqft
|
built
1898
112 N Kilbourn Ave, Chicago, IL 60624
$445
Cash flow
20.2%
Cash-on-Cash Return
10.3%
Cap rate
1.4%
Rent to Value Ratio
Active
$925,000
3
bds
|
3
ba
|
1,803
sqft
|
built
2008
505 N Mc Clurg Ct, Chicago, IL 60611
$-5,240
Cash flow
-29.6%
Cash-on-Cash Return
-1.1%
Cap rate
0.3%
Rent to Value Ratio
Active
$249,000
12
bds
|
3
ba
|
0
sqft
|
built
1923
7524 S Colfax Ave, Chicago, IL 60649
$316
Cash flow
6.6%
Cash-on-Cash Return
7.2%
Cap rate
1.0%
Rent to Value Ratio
Active
$325,000
7
bds
|
4
ba
|
0
sqft
|
built
1912
4821 W Washington Blvd, Chicago, IL 60644
$-533
Cash flow
-8.6%
Cash-on-Cash Return
3.7%
Cap rate
0.6%
Rent to Value Ratio
Active
$1,995,000
4
bds
|
4
ba
|
4,000
sqft
|
built
1910
33 E Bellevue Pl, Chicago, IL 60611
$-10,122
Cash flow
-26.5%
Cash-on-Cash Return
-0.4%
Cap rate
0.5%
Rent to Value Ratio
Active
$95,000
1
bds
|
1
ba
|
796
sqft
|
built
1962
4800 S Chicago Beach Dr, Chicago, IL 60615
$-264
Cash flow
-14.5%
Cash-on-Cash Return
2.3%
Cap rate
1.9%
Rent to Value Ratio
Active
$350,000
1
bds
|
1
ba
|
0
sqft
|
built
1912
913 W Van Buren St, Chicago, IL 60607
$-801
Cash flow
-11.9%
Cash-on-Cash Return
2.9%
Cap rate
0.7%
Rent to Value Ratio
Active
$140,000
2
bds
|
1
ba
|
0
sqft
|
built
1972
5584 S Archer Ave, Chicago, IL 60638
$-383
Cash flow
-14.3%
Cash-on-Cash Return
2.4%
Cap rate
1.0%
Rent to Value Ratio
Active
$405,000
4
bds
|
3
ba
|
1,674
sqft
|
built
1900
2109 N Karlov Ave, Chicago, IL 60639
$-356
Cash flow
-4.6%
Cash-on-Cash Return
4.6%
Cap rate
0.7%
Rent to Value Ratio
Active
$117,000
2
bds
|
2
ba
|
998
sqft
|
built
1903
341 E 117th St, Chicago, IL 60628
$476
Cash flow
21.2%
Cash-on-Cash Return
10.6%
Cap rate
1.4%
Rent to Value Ratio

Active
$2,999,999
6
bds
|
5
ba
|
5,400
sqft
|
built
1907
461 W Melrose St, Chicago, IL 60657
$-10,416
Cash flow
-18.1%
Cash-on-Cash Return
1.5%
Cap rate
0.3%
Rent to Value Ratio
Active
$515,000
4
bds
|
3
ba
|
3,000
sqft
|
built
1885
606 W 47th Pl, Chicago, IL 60609
$65
Cash flow
0.7%
Cash-on-Cash Return
5.8%
Cap rate
0.8%
Rent to Value Ratio
Active
$230,000
1
bds
|
1
ba
|
606
sqft
|
built
1925
1645 W Ogden Ave, Chicago, IL 60612
$-336
Cash flow
-7.6%
Cash-on-Cash Return
3.9%
Cap rate
0.9%
Rent to Value Ratio
Active
$529,900
2
bds
|
3
ba
|
1,817
sqft
|
built
2000
400 W Ontario St, Chicago, IL 60654
$-1,718
Cash flow
-16.9%
Cash-on-Cash Return
1.8%
Cap rate
0.8%
Rent to Value Ratio
Active
$1,495,000
2
bds
|
3
ba
|
1,837
sqft
|
built
2008
401 N Wabash Ave, Chicago, IL 60611
$-6,892
Cash flow
-24.1%
Cash-on-Cash Return
0.1%
Cap rate
0.4%
Rent to Value Ratio
Active
$300,000
1
bds
|
1
ba
|
850
sqft
|
built
1978
405 N Wabash Ave, Chicago, IL 60611
$-760
Cash flow
-13.2%
Cash-on-Cash Return
2.6%
Cap rate
0.8%
Rent to Value Ratio
Active
$118,000
2
bds
|
1
ba
|
2,250
sqft
|
built
1888
2835 W Cullerton St, Chicago, IL 60623
$559
Cash flow
24.7%
Cash-on-Cash Return
11.4%
Cap rate
1.4%
Rent to Value Ratio
Active
$249,900
3
bds
|
2
ba
|
1,120
sqft
|
built
1964
11635 S Ada St, Chicago, IL 60643
$611
Cash flow
12.8%
Cash-on-Cash Return
8.6%
Cap rate
1.0%
Rent to Value Ratio
Active
$277,000
3
bds
|
3
ba
|
1,012
sqft
|
built
1913
10445 S Bensley Ave, Chicago, IL 60617
$28
Cash flow
0.5%
Cash-on-Cash Return
5.8%
Cap rate
0.8%
Rent to Value Ratio
Active
$625,000
3
bds
|
4
ba
|
2,400
sqft
|
built
1895
658 E 50th Pl, Chicago, IL 60615
$-894
Cash flow
-7.5%
Cash-on-Cash Return
4.0%
Cap rate
0.6%
Rent to Value Ratio

Active
$149,900
3
bds
|
1
ba
|
1,259
sqft
|
built
1908
6130 S Rhodes Ave, Chicago, IL 60637
$427
Cash flow
14.9%
Cash-on-Cash Return
9.1%
Cap rate
1.2%
Rent to Value Ratio
Active
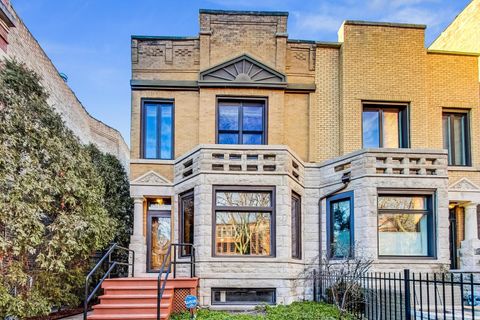
$69,500
4
bds
|
3
ba
|
2,000
sqft
|
built
1910
7935 S Coles Ave, Chicago, IL 60617
$1,300
Cash flow
21.8%
Cash-on-Cash Return
22.4%
Cap rate
2.9%
Rent to Value Ratio
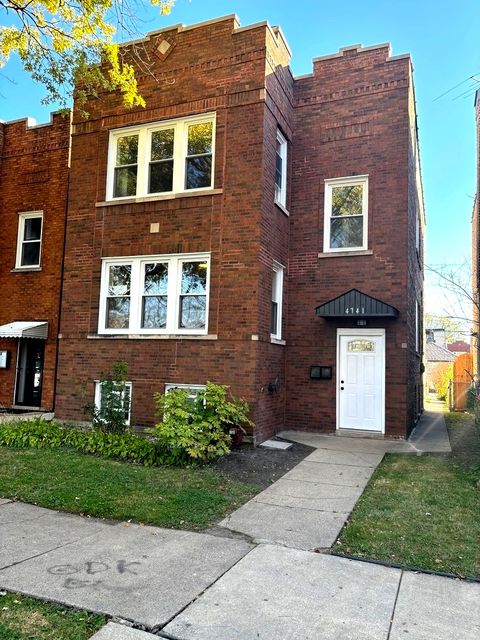
Active
$759,900
4
bds
|
2
ba
|
0
sqft
|
built
1926
4741 N Keating Ave, Chicago, IL 60630
$-2,268
Cash flow
-15.6%
Cash-on-Cash Return
2.1%
Cap rate
0.4%
Rent to Value Ratio
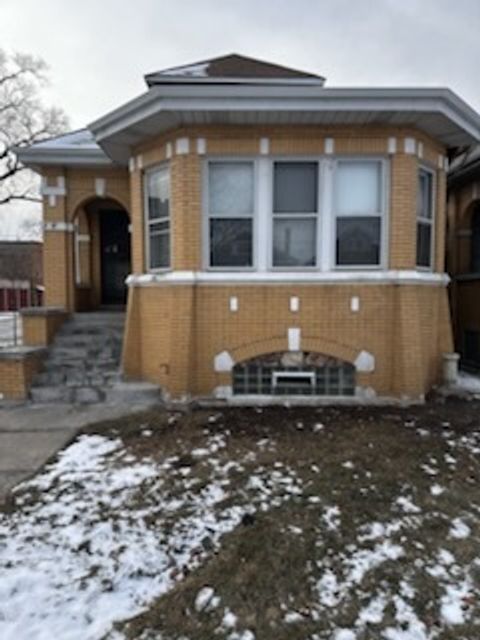
Active
$185,987
4
bds
|
2
ba
|
1,998
sqft
|
built
1932
7156 S Artesian Ave, Chicago, IL 60629
$353
Cash flow
9.9%
Cash-on-Cash Return
8.0%
Cap rate
1.1%
Rent to Value Ratio
Active
$229,500
2
bds
|
2
ba
|
1,300
sqft
|
built
1952
8642 S Vernon Ave, Chicago, IL 60619
$98
Cash flow
2.2%
Cash-on-Cash Return
6.2%
Cap rate
1.0%
Rent to Value Ratio
Active
$1,425,000
4
bds
|
4
ba
|
2,800
sqft
|
built
1897
111 W Elm St, Chicago, IL 60610
$-618
Cash flow
-2.3%
Cash-on-Cash Return
5.2%
Cap rate
0.8%
Rent to Value Ratio
Active
$249,000
3
bds
|
1
ba
|
816
sqft
|
built
1915
10427 S Homan Ave, Chicago, IL 60655
$109
Cash flow
2.3%
Cash-on-Cash Return
6.2%
Cap rate
0.9%
Rent to Value Ratio
Active
$204,900
2
bds
|
2
ba
|
1,141
sqft
|
built
1910
5308 S Peoria St, Chicago, IL 60609
$478
Cash flow
12.2%
Cash-on-Cash Return
8.5%
Cap rate
1.1%
Rent to Value Ratio
Active
$899,000
3
bds
|
4
ba
|
3,011
sqft
|
built
1893
4332 N Kenmore Ave, Chicago, IL 60613
$-2,157
Cash flow
-12.5%
Cash-on-Cash Return
2.8%
Cap rate
0.4%
Rent to Value Ratio
Active
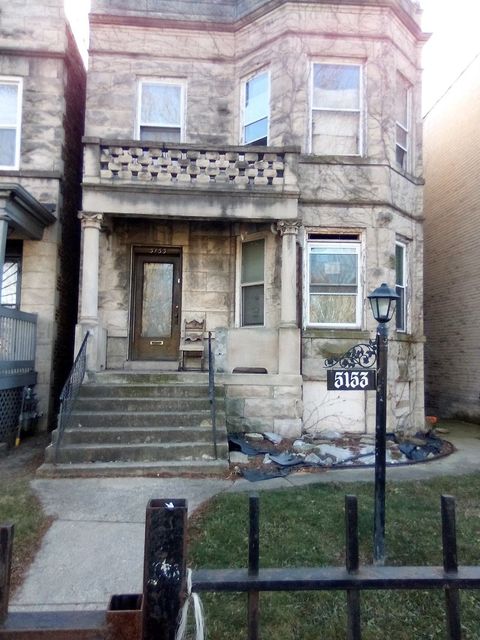
$275,000
8
bds
|
3
ba
|
0
sqft
|
built
1890
5153 W Washington Blvd, Chicago, IL 60644
$-557
Cash flow
-10.6%
Cash-on-Cash Return
3.2%
Cap rate
0.5%
Rent to Value Ratio
Active
$182,500
bds
|
1
ba
|
690
sqft
|
built
1974
1339 N Dearborn St, Chicago, IL 60610
$-263
Cash flow
-7.5%
Cash-on-Cash Return
4.0%
Cap rate
1.0%
Rent to Value Ratio

Active
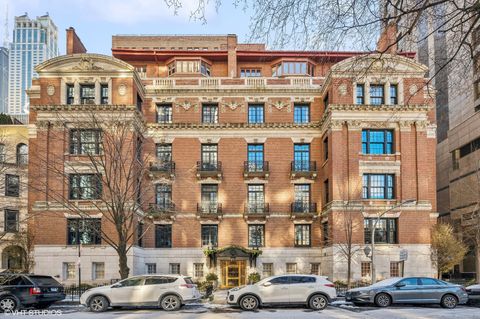
$1,900,000
3
bds
|
4
ba
|
3,900
sqft
|
built
1927
3800 N Lake Shore Dr, Chicago, IL 60613
$-7,351
Cash flow
-20.2%
Cash-on-Cash Return
1.0%
Cap rate
0.5%
Rent to Value Ratio
Active
$360,000
2
bds
|
2
ba
|
1,100
sqft
|
built
1957
2909 N Sheridan Rd, Chicago, IL 60657
$-798
Cash flow
-11.6%
Cash-on-Cash Return
3.0%
Cap rate
1.0%
Rent to Value Ratio
Active
$309,000
3
bds
|
3
ba
|
2,000
sqft
|
built
2000
1863 W 107th St, Chicago, IL 60643
$220
Cash flow
3.7%
Cash-on-Cash Return
6.5%
Cap rate
0.9%
Rent to Value Ratio
Active
$125,000
bds
|
1
ba
|
600
sqft
|
built
1974
5415 N Sheridan Rd, Chicago, IL 60640
$-78
Cash flow
-3.3%
Cash-on-Cash Return
5.5%
Cap rate
1.4%
Rent to Value Ratio