Chicago, IL Investment Properties for Sale
Browse homes for sale and investment properties in Chicago, IL. Refine your search by price, property type, or more.
Best cash flowing properties in Chicago, IL
Active
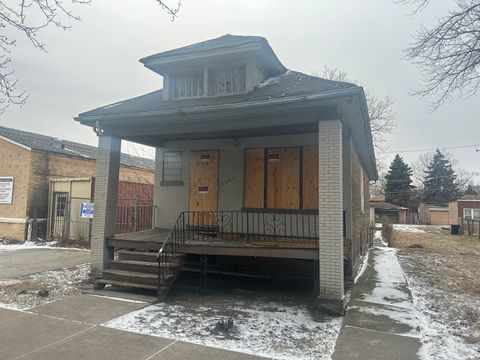
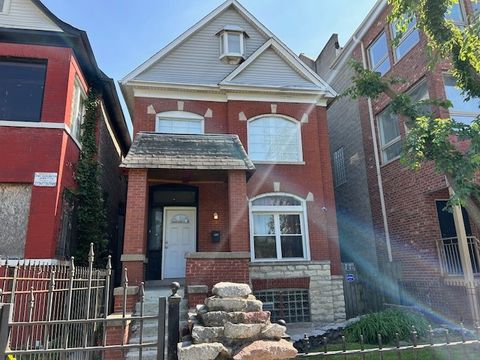
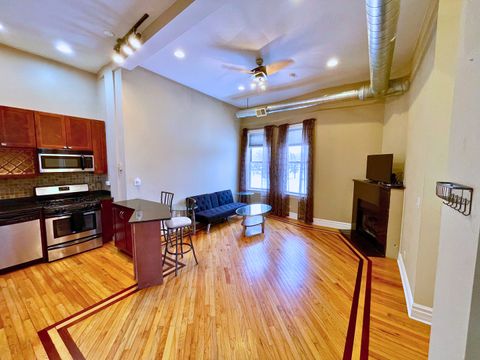
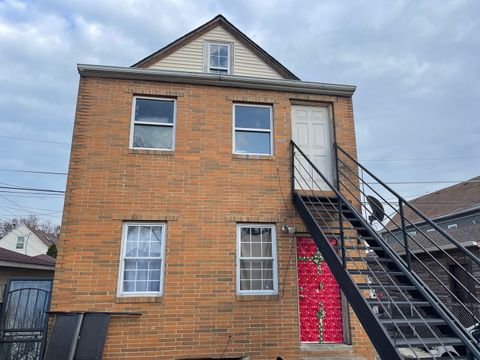
$68,500
2
bds
|
2
ba
|
924
sqft
|
built
1909
6840 S Indiana Ave, Chicago, IL 60637
$834
Cash flow
14.2%
Cash-on-Cash Return
14.6%
Cap rate
2.0%
Rent to Value Ratio
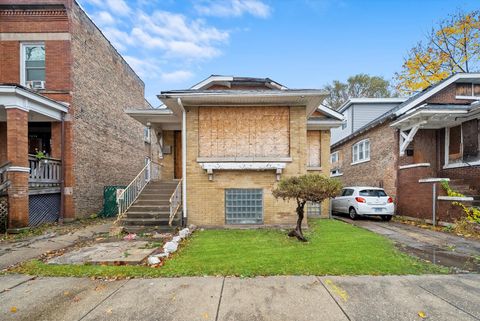
Active
$119,900
3
bds
|
1
ba
|
0
sqft
|
built
1915
7032 S Carpenter St, Chicago, IL 60621
$613
Cash flow
26.7%
Cash-on-Cash Return
11.8%
Cap rate
1.5%
Rent to Value Ratio
3,965 out of 4,608 properties for sale in Chicago, IL
Limited Results Shown
Create a free account, or log in to reveal all property listings and enjoy the complete experience.
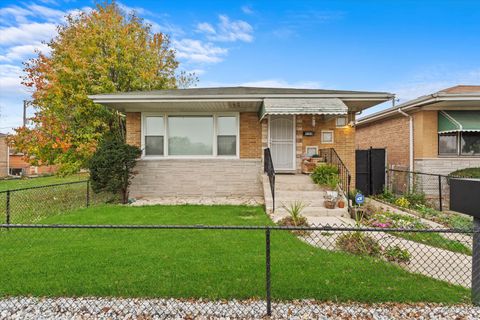
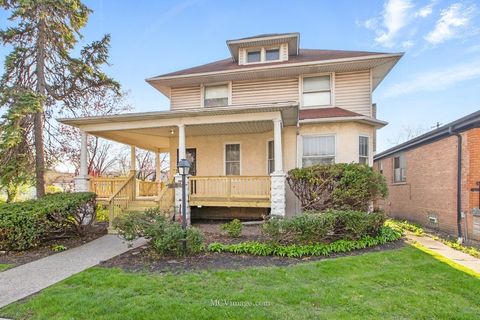
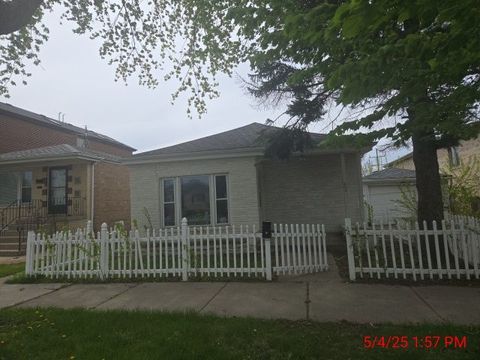
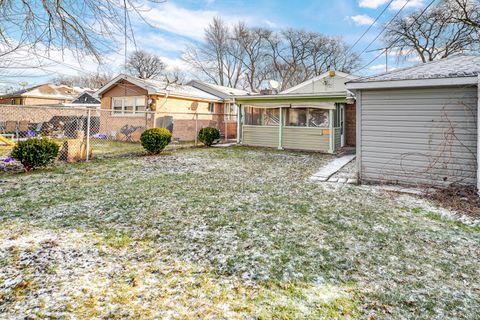
Active
$239,900
3
bds
|
1
ba
|
1,000
sqft
|
built
1965
9326 S Lafayette Ave, Chicago, IL 60620
$122
Cash flow
2.7%
Cash-on-Cash Return
6.3%
Cap rate
0.8%
Rent to Value Ratio
Active
$119,900
3
bds
|
1
ba
|
0
sqft
|
built
1915
7032 S Carpenter St, Chicago, IL 60621
$613
Cash flow
26.7%
Cash-on-Cash Return
11.8%
Cap rate
1.5%
Rent to Value Ratio
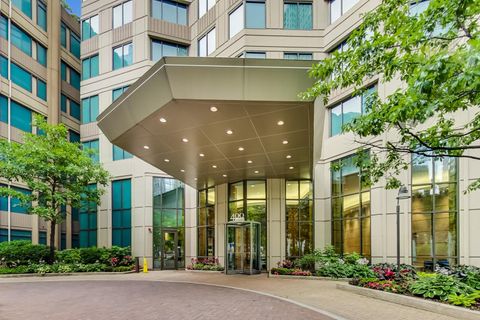
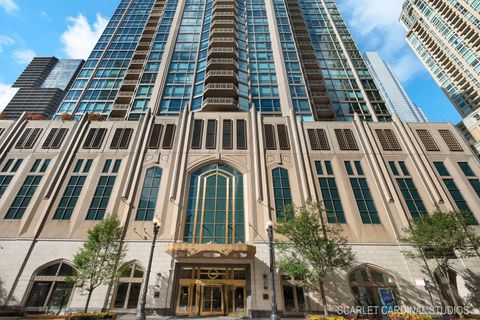
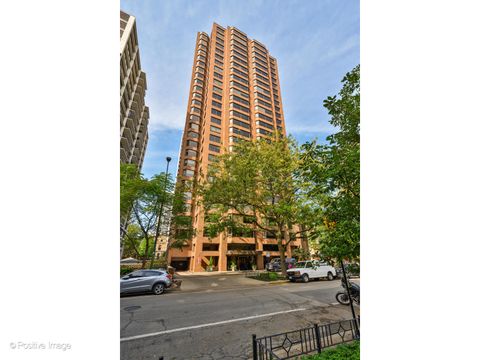
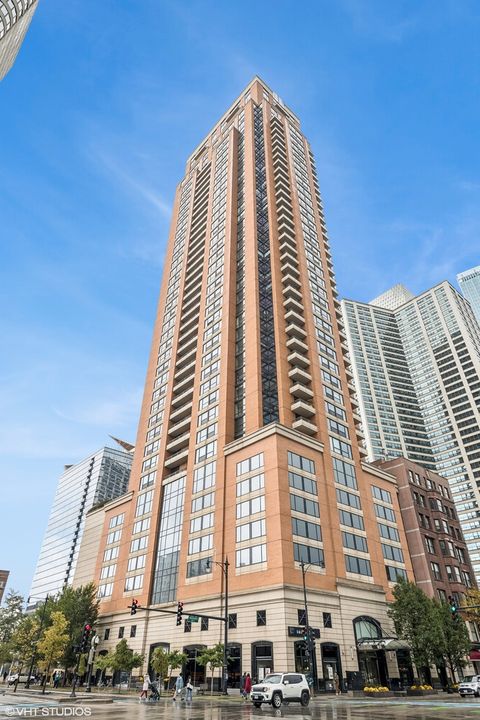
Active
$240,000
bds
|
1
ba
|
0
sqft
|
built
2001
400 N La Salle Dr, Chicago, IL 60654
$-599
Cash flow
-13.0%
Cash-on-Cash Return
2.7%
Cap rate
0.8%
Rent to Value Ratio
Active
$399,000
6
bds
|
2
ba
|
0
sqft
|
built
1908
4717 W Congress Pkwy, Chicago, IL 60644
$-654
Cash flow
-8.6%
Cash-on-Cash Return
3.7%
Cap rate
0.6%
Rent to Value Ratio
Active
$165,000
3
bds
|
3
ba
|
941
sqft
|
built
1923
7948 S Anthony Ave, Chicago, IL 60619
$160
Cash flow
5.1%
Cash-on-Cash Return
6.8%
Cap rate
1.0%
Rent to Value Ratio
Active
$68,500
2
bds
|
2
ba
|
924
sqft
|
built
1909
6840 S Indiana Ave, Chicago, IL 60637
$834
Cash flow
14.2%
Cash-on-Cash Return
14.6%
Cap rate
2.0%
Rent to Value Ratio
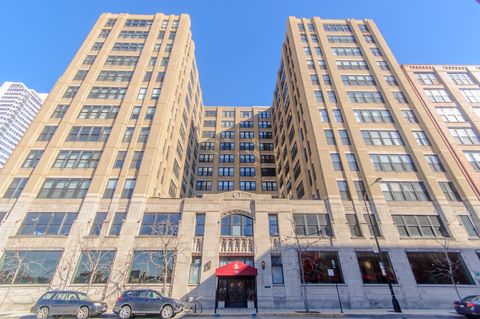
Active
$289,000
1
bds
|
1
ba
|
611
sqft
|
built
2002
222 N Columbus Dr, Chicago, IL 60601
$-804
Cash flow
-14.5%
Cash-on-Cash Return
2.3%
Cap rate
0.8%
Rent to Value Ratio
Active
$449,000
2
bds
|
2
ba
|
1,225
sqft
|
built
1962
300 N State St, Chicago, IL 60654
$-1,353
Cash flow
-15.7%
Cash-on-Cash Return
2.1%
Cap rate
0.9%
Rent to Value Ratio
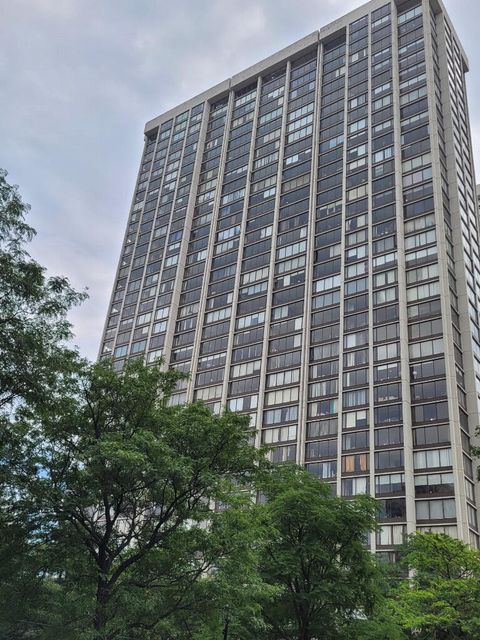
Active
$200,000
bds
|
1
ba
|
500
sqft
|
built
1965
260 E Chestnut St, Chicago, IL 60611
$-318
Cash flow
-8.3%
Cash-on-Cash Return
3.8%
Cap rate
0.9%
Rent to Value Ratio
Active
$154,900
4
bds
|
2
ba
|
0
sqft
|
built
1957
401 W 115th St, Chicago, IL 60628
$403
Cash flow
13.6%
Cash-on-Cash Return
8.8%
Cap rate
1.2%
Rent to Value Ratio
Active
$219,000
bds
|
1
ba
|
600
sqft
|
built
2003
33 W Ontario St, Chicago, IL 60654
$-580
Cash flow
-13.8%
Cash-on-Cash Return
2.5%
Cap rate
0.9%
Rent to Value Ratio
Active
$320,000
4
bds
|
3
ba
|
2,420
sqft
|
built
1914
6943 S Euclid Ave, Chicago, IL 60649
$-477
Cash flow
-7.8%
Cash-on-Cash Return
3.9%
Cap rate
0.8%
Rent to Value Ratio
Active
$695,000
1
bds
|
2
ba
|
1,017
sqft
|
built
2008
401 N Wabash Ave, Chicago, IL 60611
$-2,613
Cash flow
-19.6%
Cash-on-Cash Return
1.2%
Cap rate
0.6%
Rent to Value Ratio
Active
$2,575,000
6
bds
|
6
ba
|
6,300
sqft
|
built
1891
515 W Grant Pl, Chicago, IL 60614
$-9,620
Cash flow
-19.5%
Cash-on-Cash Return
1.2%
Cap rate
0.3%
Rent to Value Ratio
Active
$63,000
1
bds
|
1
ba
|
0
sqft
|
built
1962
7337 S South Shore Dr, Chicago, IL 60649
$377
Cash flow
7.0%
Cash-on-Cash Return
7.2%
Cap rate
2.2%
Rent to Value Ratio
Active
$60,000
1
bds
|
1
ba
|
0
sqft
|
built
1962
7337 S South Shore Dr, Chicago, IL 60649
$266
Cash flow
5.2%
Cash-on-Cash Return
5.3%
Cap rate
2.2%
Rent to Value Ratio
Active
$259,900
4
bds
|
3
ba
|
2,929
sqft
|
built
1885
6619 S Ellis Ave, Chicago, IL 60637
$253
Cash flow
5.1%
Cash-on-Cash Return
6.8%
Cap rate
1.1%
Rent to Value Ratio
Active
$2,400,000
3
bds
|
4
ba
|
3,200
sqft
|
built
2006
21 E Huron St, Chicago, IL 60611
$-12,984
Cash flow
-28.2%
Cash-on-Cash Return
-0.8%
Cap rate
0.4%
Rent to Value Ratio
Active
$299,900
3
bds
|
2
ba
|
7,500
sqft
|
built
1913
10130 S Lowe Ave, Chicago, IL 60628
$81
Cash flow
1.4%
Cash-on-Cash Return
6.0%
Cap rate
0.7%
Rent to Value Ratio
Active
$425,000
2
bds
|
2
ba
|
1,450
sqft
|
built
1929
728 W Jackson Blvd, Chicago, IL 60661
$-1,627
Cash flow
-20.0%
Cash-on-Cash Return
1.1%
Cap rate
0.7%
Rent to Value Ratio
Active
$1,995,000
3
bds
|
4
ba
|
3,020
sqft
|
built
1966
1040 N Lake Shore Dr, Chicago, IL 60611
$-9,298
Cash flow
-24.3%
Cash-on-Cash Return
0.1%
Cap rate
0.5%
Rent to Value Ratio

Active
$1,479,000
4
bds
|
5
ba
|
3,800
sqft
|
built
1966
1440 N Lake Shore Dr, Chicago, IL 60610
$-6,571
Cash flow
-23.2%
Cash-on-Cash Return
0.3%
Cap rate
0.7%
Rent to Value Ratio
Active
$112,900
2
bds
|
2
ba
|
1,000
sqft
|
built
1962
6730 S South Shore Dr, Chicago, IL 60649
$-360
Cash flow
-16.6%
Cash-on-Cash Return
1.8%
Cap rate
1.4%
Rent to Value Ratio
Active
$3,100,000
7
bds
|
7
ba
|
7,000
sqft
|
built
1904
5235 S University Ave, Chicago, IL 60615
$-12,942
Cash flow
-21.8%
Cash-on-Cash Return
0.7%
Cap rate
0.2%
Rent to Value Ratio
Active
$224,900
3
bds
|
2
ba
|
1,028
sqft
|
built
1966
9231 S La Salle St, Chicago, IL 60620
$397
Cash flow
9.2%
Cash-on-Cash Return
7.8%
Cap rate
1.0%
Rent to Value Ratio
Active
$167,500
2
bds
|
2
ba
|
900
sqft
|
built
1896
5016 S King Dr, Chicago, IL 60615
$112
Cash flow
3.5%
Cash-on-Cash Return
6.5%
Cap rate
1.3%
Rent to Value Ratio
Active
$1,199,000
5
bds
|
6
ba
|
4,000
sqft
|
built
1981
1410 N State Pkwy, Chicago, IL 60610
$-7,306
Cash flow
-31.8%
Cash-on-Cash Return
-1.6%
Cap rate
0.7%
Rent to Value Ratio
Active
$130,000
6
bds
|
2
ba
|
944
sqft
|
built
1925
5106 S Massasoit Ave, Chicago, IL 60638
$12
Cash flow
0.5%
Cash-on-Cash Return
5.8%
Cap rate
1.4%
Rent to Value Ratio
Active
$1,287,505
9
bds
|
7
ba
|
0
sqft
|
built
1885
2458 N Clybourn Ave, Chicago, IL 60614
$-5,847
Cash flow
-23.7%
Cash-on-Cash Return
0.2%
Cap rate
0.2%
Rent to Value Ratio
Active
$163,900
3
bds
|
1
ba
|
1,300
sqft
|
built
1924
6945 S Dorchester Ave, Chicago, IL 60637
$188
Cash flow
6.0%
Cash-on-Cash Return
7.1%
Cap rate
1.2%
Rent to Value Ratio
Active
$2,350,000
3
bds
|
4
ba
|
2,721
sqft
|
built
2021
363 E Wacker Dr, Chicago, IL 60601
$-9,341
Cash flow
-20.7%
Cash-on-Cash Return
0.9%
Cap rate
0.4%
Rent to Value Ratio
Active
$279,900
4
bds
|
1
ba
|
1,400
sqft
|
built
1922
10613 S Avenue F, Chicago, IL 60617
$211
Cash flow
3.9%
Cash-on-Cash Return
6.6%
Cap rate
0.9%
Rent to Value Ratio
Active
$850,000
3
bds
|
2
ba
|
1,762
sqft
|
built
2003
55 E Erie St, Chicago, IL 60611
$-2,426
Cash flow
-14.9%
Cash-on-Cash Return
2.3%
Cap rate
0.8%
Rent to Value Ratio
Active
$229,900
4
bds
|
2
ba
|
0
sqft
|
built
1913
5151 S Troy St, Chicago, IL 60632
$-316
Cash flow
-7.2%
Cash-on-Cash Return
4.0%
Cap rate
0.6%
Rent to Value Ratio
Active
$449,900
2
bds
|
2
ba
|
1,479
sqft
|
built
2007
1160 S Michigan Ave, Chicago, IL 60605
$-1,327
Cash flow
-15.4%
Cash-on-Cash Return
2.1%
Cap rate
0.7%
Rent to Value Ratio
Active
$199,900
2
bds
|
1
ba
|
960
sqft
|
built
1950
11438 S Maplewood Ave, Chicago, IL 60655
$256
Cash flow
6.7%
Cash-on-Cash Return
7.2%
Cap rate
1.1%
Rent to Value Ratio
Active
$167,000
bds
|
1
ba
|
650
sqft
|
built
1974
5455 N Sheridan Rd, Chicago, IL 60640
$-263
Cash flow
-8.2%
Cash-on-Cash Return
3.8%
Cap rate
1.0%
Rent to Value Ratio
Active
$510,000
13
bds
|
4
ba
|
0
sqft
|
built
1926
1309 S Kostner Ave, Chicago, IL 60623
$-1,020
Cash flow
-10.4%
Cash-on-Cash Return
3.3%
Cap rate
0.5%
Rent to Value Ratio
Active
$260,000
3
bds
|
1
ba
|
1,420
sqft
|
built
1965
12152 S Union Ave, Chicago, IL 60628
$510
Cash flow
10.2%
Cash-on-Cash Return
8.0%
Cap rate
1.0%
Rent to Value Ratio
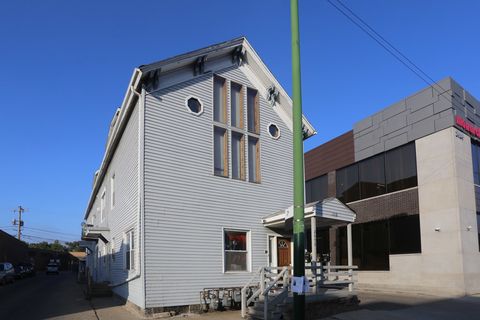
Active
$975,000
6
bds
|
3
ba
|
0
sqft
|
built
1901
1707 W Chicago Ave, Chicago, IL 60622
$-3,962
Cash flow
-21.2%
Cash-on-Cash Return
0.8%
Cap rate
0.4%
Rent to Value Ratio