Chicago, IL Investment Properties for Sale
Browse homes for sale and investment properties in Chicago, IL. Refine your search by price, property type, or more.
Best cash flowing properties in Chicago, IL
Active
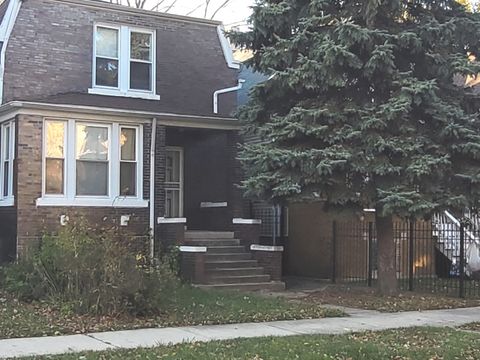
$50,000
4
bds
|
2
ba
|
1,402
sqft
|
built
1907
12014 S Princeton Ave, Chicago, IL 60628
$1,182
Cash flow
27.5%
Cash-on-Cash Return
28.4%
Cap rate
3.6%
Rent to Value Ratio

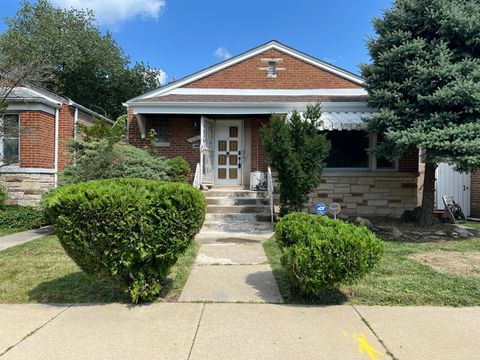
Active
$299,999
3
bds
|
2
ba
|
552
sqft
|
built
1908
6207 S Tripp Ave, Chicago, IL 60629
$675
Cash flow
11.7%
Cash-on-Cash Return
8.4%
Cap rate
1.1%
Rent to Value Ratio
3,965 out of 4,608 properties for sale in Chicago, IL
Limited Results Shown
Create a free account, or log in to reveal all property listings and enjoy the complete experience.
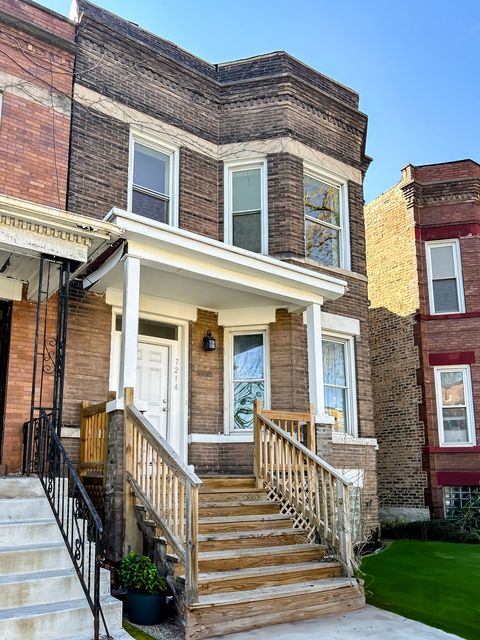
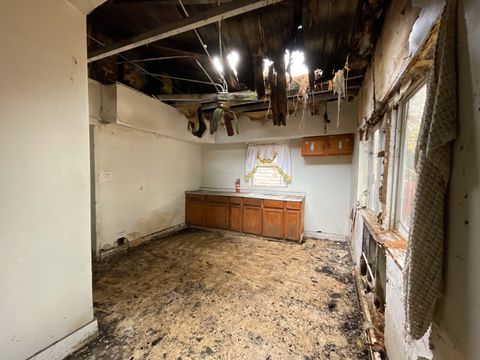
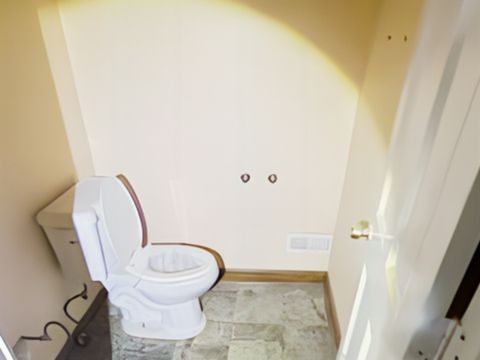
Active
$379,000
6
bds
|
2
ba
|
0
sqft
|
built
1905
7214 S Saint Lawrence Ave, Chicago, IL 60619
$-607
Cash flow
-8.4%
Cash-on-Cash Return
3.8%
Cap rate
0.5%
Rent to Value Ratio
Active
$389,900
3
bds
|
2
ba
|
4,375
sqft
|
built
1951
8155 S Essex Ave, Chicago, IL 60617
$333
Cash flow
4.5%
Cash-on-Cash Return
6.7%
Cap rate
0.9%
Rent to Value Ratio
Active
$305,000
4
bds
|
3
ba
|
2,475
sqft
|
built
1880
4807 S Champlain Ave, Chicago, IL 60615
$-39
Cash flow
-0.7%
Cash-on-Cash Return
5.5%
Cap rate
0.8%
Rent to Value Ratio
Active
$449,000
3
bds
|
2
ba
|
1,796
sqft
|
built
2007
5242 W Ferdinand St, Chicago, IL 60644
$-304
Cash flow
-3.5%
Cash-on-Cash Return
4.9%
Cap rate
0.7%
Rent to Value Ratio
Active
$419,995
9
bds
|
3
ba
|
0
sqft
|
built
2006
7915 S Phillips Ave, Chicago, IL 60617
$-687
Cash flow
-8.5%
Cash-on-Cash Return
3.7%
Cap rate
0.5%
Rent to Value Ratio
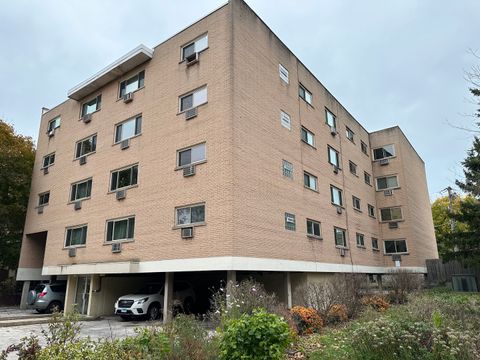
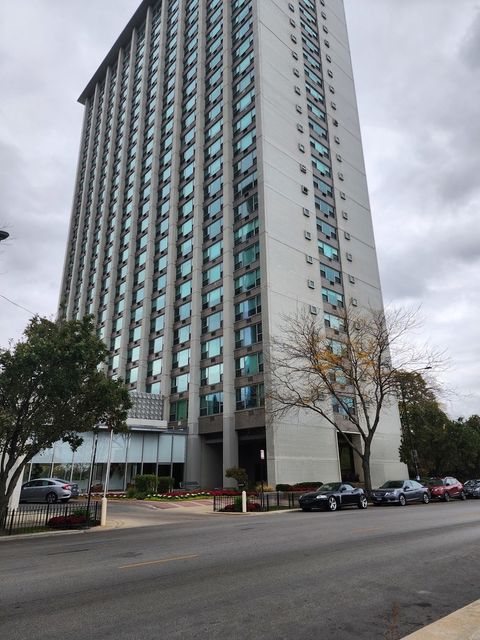
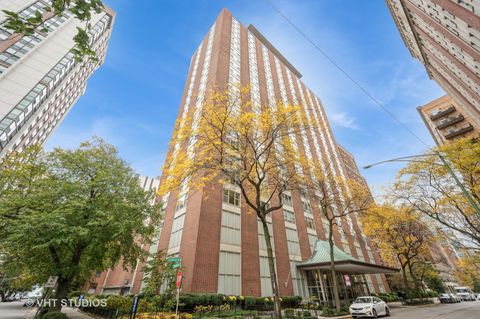
Active
$325,000
2
bds
|
2
ba
|
1,150
sqft
|
built
1973
655 W Irving Park Rd, Chicago, IL 60613
$-1,198
Cash flow
-19.2%
Cash-on-Cash Return
1.3%
Cap rate
0.9%
Rent to Value Ratio
Active
$1,950,000
3
bds
|
4
ba
|
4,320
sqft
|
built
1985
132 E Delaware Pl, Chicago, IL 60611
$-12,421
Cash flow
-33.2%
Cash-on-Cash Return
-2.0%
Cap rate
0.5%
Rent to Value Ratio
Active
$263,000
2
bds
|
2
ba
|
1,008
sqft
|
built
1922
70 E 100th Pl, Chicago, IL 60628
$248
Cash flow
4.9%
Cash-on-Cash Return
6.8%
Cap rate
0.9%
Rent to Value Ratio
Active
$225,000
2
bds
|
2
ba
|
1,100
sqft
|
built
1966
7540 N Ridge Blvd, Chicago, IL 60645
$-329
Cash flow
-7.6%
Cash-on-Cash Return
3.9%
Cap rate
0.9%
Rent to Value Ratio
Active
$6,500,000
7
bds
|
11
ba
|
10,360
sqft
|
built
2007
460 W Huron St, Chicago, IL 60654
$-36,272
Cash flow
-29.1%
Cash-on-Cash Return
-1.0%
Cap rate
0.1%
Rent to Value Ratio
Active
$1,424,999
3
bds
|
3
ba
|
2,754
sqft
|
built
1975
180 E Pearson St, Chicago, IL 60611
$-6,833
Cash flow
-25.0%
Cash-on-Cash Return
-0.1%
Cap rate
0.5%
Rent to Value Ratio
Active
$184,999
2
bds
|
1
ba
|
800
sqft
|
built
1968
4939 S Dorchester Ave, Chicago, IL 60615
$33
Cash flow
0.9%
Cash-on-Cash Return
5.9%
Cap rate
1.0%
Rent to Value Ratio
Active
$269,500
3
bds
|
2
ba
|
3,703
sqft
|
built
1962
10519 S Avenue E, Chicago, IL 60617
$557
Cash flow
10.8%
Cash-on-Cash Return
8.2%
Cap rate
1.0%
Rent to Value Ratio
Active
$829,900
3
bds
|
4
ba
|
3,000
sqft
|
built
1915
4720 N Kenneth Ave, Chicago, IL 60630
$-1,389
Cash flow
-8.7%
Cash-on-Cash Return
3.7%
Cap rate
0.6%
Rent to Value Ratio
Active
$109,900
3
bds
|
3
ba
|
2,500
sqft
|
built
1927
6922 S Jeffery Blvd, Chicago, IL 60649
$488
Cash flow
23.2%
Cash-on-Cash Return
11.0%
Cap rate
2.3%
Rent to Value Ratio
Active
$391,000
4
bds
|
2
ba
|
1,700
sqft
|
built
1952
1327 E 52nd St, Chicago, IL 60615
$-561
Cash flow
-7.5%
Cash-on-Cash Return
4.0%
Cap rate
0.9%
Rent to Value Ratio
Active
$311,900
1
bds
|
1
ba
|
862
sqft
|
built
1900
225 W Huron St, Chicago, IL 60654
$-705
Cash flow
-11.8%
Cash-on-Cash Return
3.0%
Cap rate
0.8%
Rent to Value Ratio
Active
$50,000
4
bds
|
2
ba
|
1,402
sqft
|
built
1907
12014 S Princeton Ave, Chicago, IL 60628
$1,182
Cash flow
27.5%
Cash-on-Cash Return
28.4%
Cap rate
3.6%
Rent to Value Ratio
Active
$129,000
3
bds
|
2
ba
|
1,023
sqft
|
built
1885
4254 S Cottage Grove Ave, Chicago, IL 60653
$202
Cash flow
8.2%
Cash-on-Cash Return
7.6%
Cap rate
1.6%
Rent to Value Ratio
Active
$299,999
3
bds
|
2
ba
|
552
sqft
|
built
1908
6207 S Tripp Ave, Chicago, IL 60629
$675
Cash flow
11.7%
Cash-on-Cash Return
8.4%
Cap rate
1.1%
Rent to Value Ratio
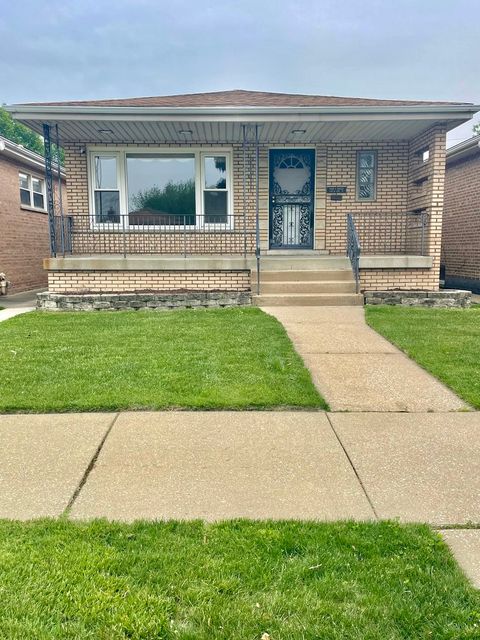
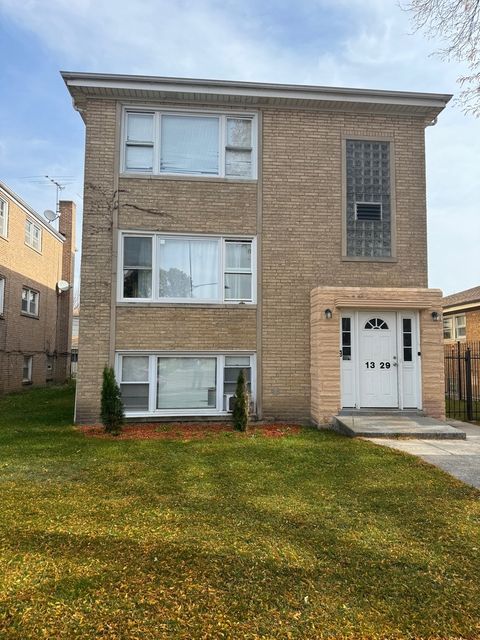
Active
$294,900
3
bds
|
3
ba
|
2,100
sqft
|
built
1943
9204 S Perry Ave, Chicago, IL 60620
$295
Cash flow
5.2%
Cash-on-Cash Return
6.9%
Cap rate
0.9%
Rent to Value Ratio
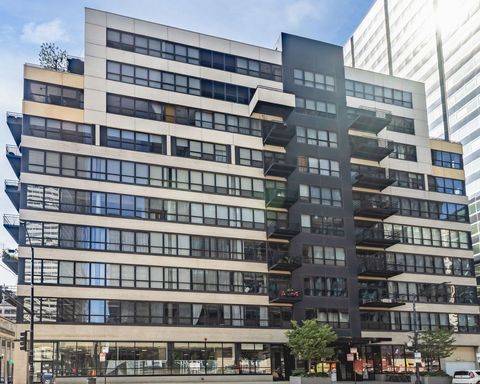
Active
$315,000
2
bds
|
2
ba
|
1,326
sqft
|
built
1904
161 W Harrison St, Chicago, IL 60605
$-605
Cash flow
-10.0%
Cash-on-Cash Return
3.4%
Cap rate
0.9%
Rent to Value Ratio
Active
$995,000
1
bds
|
2
ba
|
1,419
sqft
|
built
2007
401 N Wabash Ave, Chicago, IL 60611
$-4,393
Cash flow
-23.0%
Cash-on-Cash Return
0.4%
Cap rate
0.5%
Rent to Value Ratio
Active
$200,000
5
bds
|
3
ba
|
1,600
sqft
|
built
1888
10456 S Avenue L, Chicago, IL 60617
$536
Cash flow
14.0%
Cash-on-Cash Return
8.9%
Cap rate
1.1%
Rent to Value Ratio
Active
$299,900
1
bds
|
1
ba
|
725
sqft
|
built
1962
300 N State St, Chicago, IL 60654
$-837
Cash flow
-14.6%
Cash-on-Cash Return
2.3%
Cap rate
0.9%
Rent to Value Ratio
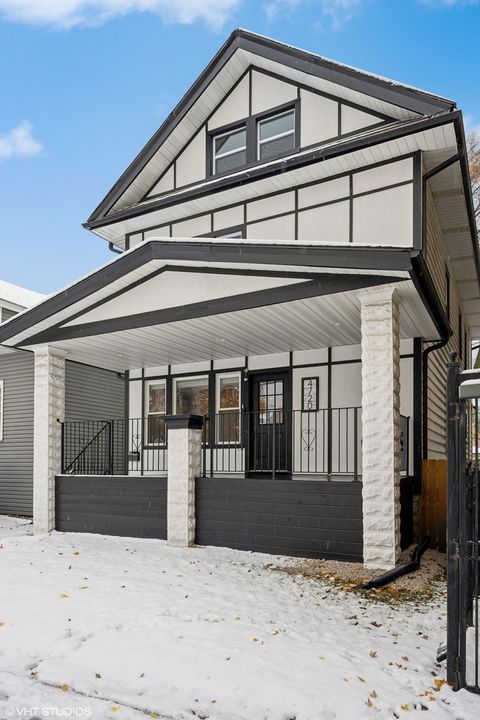
Active
$129,999
3
bds
|
2
ba
|
1,511
sqft
|
built
1910
6948 S Woodlawn Ave, Chicago, IL 60637
$591
Cash flow
23.7%
Cash-on-Cash Return
11.7%
Cap rate
1.5%
Rent to Value Ratio

Active
$274,000
5
bds
|
2
ba
|
0
sqft
|
built
1876
442 N Harding Ave, Chicago, IL 60624
$124
Cash flow
2.4%
Cash-on-Cash Return
6.2%
Cap rate
0.8%
Rent to Value Ratio
Active
$159,000
bds
|
1
ba
|
550
sqft
|
built
1960
3600 N Lake Shore Dr, Chicago, IL 60613
$-143
Cash flow
-4.7%
Cash-on-Cash Return
4.6%
Cap rate
1.1%
Rent to Value Ratio
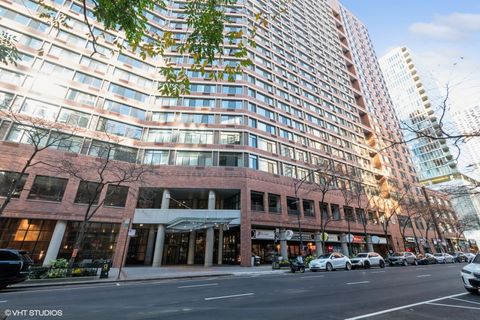
Active
$246,500
1
bds
|
1
ba
|
700
sqft
|
built
1987
211 E Ohio St, Chicago, IL 60611
$-624
Cash flow
-13.2%
Cash-on-Cash Return
2.6%
Cap rate
0.9%
Rent to Value Ratio

Active
$560,000
3
bds
|
3
ba
|
0
sqft
|
built
1968
2626 N Lakeview Ave, Chicago, IL 60614
$-2,724
Cash flow
-25.4%
Cash-on-Cash Return
-0.2%
Cap rate
0.6%
Rent to Value Ratio
Active
$599,000
8
bds
|
3
ba
|
0
sqft
|
built
1960
1329 N Latrobe Ave, Chicago, IL 60651
$-1,951
Cash flow
-17.0%
Cash-on-Cash Return
1.8%
Cap rate
0.4%
Rent to Value Ratio

Active
$299,000
1
bds
|
1
ba
|
906
sqft
|
built
1906
6 N Michigan Ave, Chicago, IL 60602
$-665
Cash flow
-11.6%
Cash-on-Cash Return
3.0%
Cap rate
0.8%
Rent to Value Ratio
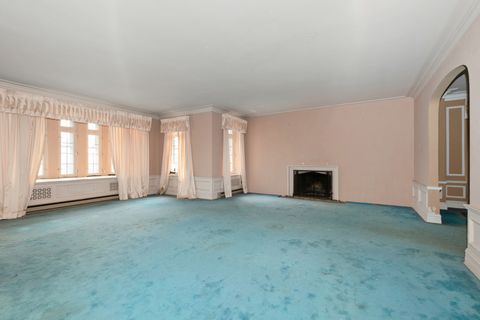
Active
$595,000
2
bds
|
2
ba
|
1,650
sqft
|
built
1964
1325 N State Pkwy, Chicago, IL 60610
$-2,429
Cash flow
-21.3%
Cash-on-Cash Return
0.8%
Cap rate
0.7%
Rent to Value Ratio
Active
$299,999
1
bds
|
1
ba
|
900
sqft
|
built
1969
130 S Canal St, Chicago, IL 60606
$-736
Cash flow
-12.8%
Cash-on-Cash Return
2.7%
Cap rate
0.8%
Rent to Value Ratio
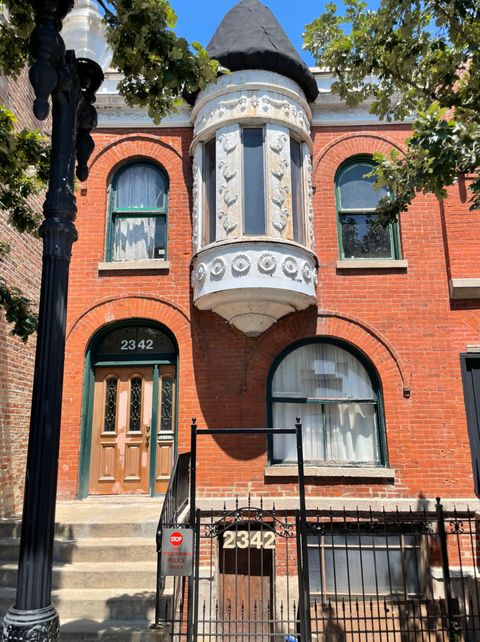
Active
$450,000
1
bds
|
2
ba
|
2,040
sqft
|
built
1898
2342 W Taylor St, Chicago, IL 60612
$-200
Cash flow
-2.3%
Cash-on-Cash Return
5.1%
Cap rate
0.8%
Rent to Value Ratio
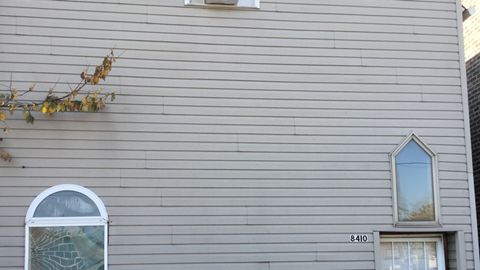
Active
$200,000
6
bds
|
3
ba
|
0
sqft
|
built
1881
8410 S Burley Ave, Chicago, IL 60617
$219
Cash flow
5.7%
Cash-on-Cash Return
7.0%
Cap rate
0.9%
Rent to Value Ratio
Active
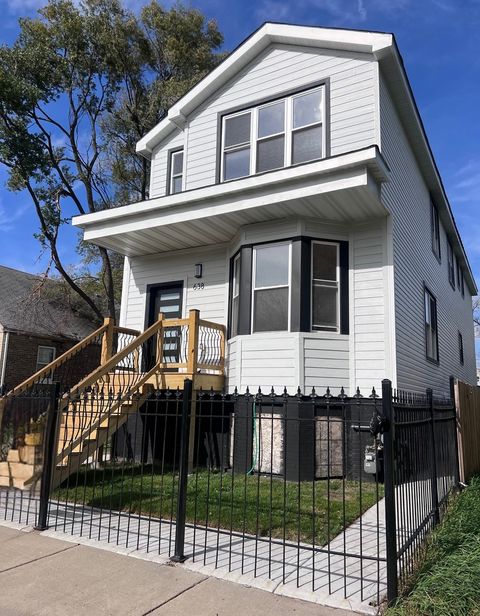
$590,000
4
bds
|
4
ba
|
3,808
sqft
|
built
1890
638 E 65th St, Chicago, IL 60637
$-1,002
Cash flow
-8.9%
Cash-on-Cash Return
3.6%
Cap rate
0.5%
Rent to Value Ratio

Active
$21,000,000
5
bds
|
6
ba
|
25,000
sqft
|
built
1914
1355 N Astor St, Chicago, IL 60610
$-108,895
Cash flow
-27.1%
Cash-on-Cash Return
-0.5%
Cap rate
0.0%
Rent to Value Ratio
Active
$575,000
1
bds
|
2
ba
|
1,455
sqft
|
built
1984
161 E Chicago Ave, Chicago, IL 60611
$-1,904
Cash flow
-17.3%
Cash-on-Cash Return
1.7%
Cap rate
0.8%
Rent to Value Ratio
Active
$129,000
4
bds
|
3
ba
|
0
sqft
|
built
1888
7505 S Emerald Ave, Chicago, IL 60620
$449
Cash flow
18.2%
Cash-on-Cash Return
9.9%
Cap rate
1.3%
Rent to Value Ratio