Chicago, IL Investment Properties for Sale
Browse homes for sale and investment properties in Chicago, IL. Refine your search by price, property type, or more.
Best cash flowing properties in Chicago, IL
Active
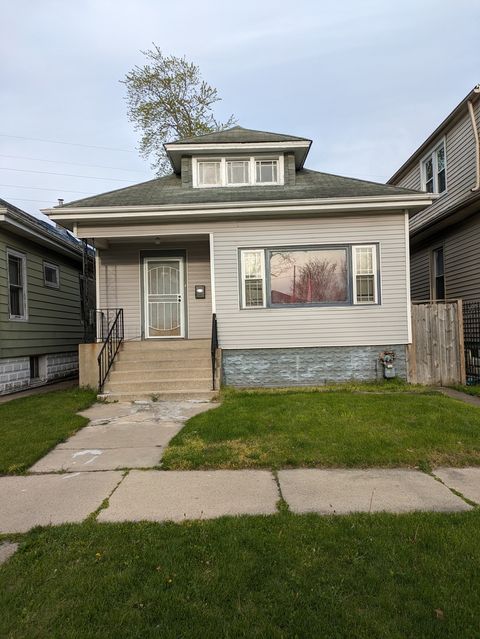
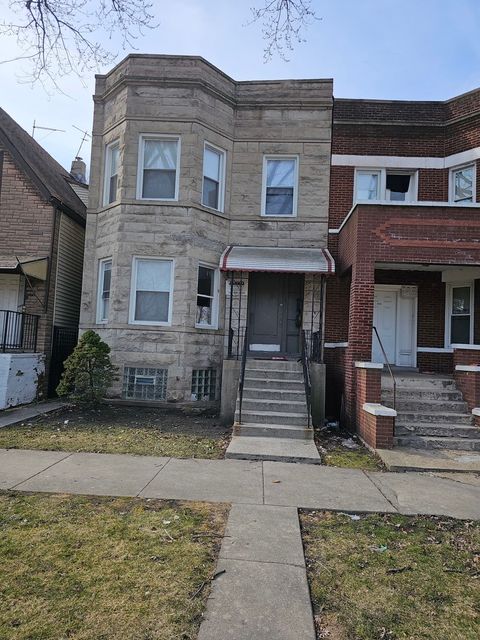
$125,000
3
bds
|
1
ba
|
958
sqft
|
built
1922
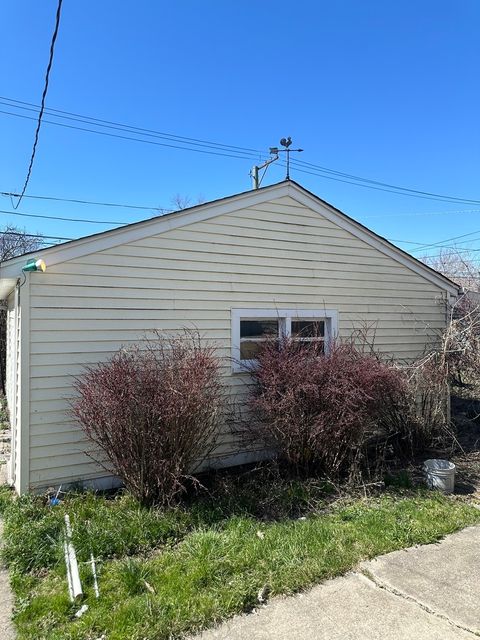
12115 S Emerald Ave, Chicago, IL 60628
$581
Cash flow
24.3%
Cash-on-Cash Return
11.3%
Cap rate
1.4%
Rent to Value Ratio

Active
$165,500
3
bds
|
2
ba
|
1,100
sqft
|
built
1910
8619 S Laflin St, Chicago, IL 60620
$439
Cash flow
13.8%
Cash-on-Cash Return
8.9%
Cap rate
1.2%
Rent to Value Ratio
3,966 out of 4,608 properties for sale in Chicago, IL
Limited Results Shown
Create a free account, or log in to reveal all property listings and enjoy the complete experience.

Active
$389,900
2
bds
|
2
ba
|
1,200
sqft
|
built
1959
4919 S Long Ave, Chicago, IL 60638
$-106
Cash flow
-1.4%
Cash-on-Cash Return
5.4%
Cap rate
0.8%
Rent to Value Ratio
Active
$170,000
5
bds
|
2
ba
|
0
sqft
|
built
1890
6921 S Normal Blvd, Chicago, IL 60621
$236
Cash flow
7.2%
Cash-on-Cash Return
7.3%
Cap rate
0.9%
Rent to Value Ratio
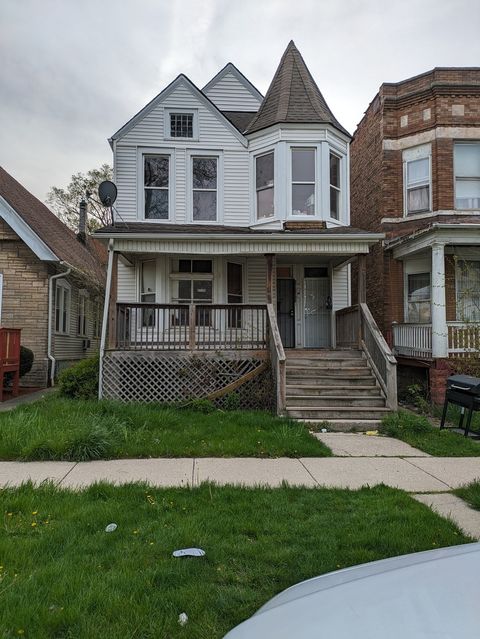
Active
$125,000
3
bds
|
1
ba
|
958
sqft
|
built
1922
12115 S Emerald Ave, Chicago, IL 60628
$581
Cash flow
24.3%
Cash-on-Cash Return
11.3%
Cap rate
1.4%
Rent to Value Ratio
Active
$130,000
4
bds
|
2
ba
|
1,240
sqft
|
built
1913
8127 S Coles Ave, Chicago, IL 60617
$420
Cash flow
16.9%
Cash-on-Cash Return
9.6%
Cap rate
1.2%
Rent to Value Ratio
Active
$815,000
12
bds
|
5
ba
|
0
sqft
|
built
1905
5330 S Wabash Ave, Chicago, IL 60615
$-2,791
Cash flow
-17.9%
Cash-on-Cash Return
1.6%
Cap rate
0.3%
Rent to Value Ratio
Active
$170,000
6
bds
|
2
ba
|
0
sqft
|
built
1890
12026 S Wallace St, Chicago, IL 60628
$231
Cash flow
7.1%
Cash-on-Cash Return
7.3%
Cap rate
0.9%
Rent to Value Ratio
Active
$345,000
bds
|
0
ba
|
0
sqft
|
built
1890
3633 S Calumet Ave, Chicago, IL 60653
$-349
Cash flow
-5.3%
Cash-on-Cash Return
4.5%
Cap rate
0.7%
Rent to Value Ratio
Active
$1,295,000
3
bds
|
4
ba
|
2,985
sqft
|
built
1968
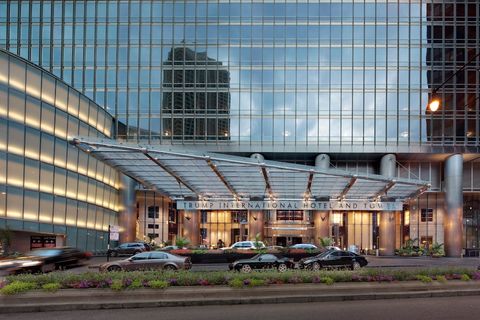
505 N Lake Shore Dr, Chicago, IL 60611
$-6,546
Cash flow
-26.4%
Cash-on-Cash Return
-0.4%
Cap rate
0.5%
Rent to Value Ratio
Active
$538,900
5
bds
|
3
ba
|
0
sqft
|
built
1918
3145 W 42nd St, Chicago, IL 60632
$-1,344
Cash flow
-13.0%
Cash-on-Cash Return
2.7%
Cap rate
0.4%
Rent to Value Ratio
Active
$2,500,000
3
bds
|
4
ba
|
3,080
sqft
|
built
2008
401 N Wabash Ave, Chicago, IL 60611
$-12,879
Cash flow
-26.9%
Cash-on-Cash Return
-0.5%
Cap rate
0.4%
Rent to Value Ratio
Active
$410,000
10
bds
|
4
ba
|
0
sqft
|
built
1922
417 E 60th St, Chicago, IL 60637
$-1,126
Cash flow
-14.3%
Cash-on-Cash Return
2.4%
Cap rate
0.4%
Rent to Value Ratio
Active
$1,095,000
3
bds
|
3
ba
|
1,875
sqft
|
built
1982
360 E Randolph St, Chicago, IL 60601
$-3,891
Cash flow
-18.5%
Cash-on-Cash Return
1.4%
Cap rate
0.7%
Rent to Value Ratio
Active
$1,199,000
2
bds
|
3
ba
|
2,000
sqft
|
built
2000
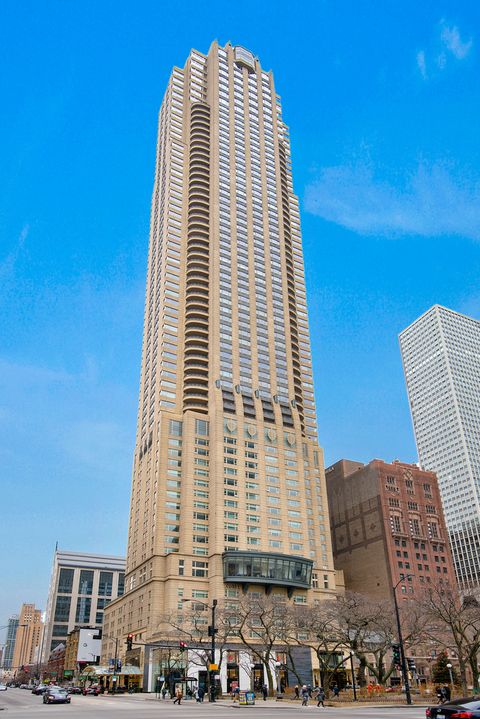
800 N Michigan Ave, Chicago, IL 60611
$-5,013
Cash flow
-21.8%
Cash-on-Cash Return
0.7%
Cap rate
0.5%
Rent to Value Ratio

Active
$260,000
5
bds
|
2
ba
|
1,425
sqft
|
built
1929
7823 S Indiana Ave, Chicago, IL 60619
$-102
Cash flow
-2.0%
Cash-on-Cash Return
5.2%
Cap rate
0.8%
Rent to Value Ratio
Active
$290,000
5
bds
|
2
ba
|
0
sqft
|
built
1900
6930 S Wabash Ave, Chicago, IL 60637
$-328
Cash flow
-5.9%
Cash-on-Cash Return
4.3%
Cap rate
0.6%
Rent to Value Ratio

Active
$325,000
1
bds
|
1
ba
|
849
sqft
|
built
1992
440 N Wabash Ave, Chicago, IL 60611
$-1,012
Cash flow
-16.2%
Cash-on-Cash Return
1.9%
Cap rate
0.8%
Rent to Value Ratio

Active
$799,000
4
bds
|
4
ba
|
3,200
sqft
|
built
1922
844 W Agatite Ave, Chicago, IL 60640
$-1,915
Cash flow
-12.5%
Cash-on-Cash Return
2.8%
Cap rate
0.6%
Rent to Value Ratio
Active
$165,000
6
bds
|
2
ba
|
0
sqft
|
built
1893
6750 S Peoria St, Chicago, IL 60621
$319
Cash flow
10.1%
Cash-on-Cash Return
8.0%
Cap rate
1.0%
Rent to Value Ratio

Active
$495,000
5
bds
|
3
ba
|
0
sqft
|
built
1900
3120 S Normal Ave, Chicago, IL 60616
$-1,528
Cash flow
-16.1%
Cash-on-Cash Return
2.0%
Cap rate
0.4%
Rent to Value Ratio
Active
$175,000
3
bds
|
2
ba
|
1,039
sqft
|
built
1958
9128 S Union Ave, Chicago, IL 60620
$300
Cash flow
8.9%
Cash-on-Cash Return
7.7%
Cap rate
1.1%
Rent to Value Ratio

Active
$183,000
2
bds
|
1
ba
|
1,000
sqft
|
built
1942
2323 W Pershing Rd, Chicago, IL 60609
$-447
Cash flow
-12.7%
Cash-on-Cash Return
2.7%
Cap rate
1.0%
Rent to Value Ratio
Active
$2,600,000
3
bds
|
4
ba
|
4,200
sqft
|
built
2000
800 N Michigan Ave, Chicago, IL 60611
$-14,928
Cash flow
-30.0%
Cash-on-Cash Return
-1.2%
Cap rate
0.3%
Rent to Value Ratio
Active
$155,000
3
bds
|
3
ba
|
0
sqft
|
built
1915
9220 S King Dr, Chicago, IL 60619
$194
Cash flow
6.5%
Cash-on-Cash Return
7.2%
Cap rate
1.0%
Rent to Value Ratio
Active
$59,000
1
bds
|
1
ba
|
780
sqft
|
built
1964
7337 S South Shore Dr, Chicago, IL 60649
$126
Cash flow
2.5%
Cash-on-Cash Return
2.6%
Cap rate
1.9%
Rent to Value Ratio
Active
$9,995,000
10
bds
|
10
ba
|
13,400
sqft
|
built
1885
2026 N Kenmore Ave, Chicago, IL 60614
$-58,890
Cash flow
-30.7%
Cash-on-Cash Return
-1.4%
Cap rate
0.0%
Rent to Value Ratio

Active
$2,200,000
3
bds
|
3
ba
|
4,500
sqft
|
built
1984
161 E Chicago Ave, Chicago, IL 60611
$-14,278
Cash flow
-33.9%
Cash-on-Cash Return
-2.1%
Cap rate
0.3%
Rent to Value Ratio
Active
$219,900
1
bds
|
1
ba
|
995
sqft
|
built
2006
2335 W Belle Plaine Ave, Chicago, IL 60618
$-381
Cash flow
-9.0%
Cash-on-Cash Return
3.6%
Cap rate
0.9%
Rent to Value Ratio

Active
$245,000
1
bds
|
1
ba
|
1,100
sqft
|
built
1972
2828 N Burling St, Chicago, IL 60657
$-322
Cash flow
-6.9%
Cash-on-Cash Return
4.1%
Cap rate
0.9%
Rent to Value Ratio

Active
$6,000,000
4
bds
|
6
ba
|
4,029
sqft
|
built
2008
401 N Wabash Ave, Chicago, IL 60611
$-33,430
Cash flow
-29.1%
Cash-on-Cash Return
-1.0%
Cap rate
0.2%
Rent to Value Ratio

Active
$175,000
7
bds
|
2
ba
|
0
sqft
|
built
1895
1515 W Garfield Blvd, Chicago, IL 60636
$-170
Cash flow
-5.1%
Cash-on-Cash Return
4.5%
Cap rate
0.6%
Rent to Value Ratio

Active
$349,000
11
bds
|
5
ba
|
0
sqft
|
built
1902
8846 S Houston Ave, Chicago, IL 60617
$-642
Cash flow
-9.6%
Cash-on-Cash Return
3.5%
Cap rate
0.5%
Rent to Value Ratio

Active
$232,999
3
bds
|
2
ba
|
1,200
sqft
|
built
2007
3008 W Flournoy St, Chicago, IL 60612
$109
Cash flow
2.4%
Cash-on-Cash Return
6.2%
Cap rate
0.9%
Rent to Value Ratio

Active
$485,000
3
bds
|
2
ba
|
1,391
sqft
|
built
2006
1720 S Michigan Ave, Chicago, IL 60616
$-1,608
Cash flow
-17.3%
Cash-on-Cash Return
1.7%
Cap rate
0.7%
Rent to Value Ratio

Active
$232,999
3
bds
|
2
ba
|
1,300
sqft
|
built
2007
3008 W Flournoy St, Chicago, IL 60612
$-29
Cash flow
-0.6%
Cash-on-Cash Return
5.5%
Cap rate
0.9%
Rent to Value Ratio

Active
$515,000
8
bds
|
8
ba
|
0
sqft
|
built
1892
1817 S Ashland Ave, Chicago, IL 60608
$-1,346
Cash flow
-13.6%
Cash-on-Cash Return
2.5%
Cap rate
0.3%
Rent to Value Ratio

Active
$349,900
4
bds
|
2
ba
|
1,741
sqft
|
built
1904
5644 S Wabash Ave, Chicago, IL 60637
$-700
Cash flow
-10.4%
Cash-on-Cash Return
3.3%
Cap rate
0.5%
Rent to Value Ratio
Active
$165,500
3
bds
|
2
ba
|
1,100
sqft
|
built
1910
8619 S Laflin St, Chicago, IL 60620
$439
Cash flow
13.8%
Cash-on-Cash Return
8.9%
Cap rate
1.2%
Rent to Value Ratio
Active
$209,900
1
bds
|
1
ba
|
920
sqft
|
built
2007
2335 W Belle Plaine Ave, Chicago, IL 60618
$-328
Cash flow
-8.2%
Cash-on-Cash Return
3.8%
Cap rate
1.0%
Rent to Value Ratio
Active
$320,000
4
bds
|
2
ba
|
0
sqft
|
built
1923
8014 S Jeffery Blvd, Chicago, IL 60617
$-185
Cash flow
-3.0%
Cash-on-Cash Return
5.0%
Cap rate
0.7%
Rent to Value Ratio

Active
$10,000,000
4
bds
|
7
ba
|
9,000
sqft
|
built
2024
1867 N Burling St, Chicago, IL 60614
$-43,321
Cash flow
-22.6%
Cash-on-Cash Return
0.5%
Cap rate
0.1%
Rent to Value Ratio