Chicago, IL Investment Properties for Sale
Browse homes for sale and investment properties in Chicago, IL. Refine your search by price, property type, or more.
Best cash flowing properties in Chicago, IL
Active
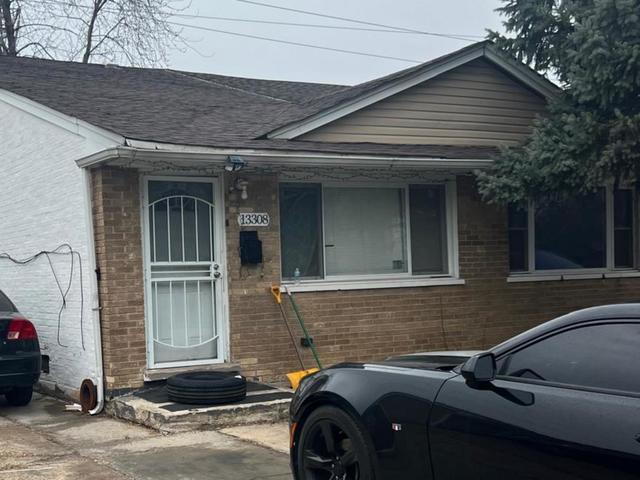
$115,000
3
bds
|
1
ba
|
731
sqft
|
built
1965
13308 S Riverdale Ave, Chicago, IL 60827
$571
Cash flow
25.9%
Cash-on-Cash Return
12.2%
Cap rate
1.5%
Rent to Value Ratio
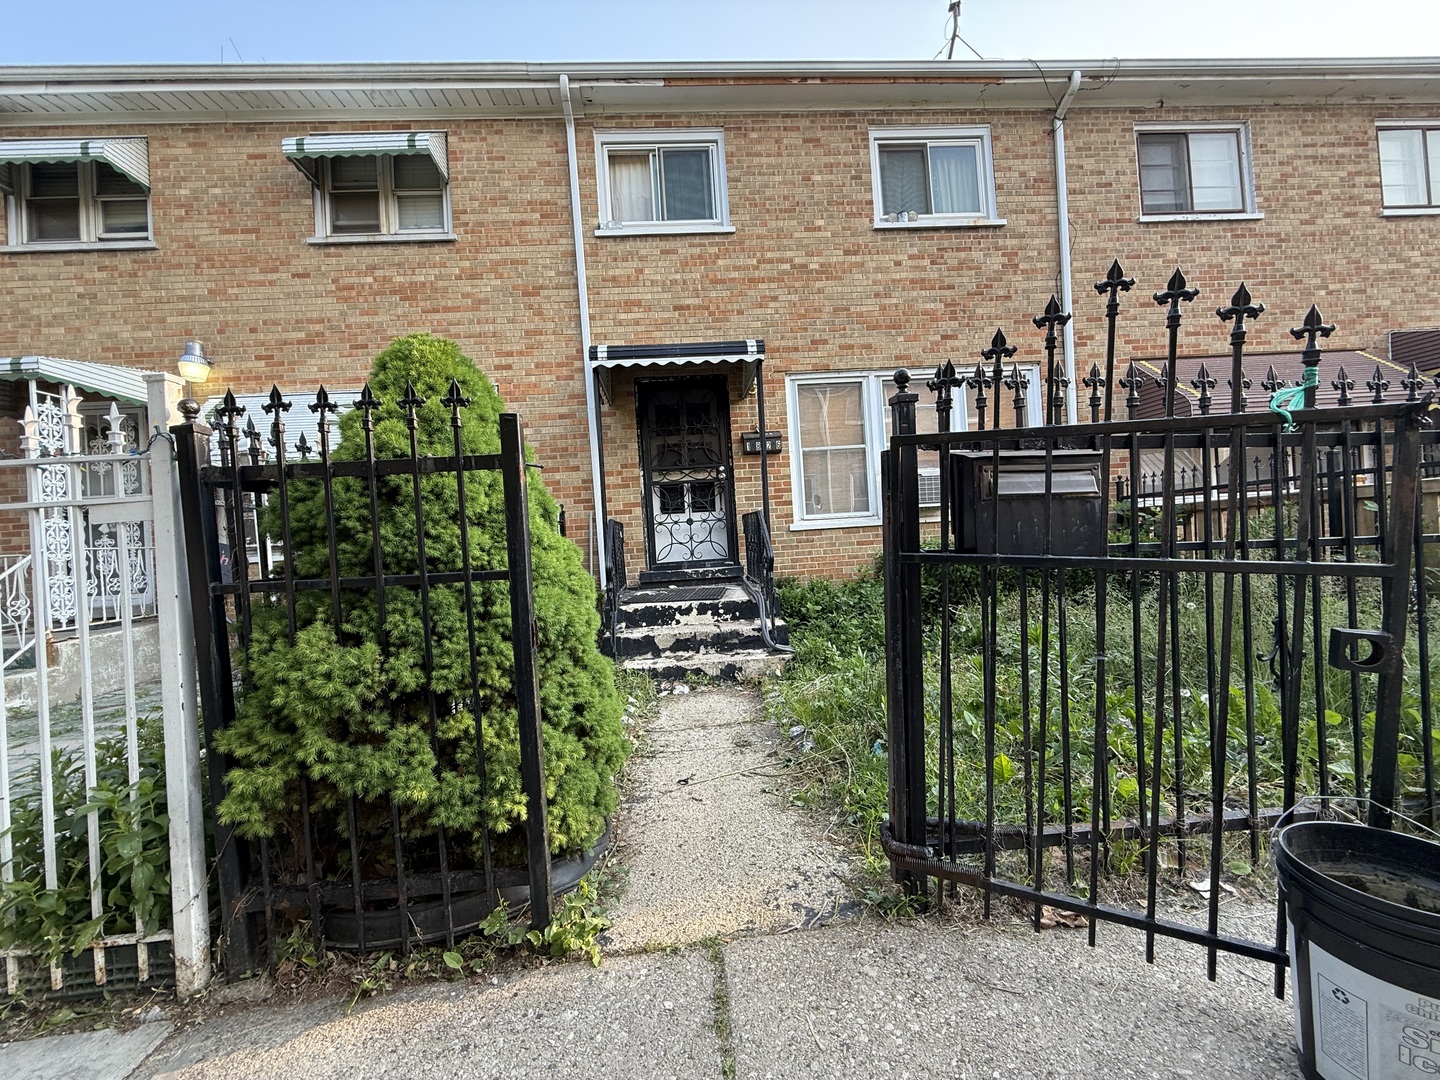
Active
$79,000
4
bds
|
2
ba
|
1,198
sqft
|
built
1964
1826 S Kildare Ave, Chicago, IL 60623
$549
Cash flow
36.3%
Cash-on-Cash Return
14.6%
Cap rate
2.0%
Rent to Value Ratio
76 out of 95 properties for sale in Chicago, IL
Limited Results Shown
Create a free account, or log in to reveal all property listings and enjoy the complete experience.
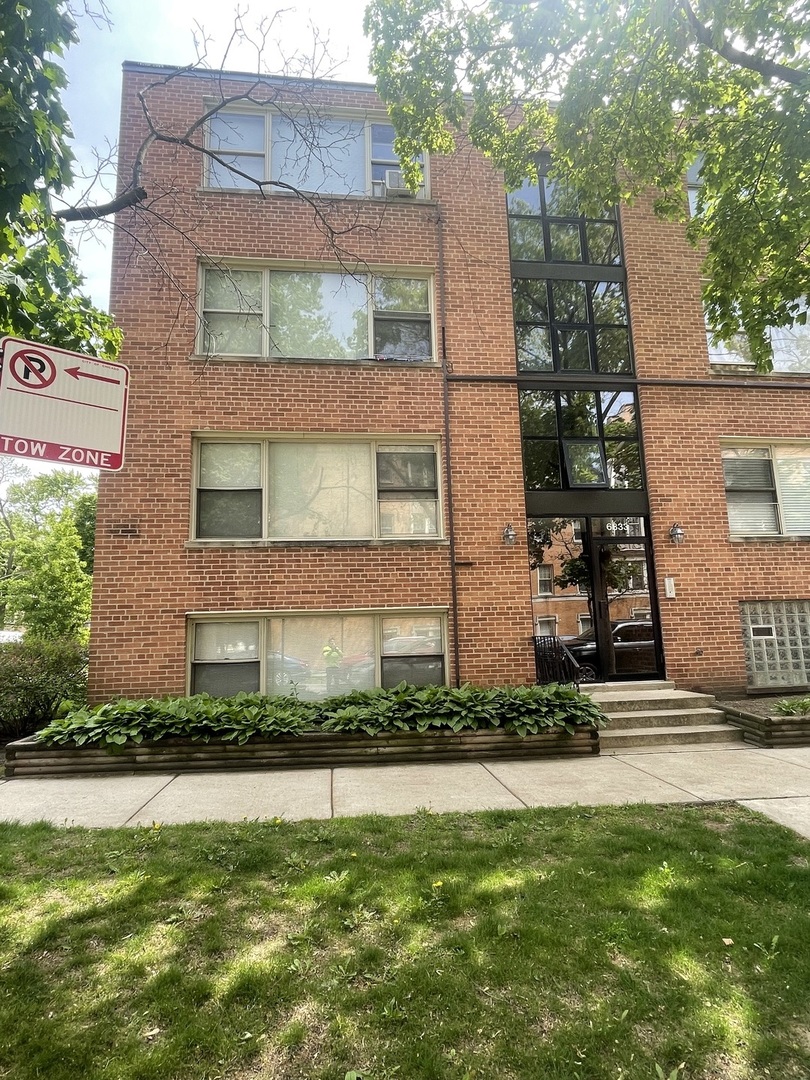
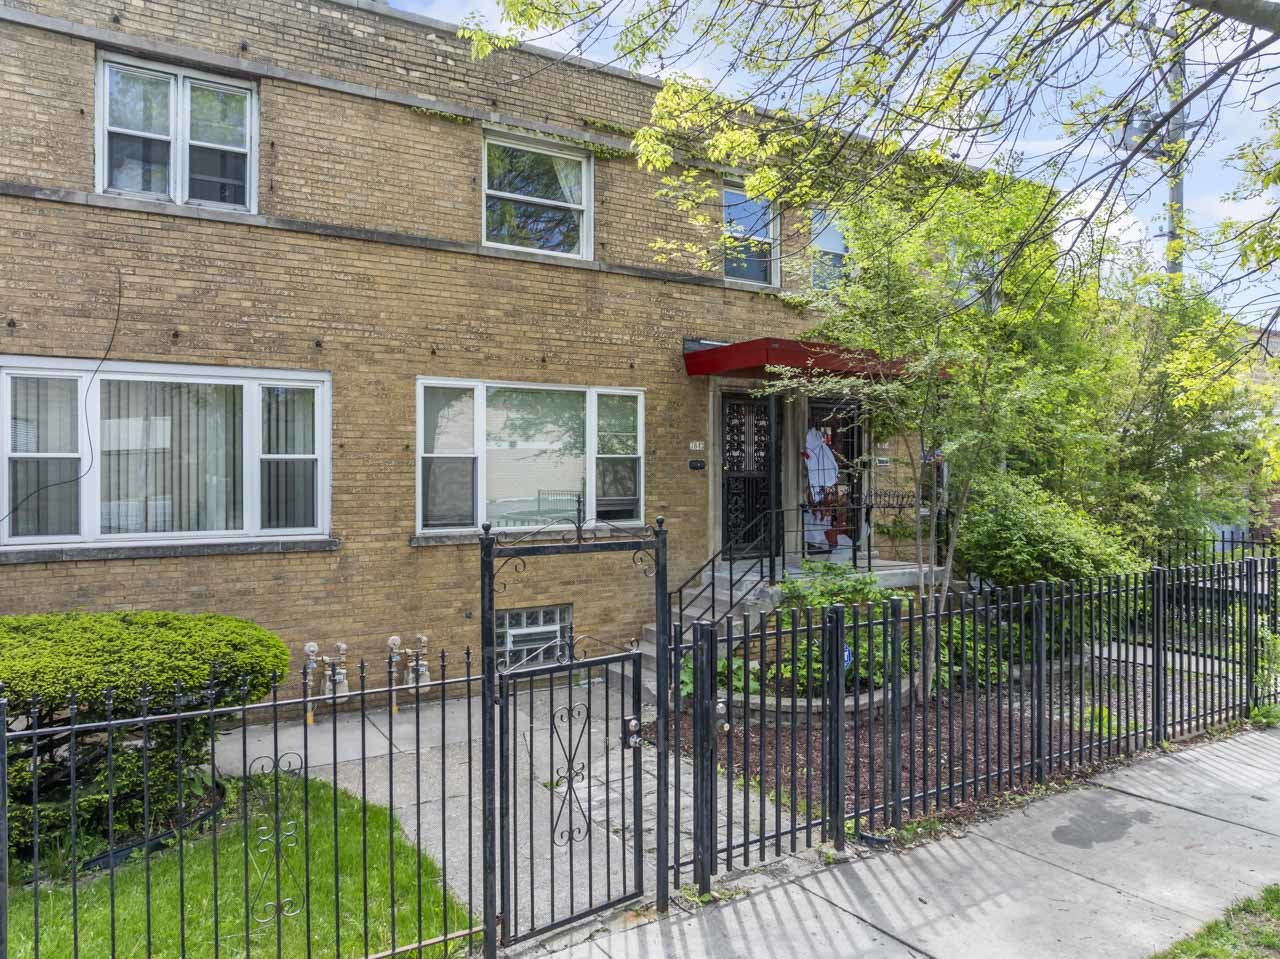
Active
$145,000
1
bds
|
1
ba
|
700
sqft
|
built
1950
6833 N Oakley Ave, Chicago, IL 60645
$-254
Cash flow
-9.1%
Cash-on-Cash Return
4.2%
Cap rate
1.0%
Rent to Value Ratio
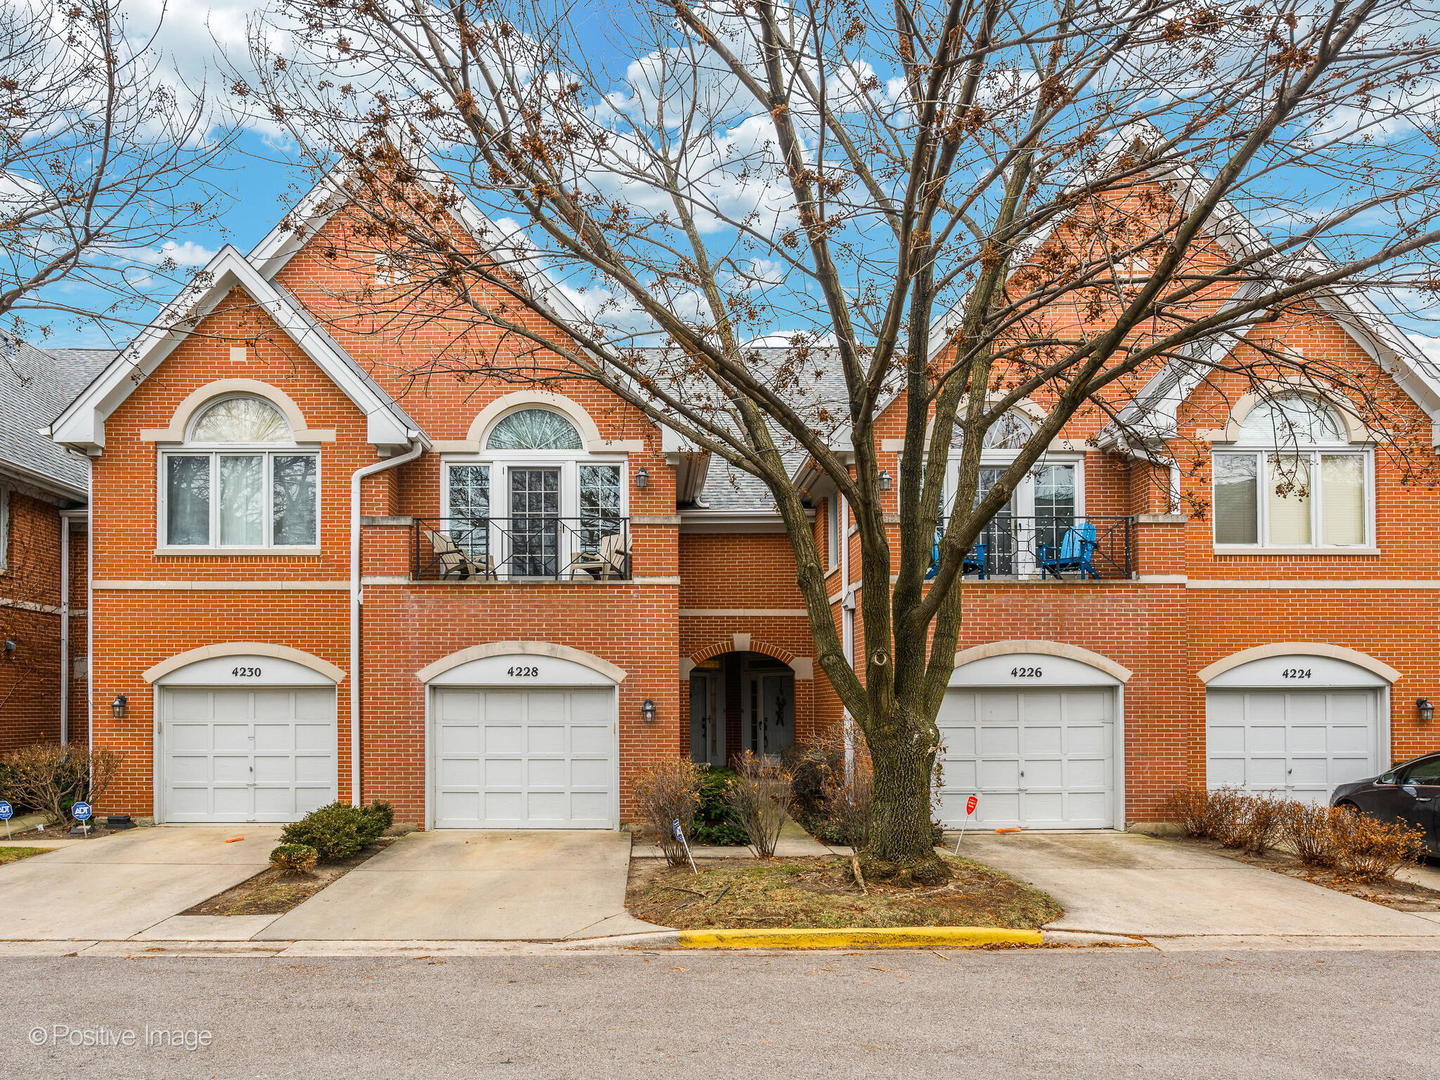
Active
$499,900
2
bds
|
3
ba
|
0
sqft
|
built
1990
4228 W Harrington Ln, Chicago, IL 60646
$-1,348
Cash flow
-14.1%
Cash-on-Cash Return
3.0%
Cap rate
0.6%
Rent to Value Ratio
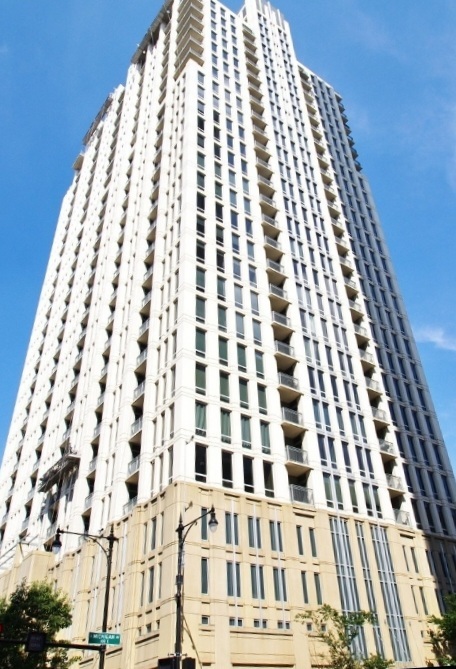
Active
$299,900
1
bds
|
1
ba
|
853
sqft
|
built
2005
1250 S Michigan Ave, Chicago, IL 60605
$-788
Cash flow
-13.7%
Cash-on-Cash Return
3.1%
Cap rate
0.8%
Rent to Value Ratio
Active
$79,000
4
bds
|
2
ba
|
1,198
sqft
|
built
1964
1826 S Kildare Ave, Chicago, IL 60623
$549
Cash flow
36.3%
Cash-on-Cash Return
14.6%
Cap rate
2.0%
Rent to Value Ratio
Active
$115,000
3
bds
|
1
ba
|
731
sqft
|
built
1965
13308 S Riverdale Ave, Chicago, IL 60827
$571
Cash flow
25.9%
Cash-on-Cash Return
12.2%
Cap rate
1.5%
Rent to Value Ratio
Active
$1,325,000
3
bds
|
4
ba
|
3,067
sqft
|
built
2004
1218 N Orleans St, Chicago, IL 60610
$-4,384
Cash flow
-17.3%
Cash-on-Cash Return
2.3%
Cap rate
0.5%
Rent to Value Ratio
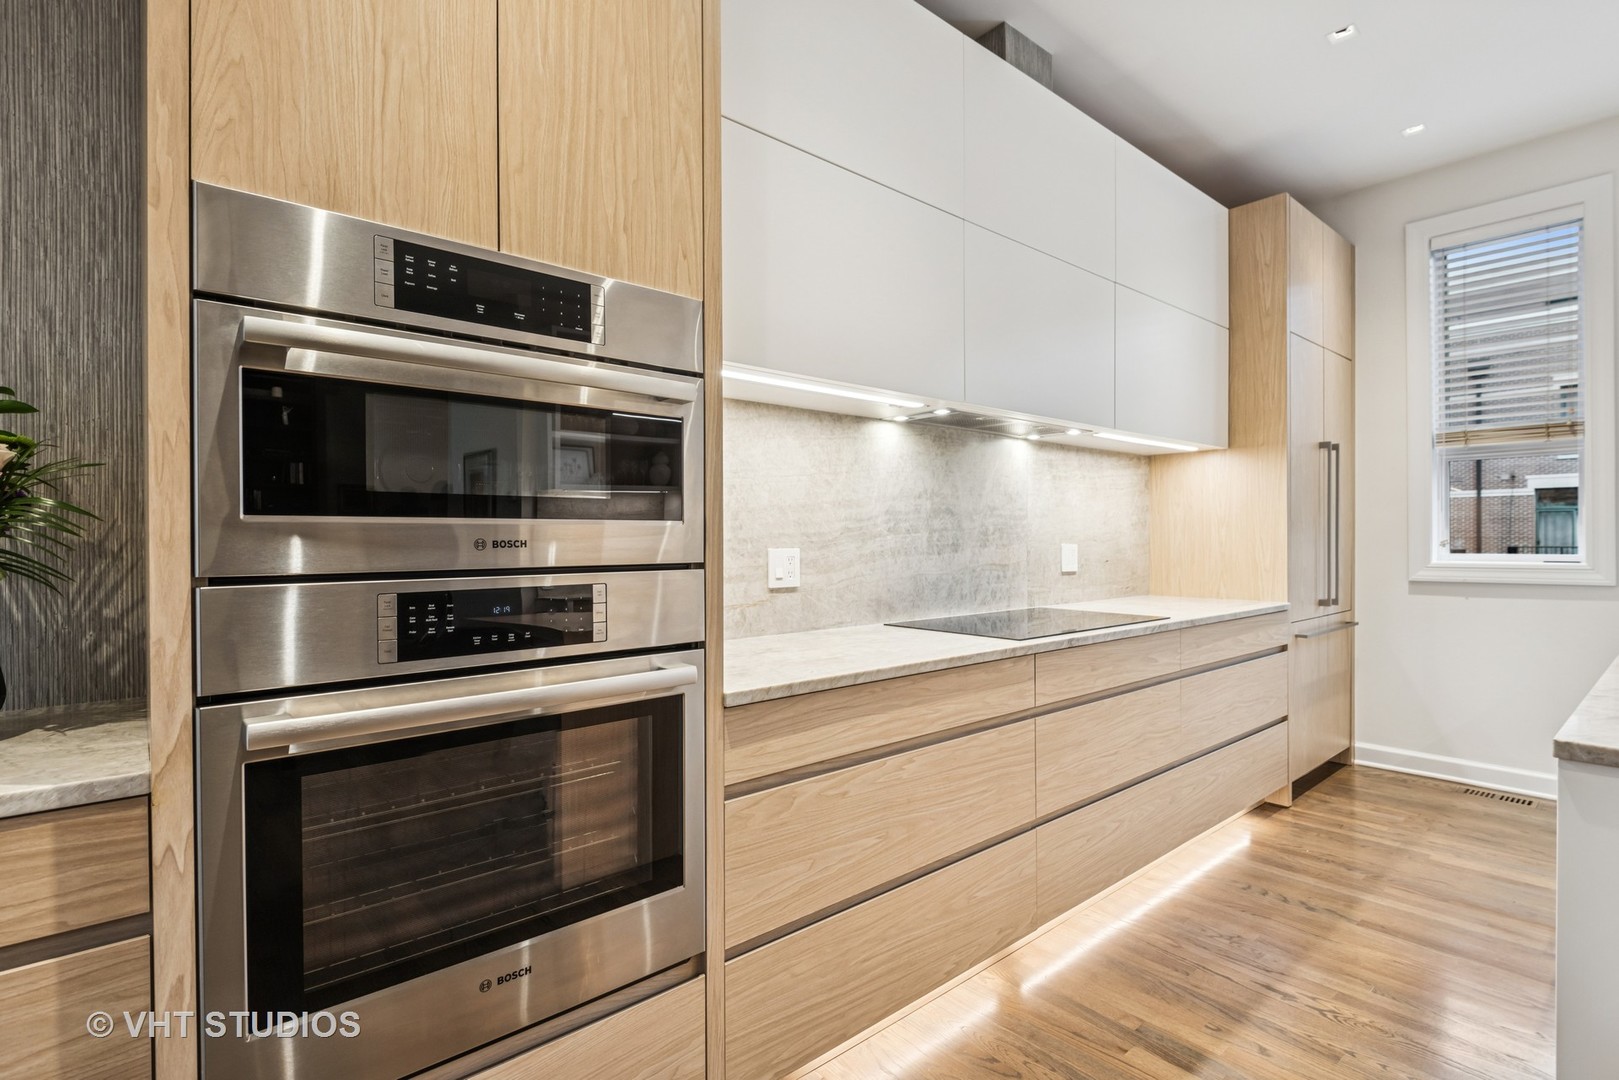
Active
$1,175,000
3
bds
|
3
ba
|
2,750
sqft
|
built
1980
1318 N Sutton Pl, Chicago, IL 60610
$-3,461
Cash flow
-15.4%
Cash-on-Cash Return
2.7%
Cap rate
0.7%
Rent to Value Ratio
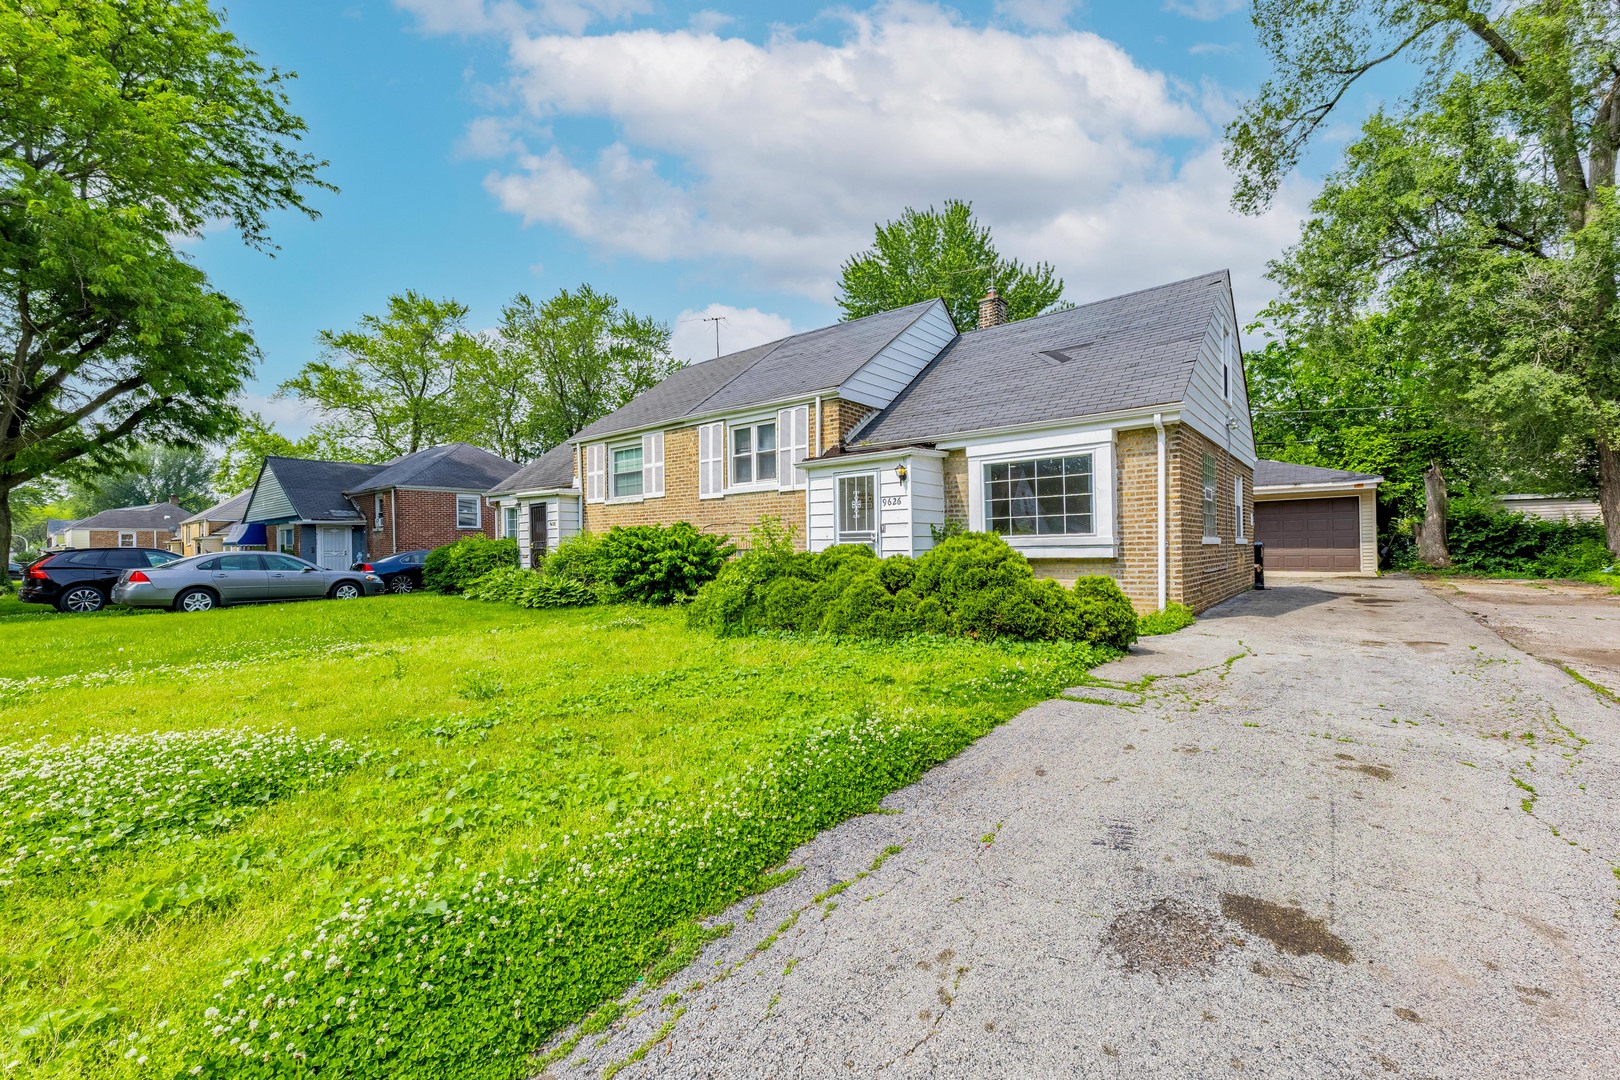
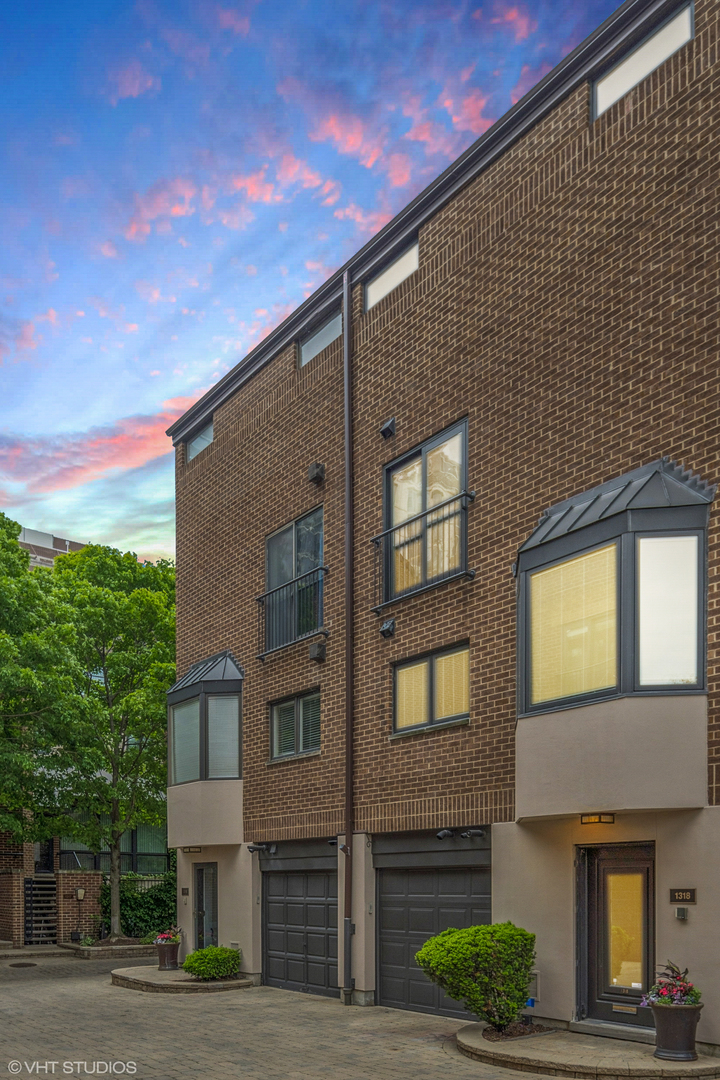
Active
$145,000
3
bds
|
2
ba
|
981
sqft
|
built
1948
9626 S Oglesby Ave, Chicago, IL 60617
$326
Cash flow
11.7%
Cash-on-Cash Return
9.0%
Cap rate
1.2%
Rent to Value Ratio
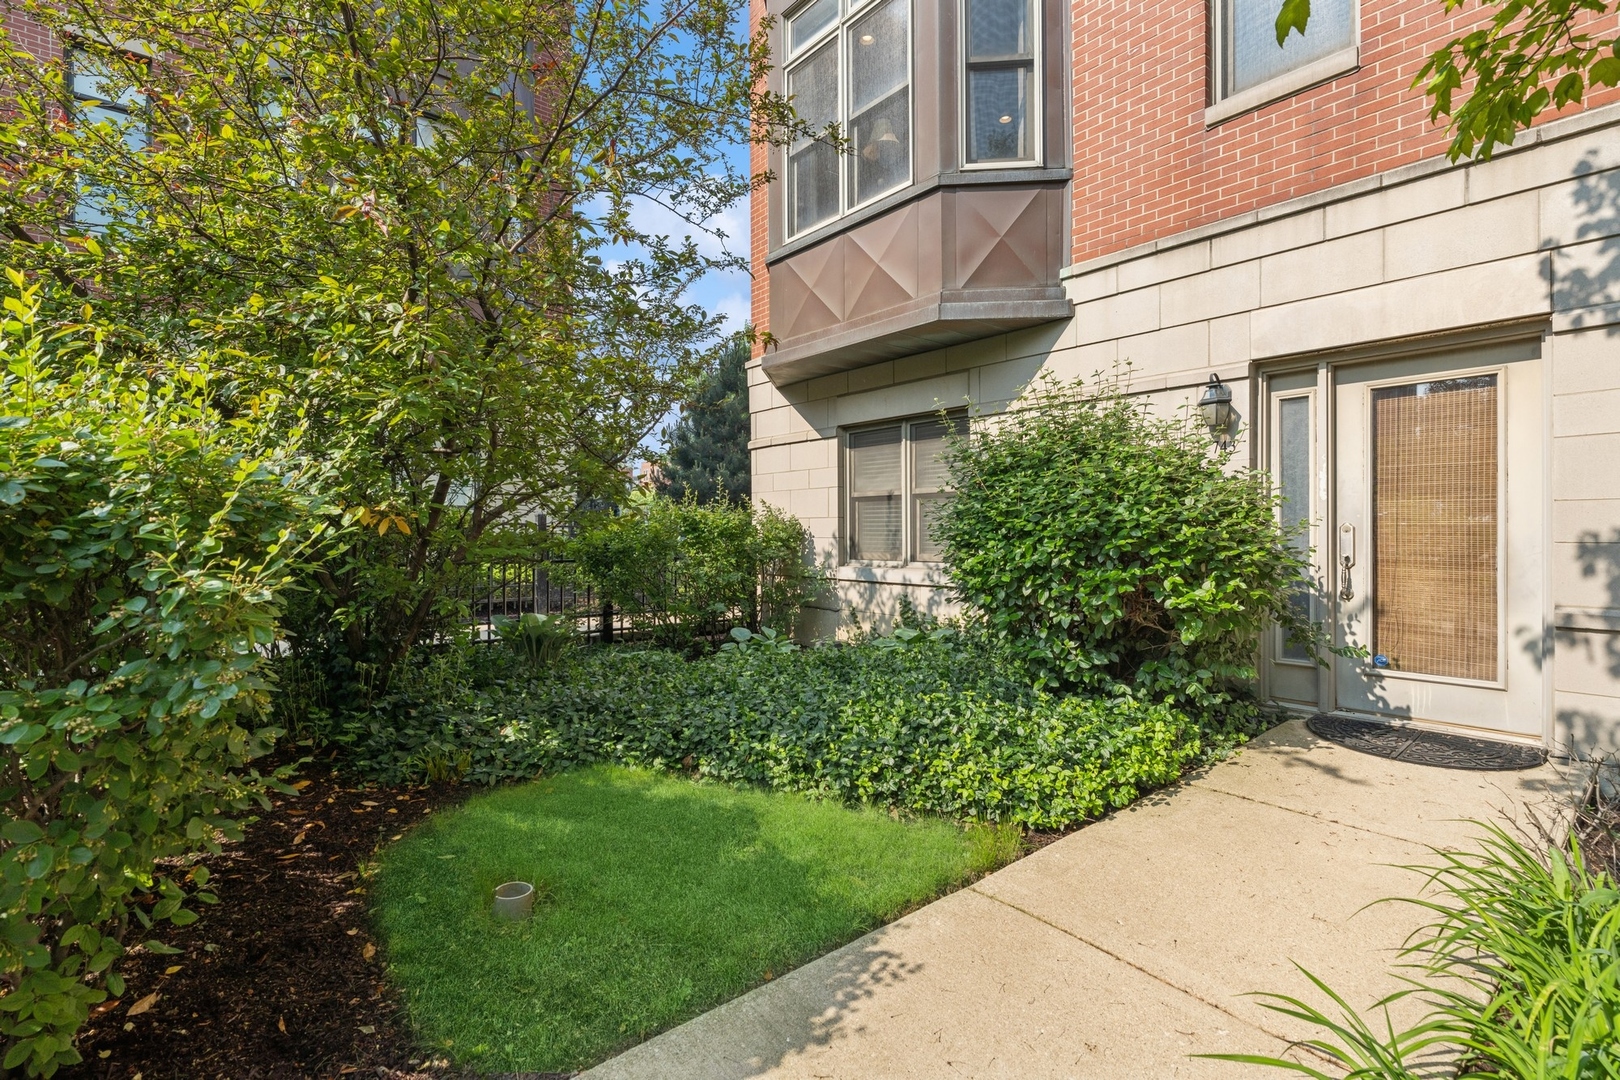
Active
$849,500
4
bds
|
4
ba
|
2,907
sqft
|
built
2008
743 W 15th St, Chicago, IL 60607
$-2,764
Cash flow
-17.0%
Cash-on-Cash Return
2.4%
Cap rate
0.5%
Rent to Value Ratio
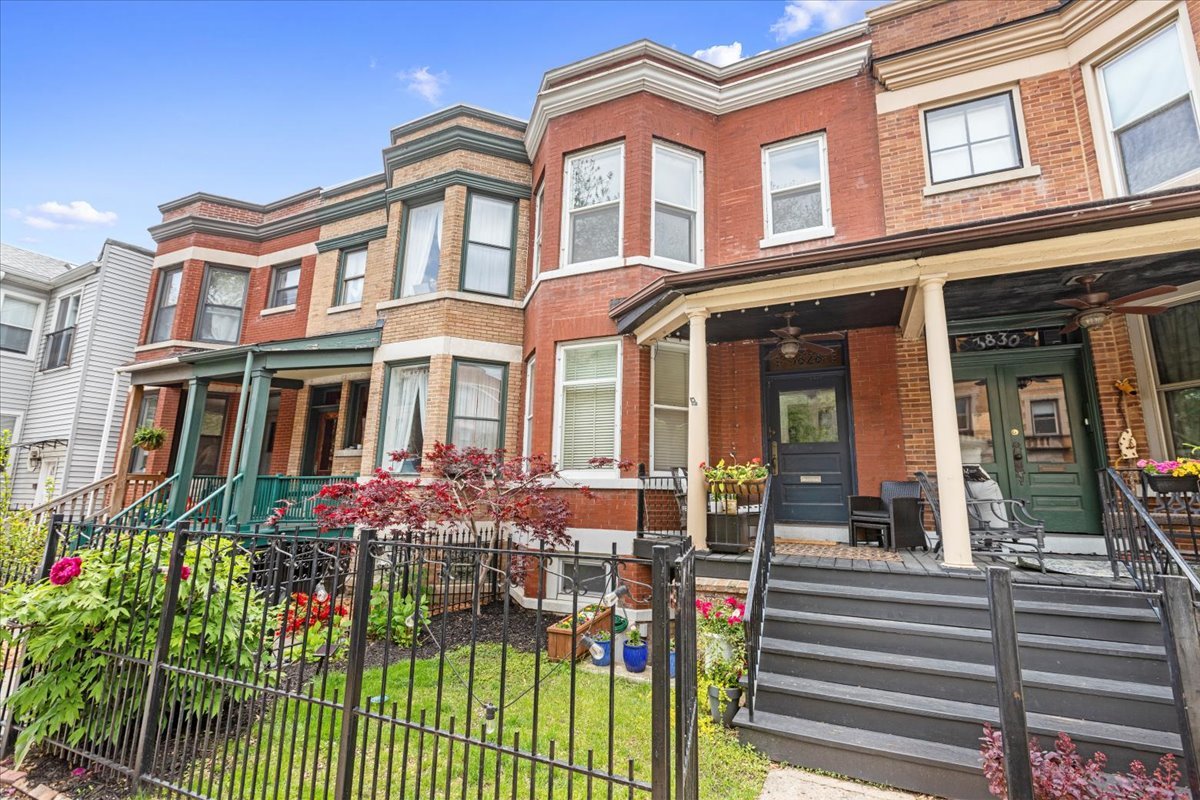
Active under contract
$650,000
3
bds
|
3
ba
|
0
sqft
|
built
1886
3828 N Wilton Ave, Chicago, IL 60613
$-1,068
Cash flow
-8.6%
Cash-on-Cash Return
4.3%
Cap rate
0.7%
Rent to Value Ratio
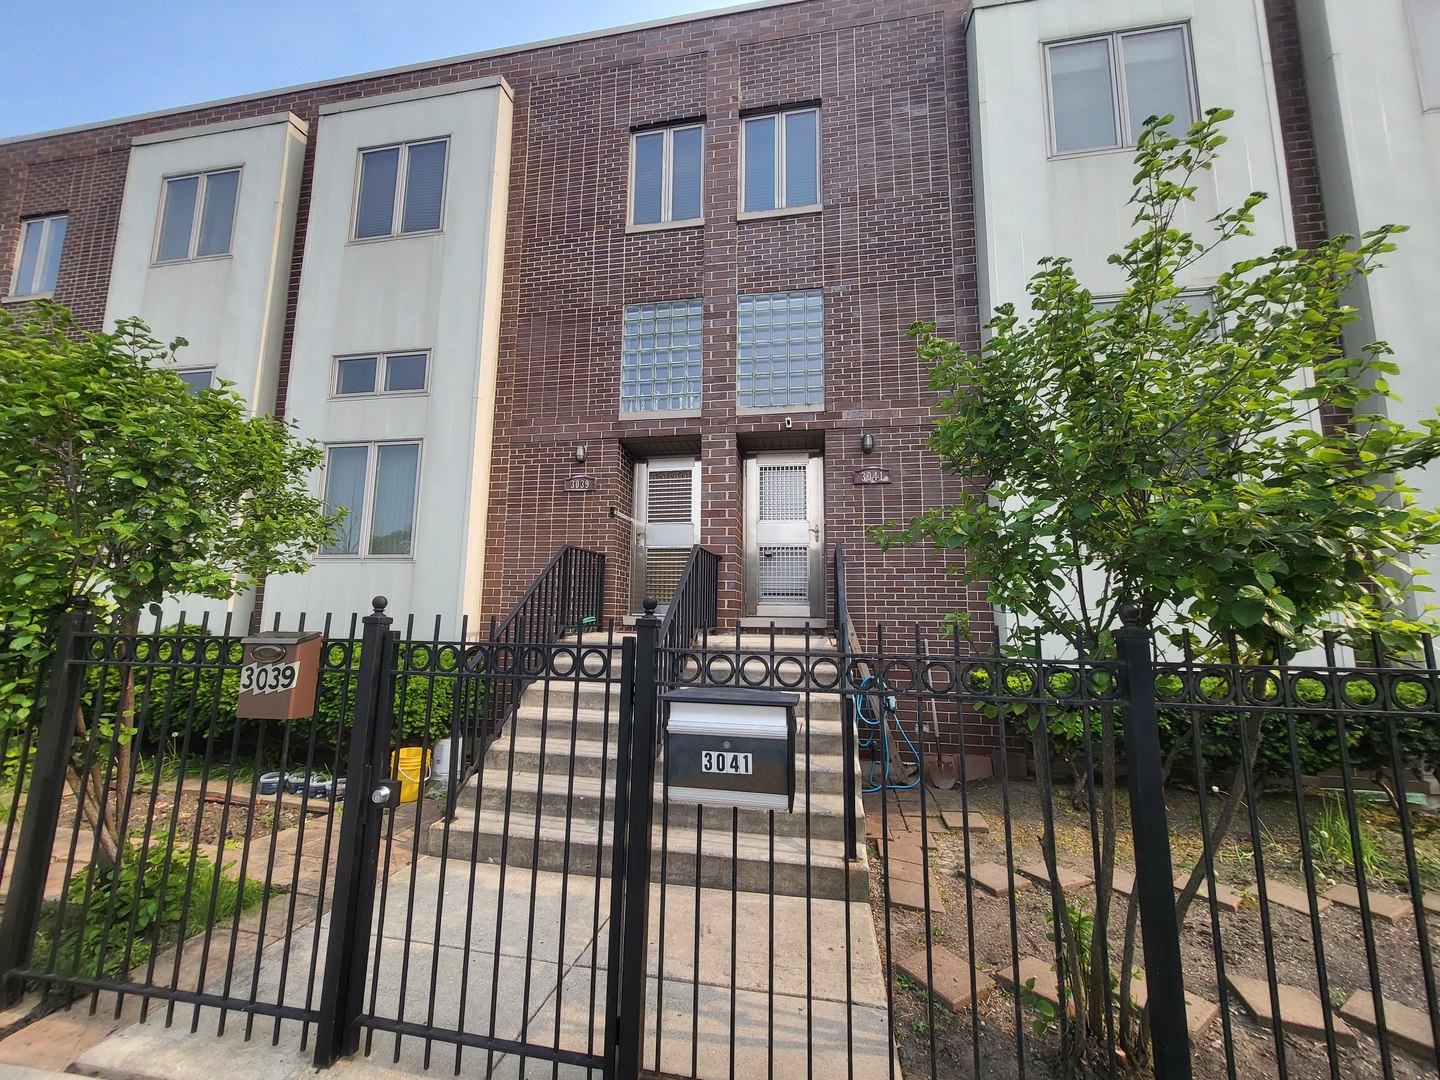
Active under contract
$439,000
3
bds
|
3
ba
|
1,663
sqft
|
built
2005
3041 W Pope John Paul Ii Dr, Chicago, IL 60632
$-803
Cash flow
-9.5%
Cash-on-Cash Return
4.1%
Cap rate
0.6%
Rent to Value Ratio
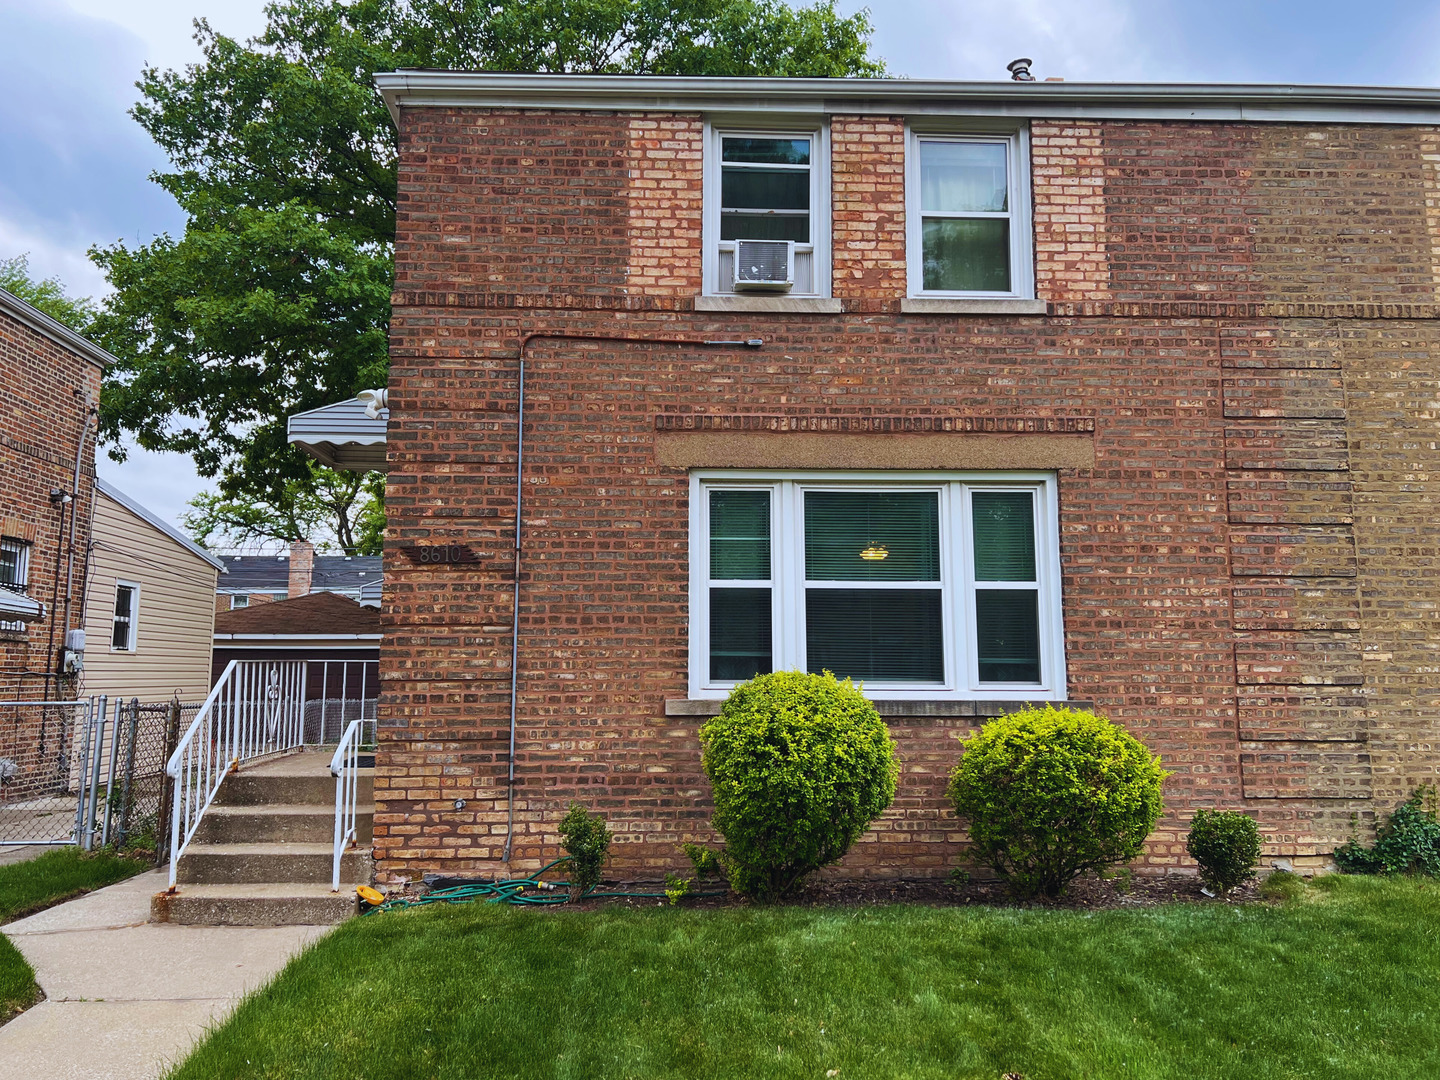
Pending
$145,000
2
bds
|
1
ba
|
1,000
sqft
|
built
1946
8610 S Champlain Ave, Chicago, IL 60619
$330
Cash flow
11.9%
Cash-on-Cash Return
9.0%
Cap rate
1.2%
Rent to Value Ratio
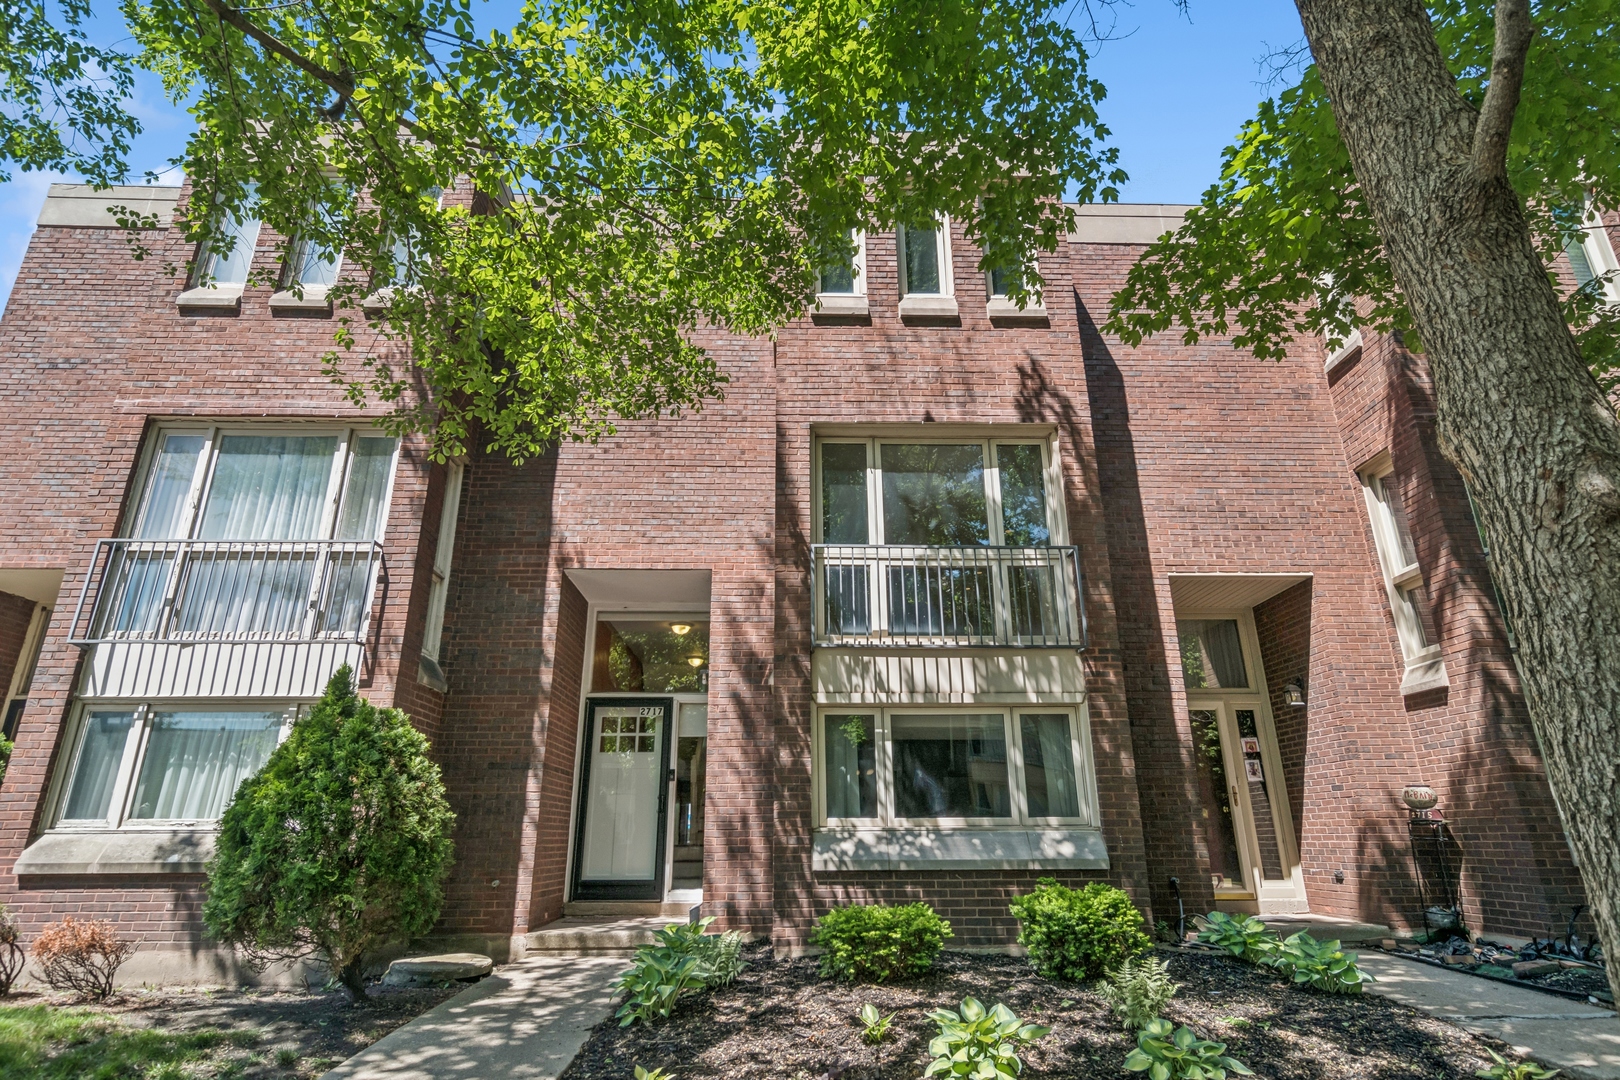
Active
$399,999
4
bds
|
3
ba
|
2,400
sqft
|
built
1969
2717 S Michigan Ave, Chicago, IL 60616
$-838
Cash flow
-10.9%
Cash-on-Cash Return
3.8%
Cap rate
0.8%
Rent to Value Ratio
Pending
$205,000
3
bds
|
2
ba
|
1,400
sqft
|
built
1949
9717 S Chappel Ave, Chicago, IL 60617
$399
Cash flow
10.2%
Cash-on-Cash Return
8.6%
Cap rate
1.1%
Rent to Value Ratio
Active under contract
$624,900
2
bds
|
3
ba
|
1,600
sqft
|
built
2000
1537 N Clybourn Ave, Chicago, IL 60610
$-911
Cash flow
-7.6%
Cash-on-Cash Return
4.5%
Cap rate
0.8%
Rent to Value Ratio
Active under contract
$459,999
3
bds
|
2
ba
|
1,500
sqft
|
built
1986
924 S May St, Chicago, IL 60607
$-834
Cash flow
-9.5%
Cash-on-Cash Return
4.1%
Cap rate
0.8%
Rent to Value Ratio
Active
$319,000
3
bds
|
2
ba
|
1,404
sqft
|
built
1997
6235 S Knox Ave, Chicago, IL 60629
$-639
Cash flow
-10.5%
Cash-on-Cash Return
3.9%
Cap rate
0.7%
Rent to Value Ratio
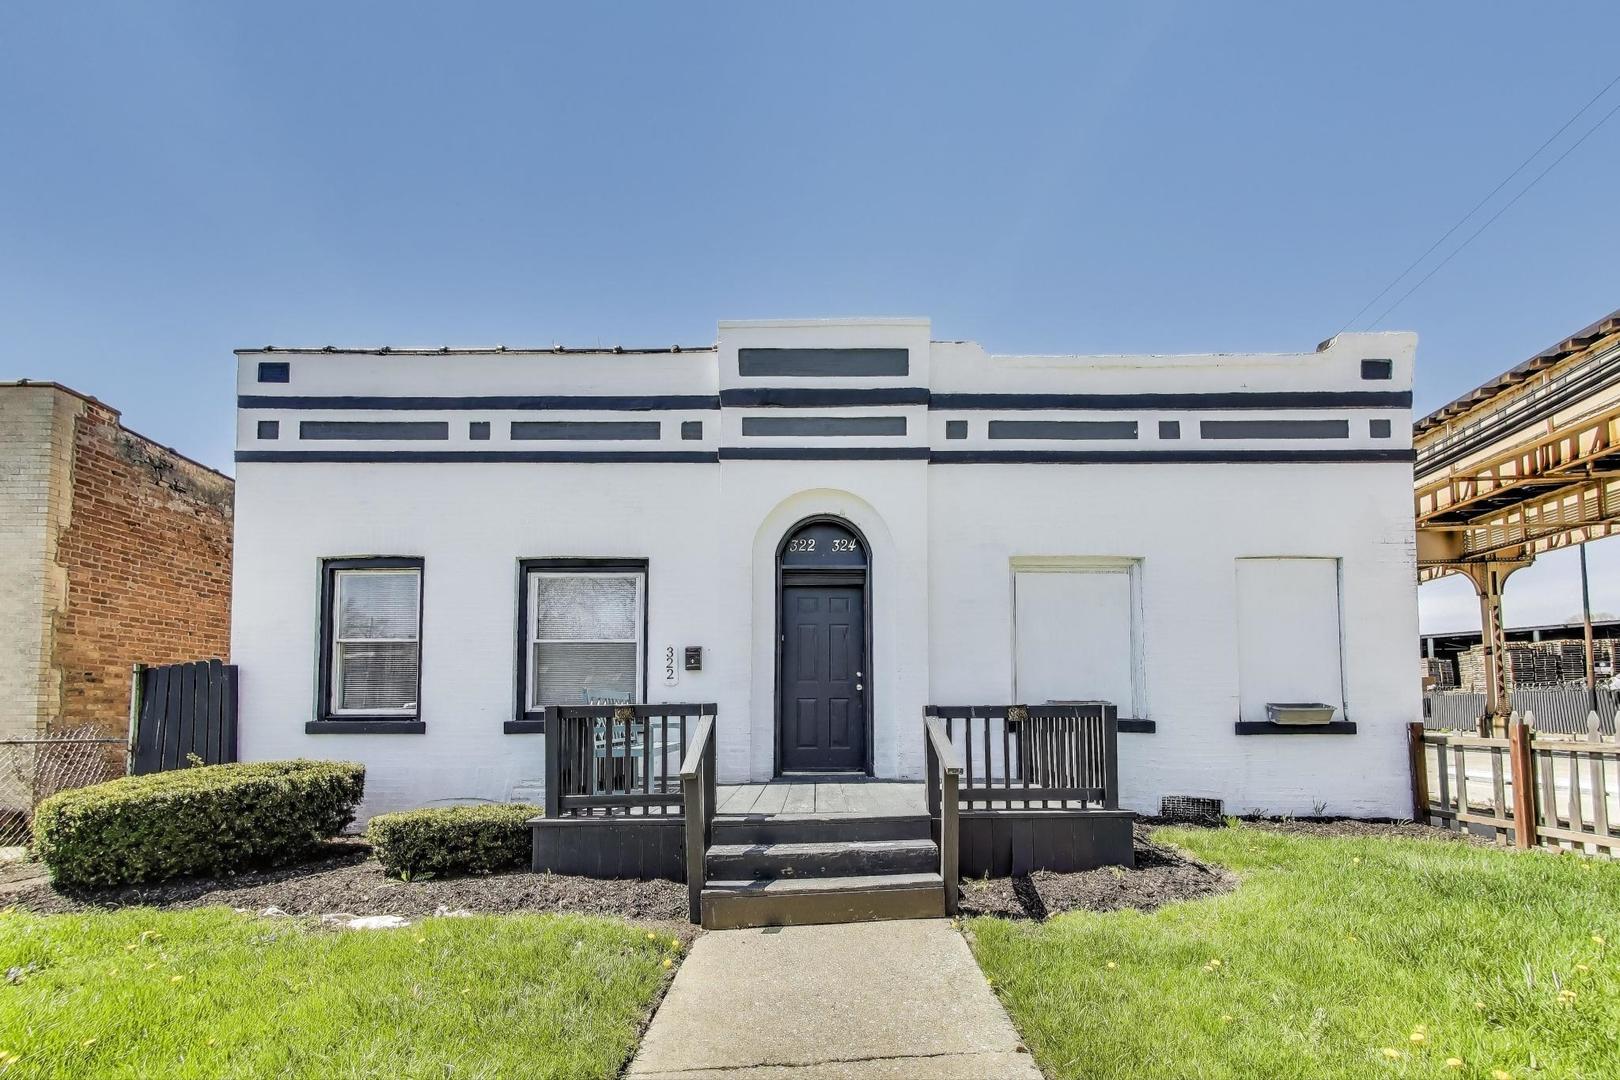
Active
$145,000
3
bds
|
1
ba
|
934
sqft
|
built
1904
322 N Lamon Ave, Chicago, IL 60644
$462
Cash flow
16.6%
Cash-on-Cash Return
10.1%
Cap rate
1.4%
Rent to Value Ratio
Active
$275,000
2
bds
|
4
ba
|
1,636
sqft
|
built
2006
11501 S Vincennes Ave, Chicago, IL 60643
$148
Cash flow
2.8%
Cash-on-Cash Return
6.9%
Cap rate
0.9%
Rent to Value Ratio
Active
$1,095,000
3
bds
|
4
ba
|
2,968
sqft
|
built
1988
55 W Goethe St, Chicago, IL 60610
$-4,639
Cash flow
-22.1%
Cash-on-Cash Return
1.2%
Cap rate
0.6%
Rent to Value Ratio
Active
$899,900
4
bds
|
4
ba
|
2,490
sqft
|
built
2014
2823 N Oakley Ave, Chicago, IL 60618
$-2,593
Cash flow
-15.0%
Cash-on-Cash Return
2.8%
Cap rate
0.6%
Rent to Value Ratio
Active
$134,900
3
bds
|
2
ba
|
731
sqft
|
built
1966
11540 S Racine Ave, Chicago, IL 60643
$467
Cash flow
18.1%
Cash-on-Cash Return
10.4%
Cap rate
1.3%
Rent to Value Ratio
Active
$245,000
3
bds
|
2
ba
|
1,200
sqft
|
built
1963
5228 W 54th St, Chicago, IL 60638
$-127
Cash flow
-2.7%
Cash-on-Cash Return
5.7%
Cap rate
0.8%
Rent to Value Ratio
Active
$499,000
3
bds
|
3
ba
|
2,187
sqft
|
built
2008
308 E 25th Pl, Chicago, IL 60616
$-1,111
Cash flow
-11.6%
Cash-on-Cash Return
3.6%
Cap rate
0.7%
Rent to Value Ratio
Active
$649,000
2
bds
|
3
ba
|
2,500
sqft
|
built
2004
26 E 14th Pl, Chicago, IL 60605
$-401
Cash flow
-3.2%
Cash-on-Cash Return
5.5%
Cap rate
1.0%
Rent to Value Ratio
Active under contract
$310,000
3
bds
|
3
ba
|
1,200
sqft
|
built
1964
1713 W Thome Ave, Chicago, IL 60660
$-9
Cash flow
-0.2%
Cash-on-Cash Return
6.2%
Cap rate
0.9%
Rent to Value Ratio
Active
$795,000
3
bds
|
3
ba
|
2,450
sqft
|
built
1999
335 E Cullerton St, Chicago, IL 60616
$-2,526
Cash flow
-16.6%
Cash-on-Cash Return
2.5%
Cap rate
0.6%
Rent to Value Ratio
Active
$625,000
2
bds
|
3
ba
|
2,159
sqft
|
built
1999
1012 S Loomis St, Chicago, IL 60607
$-1,441
Cash flow
-12.0%
Cash-on-Cash Return
3.5%
Cap rate
0.7%
Rent to Value Ratio
Active
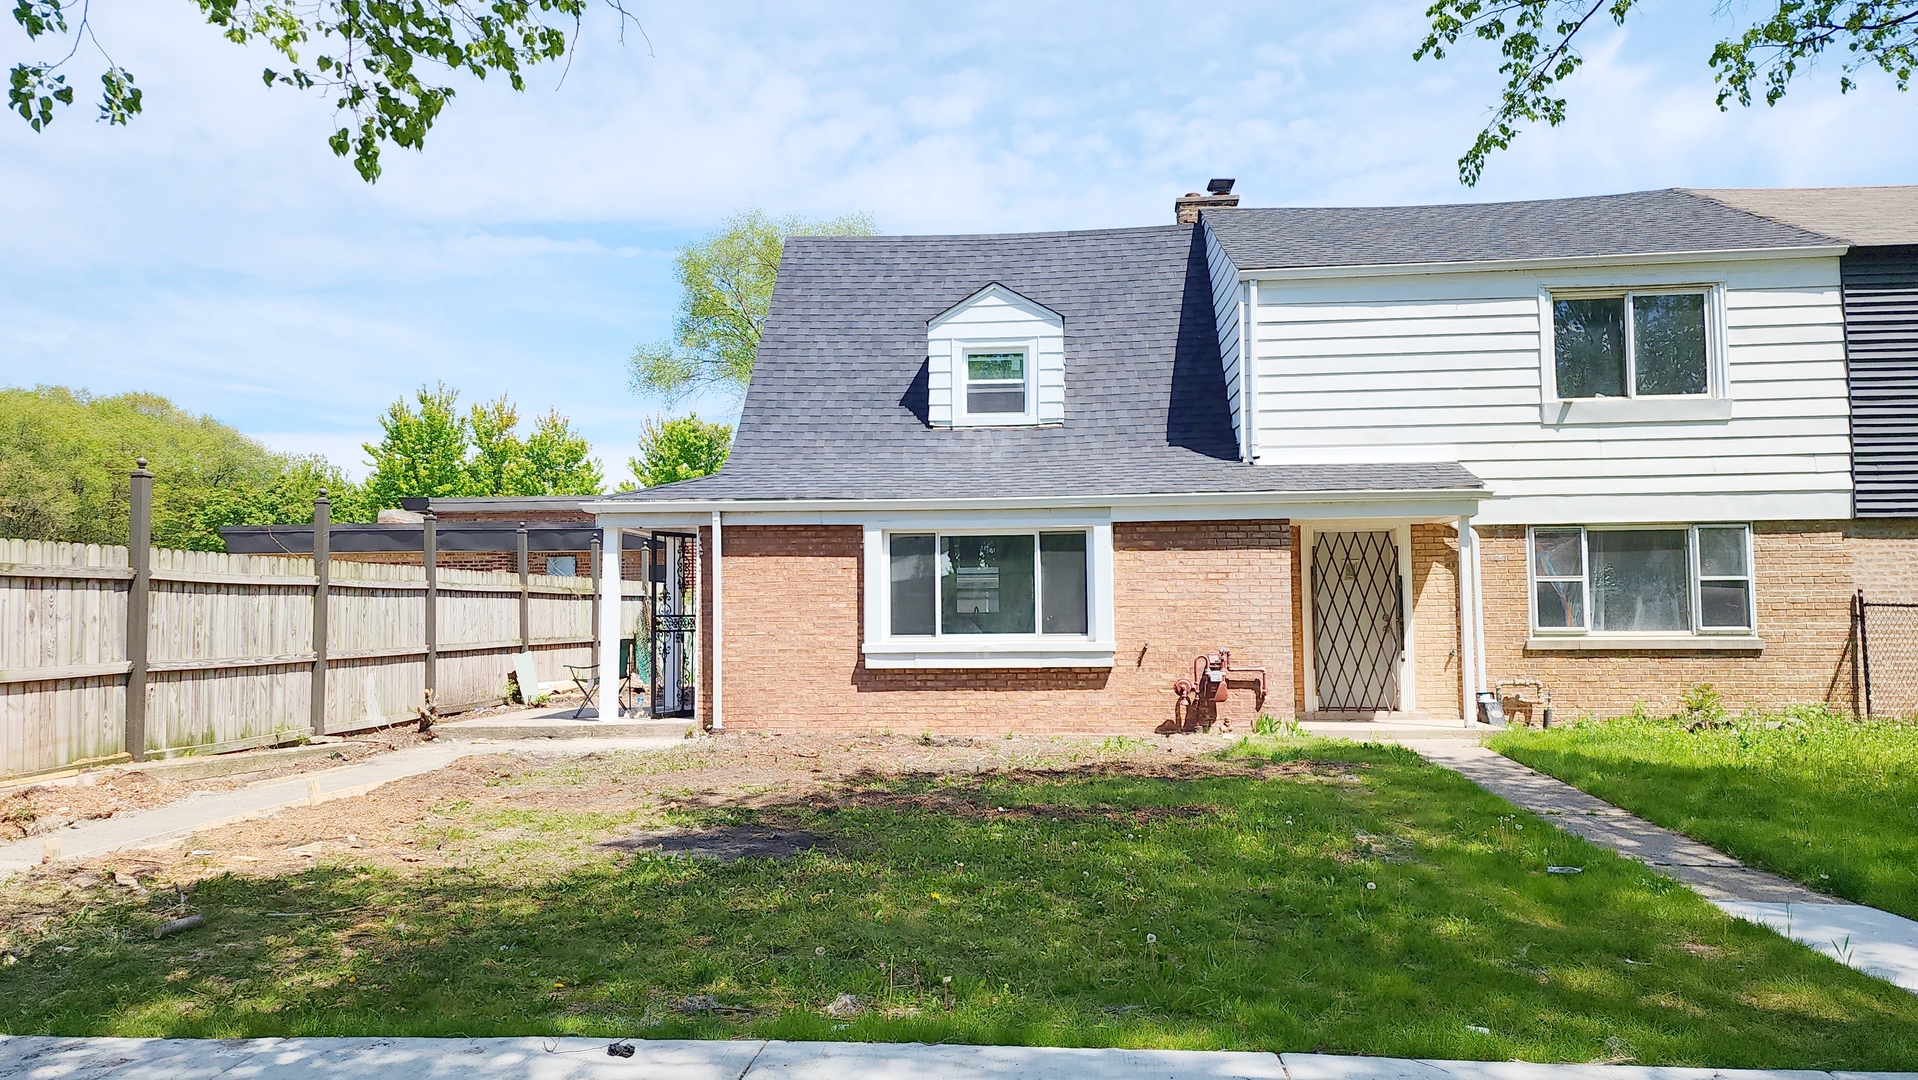
$140,000
3
bds
|
2
ba
|
1,296
sqft
|
built
1954
7843 S Yates Blvd, Chicago, IL 60649
$403
Cash flow
15.0%
Cash-on-Cash Return
9.7%
Cap rate
1.3%
Rent to Value Ratio
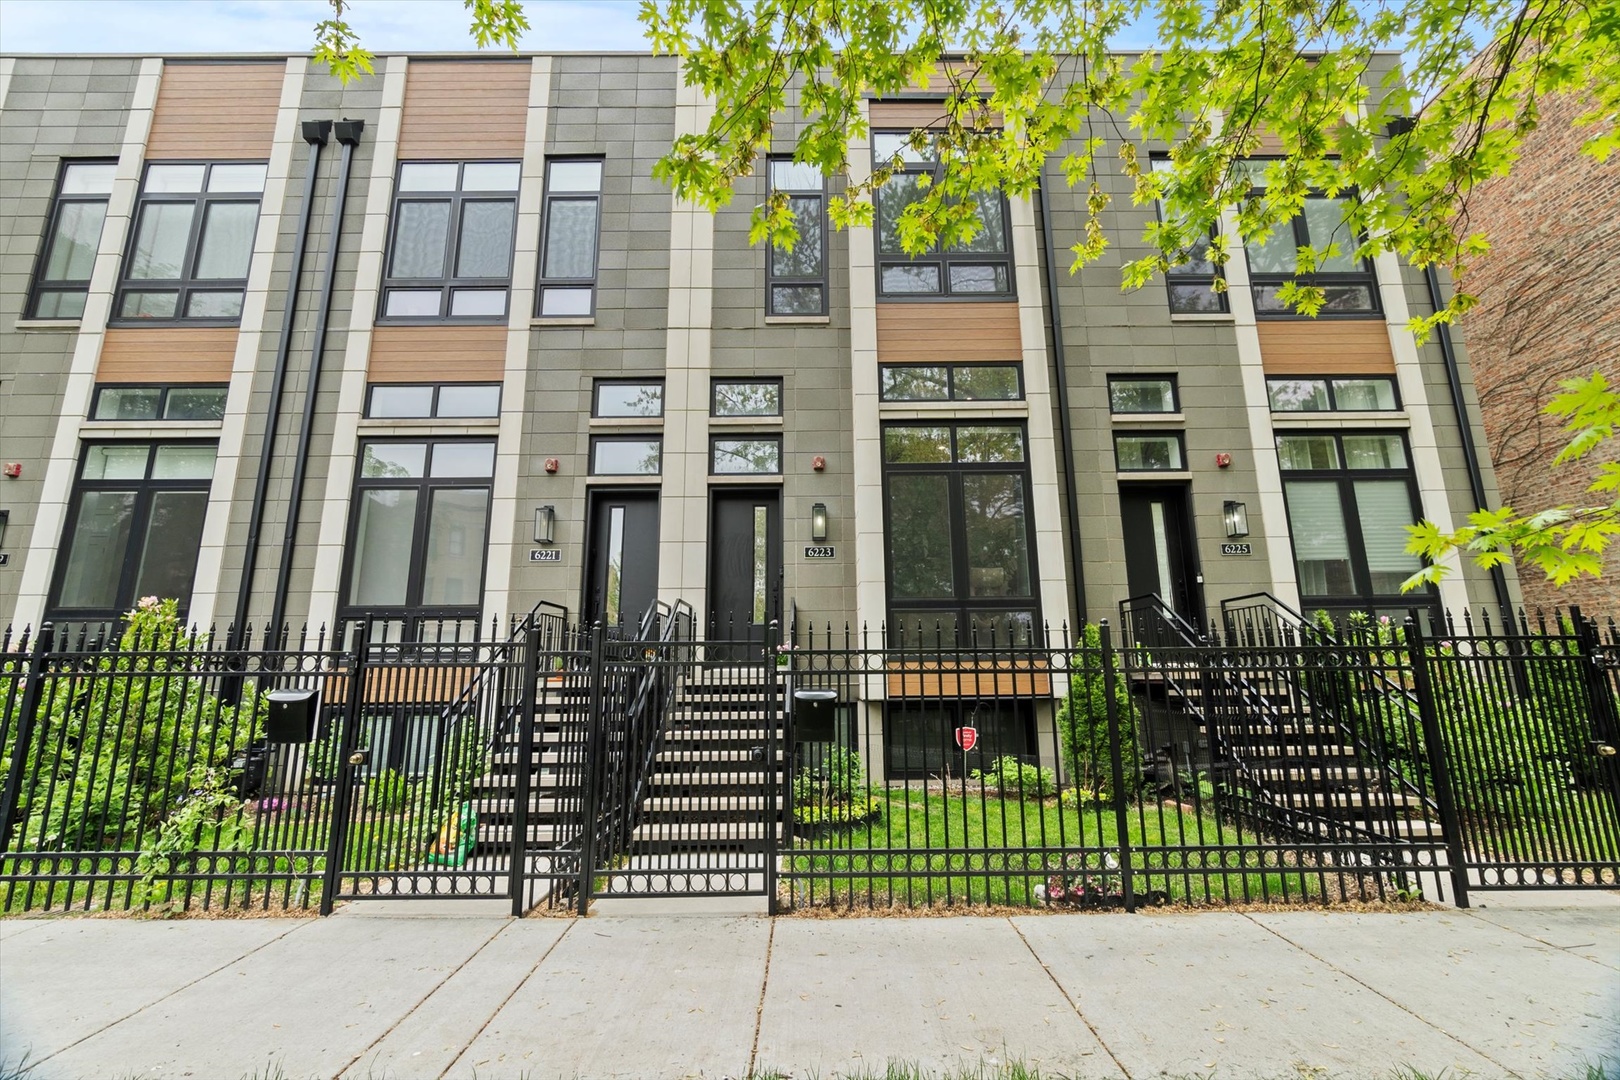
Active
$784,800
3
bds
|
4
ba
|
0
sqft
|
built
2023
6223 S Ellis Ave, Chicago, IL 60637
$-691
Cash flow
-4.6%
Cash-on-Cash Return
5.2%
Cap rate
0.6%
Rent to Value Ratio
Active
$1,475,000
4
bds
|
4
ba
|
3,184
sqft
|
built
1950
1343 N Sutton Pl, Chicago, IL 60610
$-5,566
Cash flow
-19.7%
Cash-on-Cash Return
1.8%
Cap rate
0.5%
Rent to Value Ratio
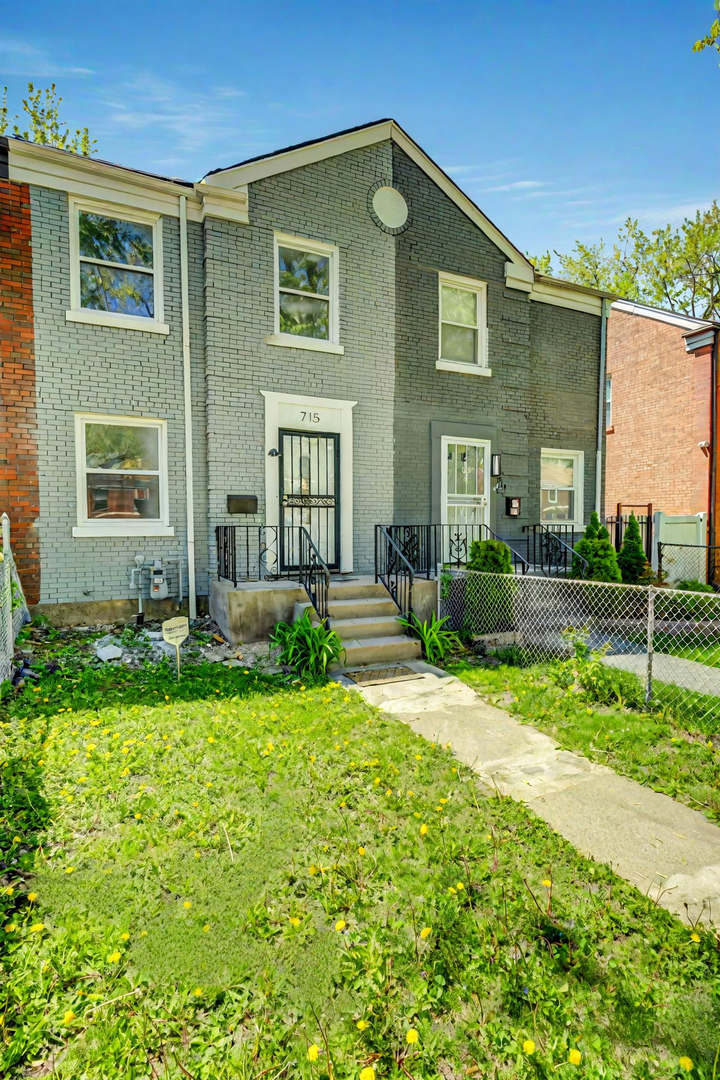
Active
$169,000
2
bds
|
1
ba
|
0
sqft
|
built
1942
715 E 105th Pl, Chicago, IL 60628
$22
Cash flow
0.7%
Cash-on-Cash Return
6.4%
Cap rate
0.8%
Rent to Value Ratio
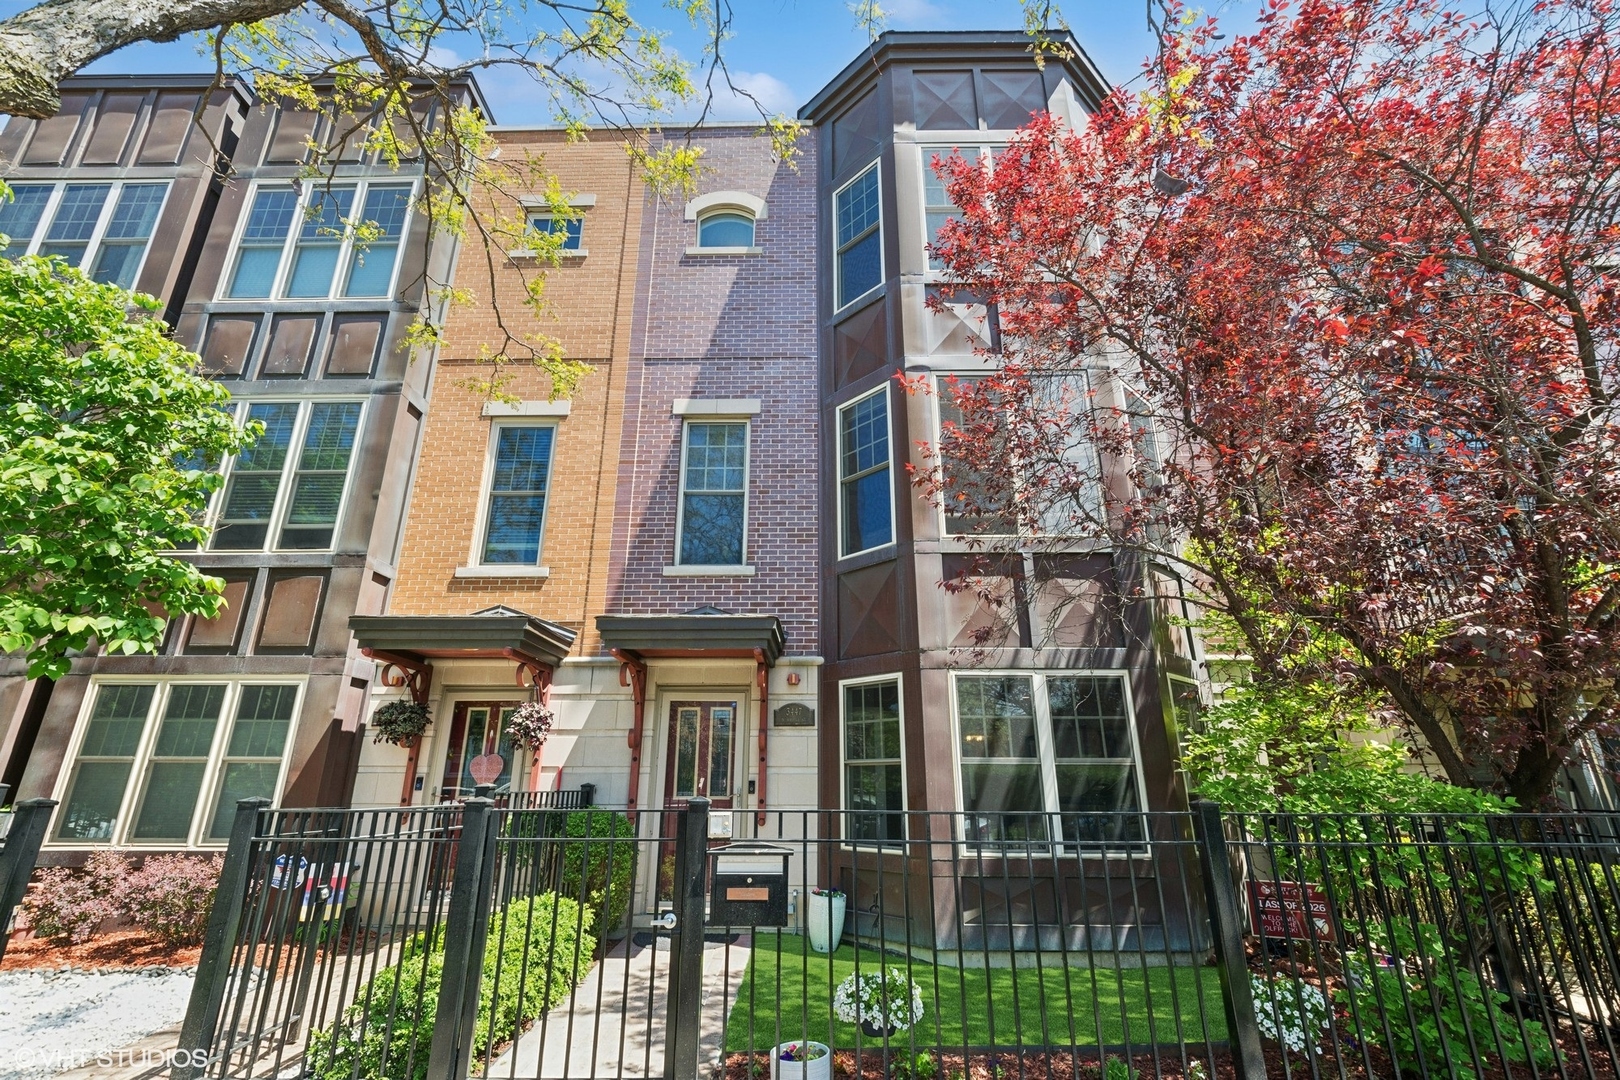
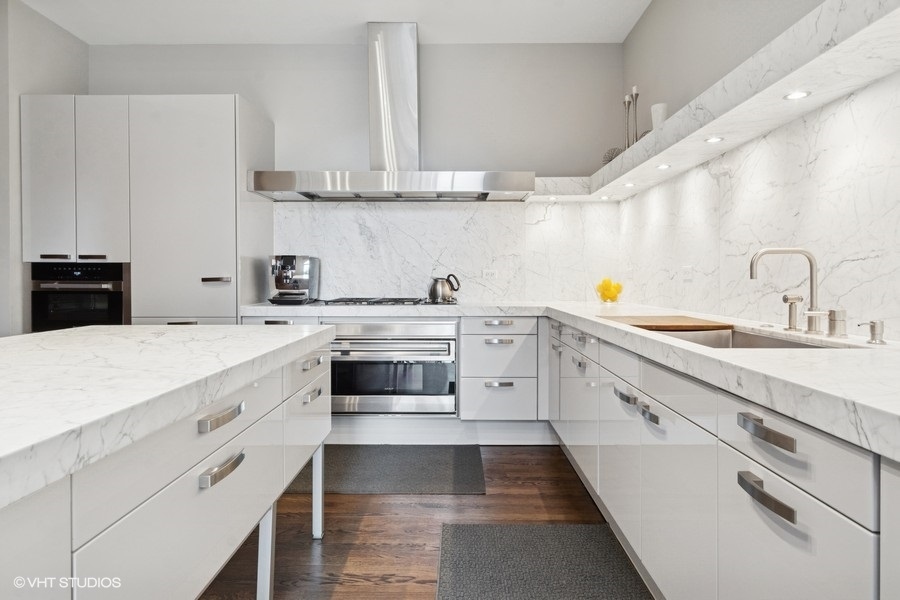
Active
$825,000
4
bds
|
4
ba
|
2,324
sqft
|
built
2007
3447 N Whipple St, Chicago, IL 60618
$-1,815
Cash flow
-11.5%
Cash-on-Cash Return
3.6%
Cap rate
0.7%
Rent to Value Ratio
Active
$1,550,000
3
bds
|
5
ba
|
3,797
sqft
|
built
2003
1733 S Prairie Ave, Chicago, IL 60616
$-6,041
Cash flow
-20.3%
Cash-on-Cash Return
1.6%
Cap rate
0.4%
Rent to Value Ratio
Active under contract
$995,000
3
bds
|
3
ba
|
2,300
sqft
|
built
2000
499 N Canal St, Chicago, IL 60654
$-3,263
Cash flow
-17.1%
Cash-on-Cash Return
2.3%
Cap rate
0.6%
Rent to Value Ratio
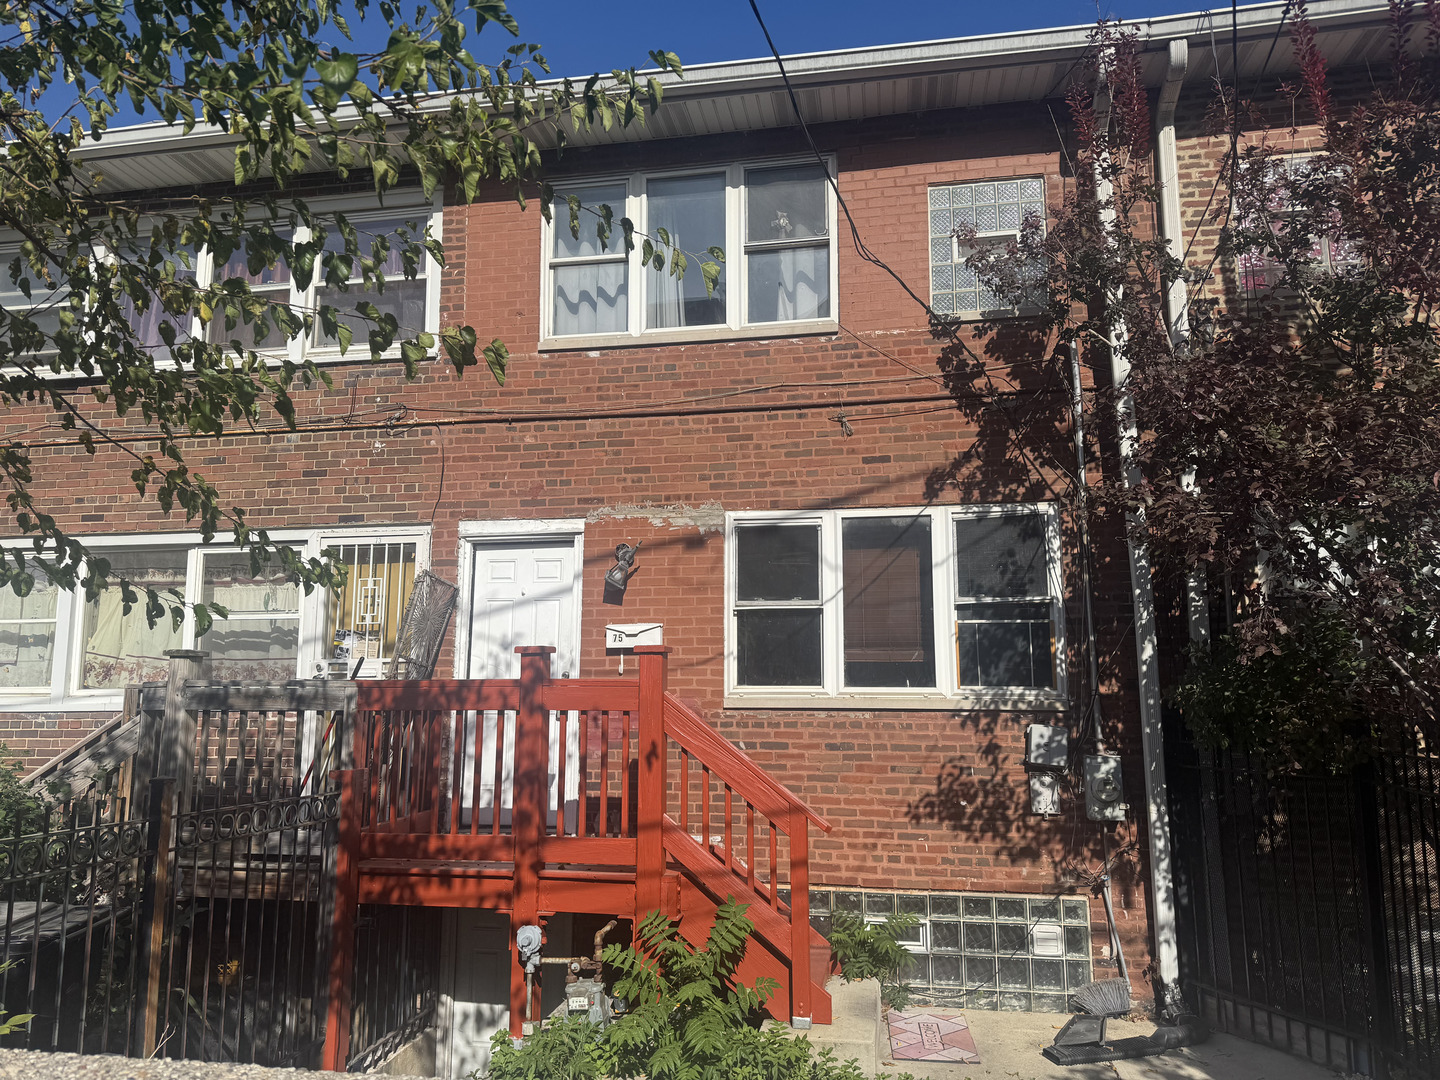
Active
$150,000
2
bds
|
1
ba
|
960
sqft
|
built
1944
75 E 37th Pl, Chicago, IL 60653
$105
Cash flow
3.7%
Cash-on-Cash Return
7.1%
Cap rate
1.1%
Rent to Value Ratio
Active
$189,000
2
bds
|
1
ba
|
952
sqft
|
built
1949
9509 S Merrion Ave, Chicago, IL 60617
$127
Cash flow
3.5%
Cash-on-Cash Return
7.1%
Cap rate
0.9%
Rent to Value Ratio
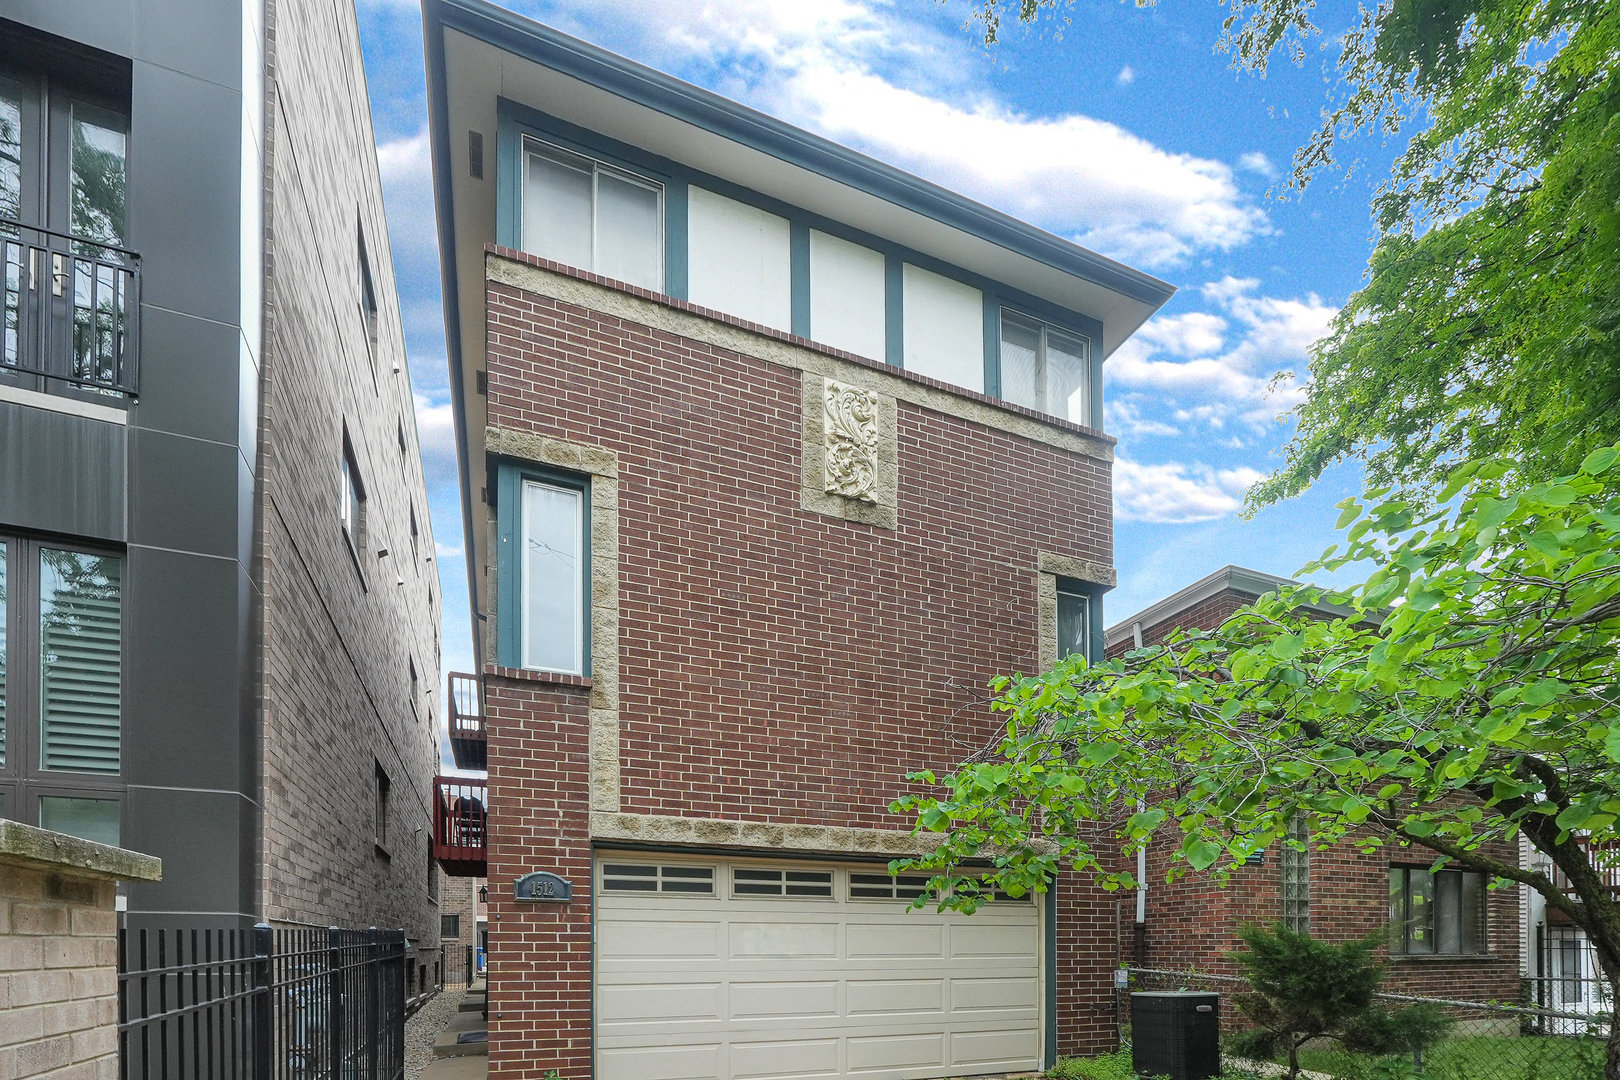
Active
$475,000
2
bds
|
3
ba
|
1,600
sqft
|
built
1993
1512 W Diversey Pkwy, Chicago, IL 60614
$-1,077
Cash flow
-11.8%
Cash-on-Cash Return
3.6%
Cap rate
0.7%
Rent to Value Ratio
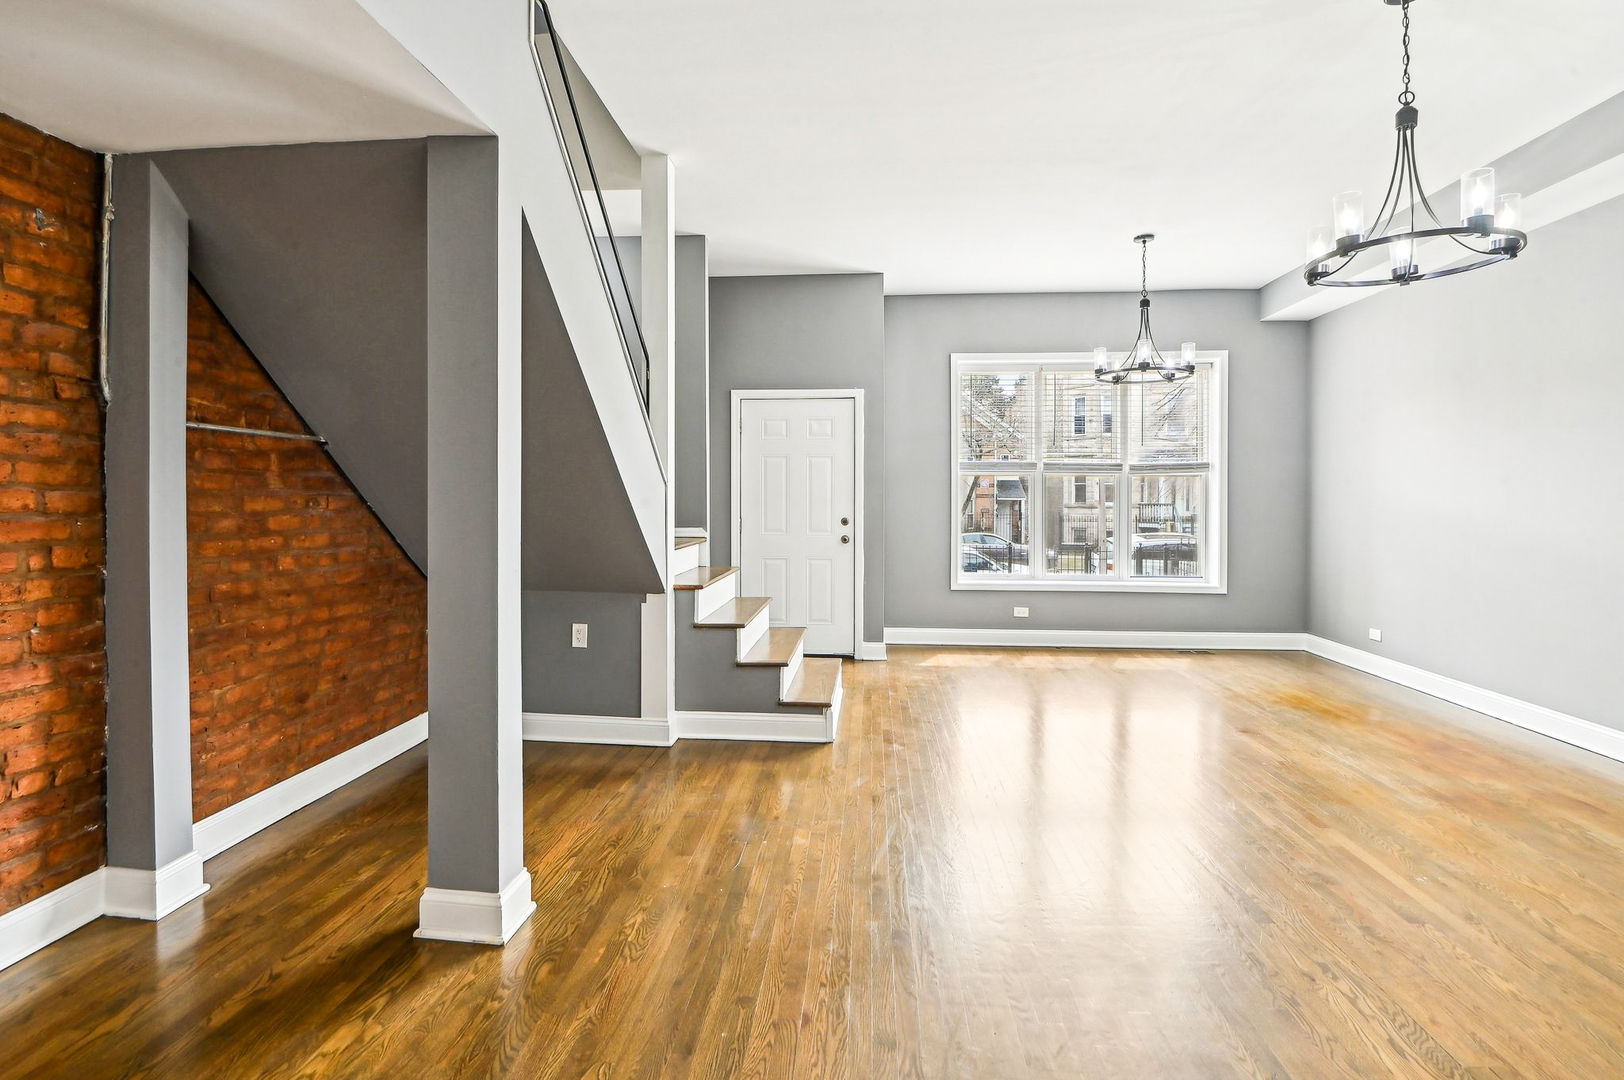
Active
$419,900
3
bds
|
2
ba
|
1,633
sqft
|
built
1890
3348 W Le Moyne St, Chicago, IL 60651
$-1,577
Cash flow
-19.6%
Cash-on-Cash Return
1.8%
Cap rate
0.5%
Rent to Value Ratio
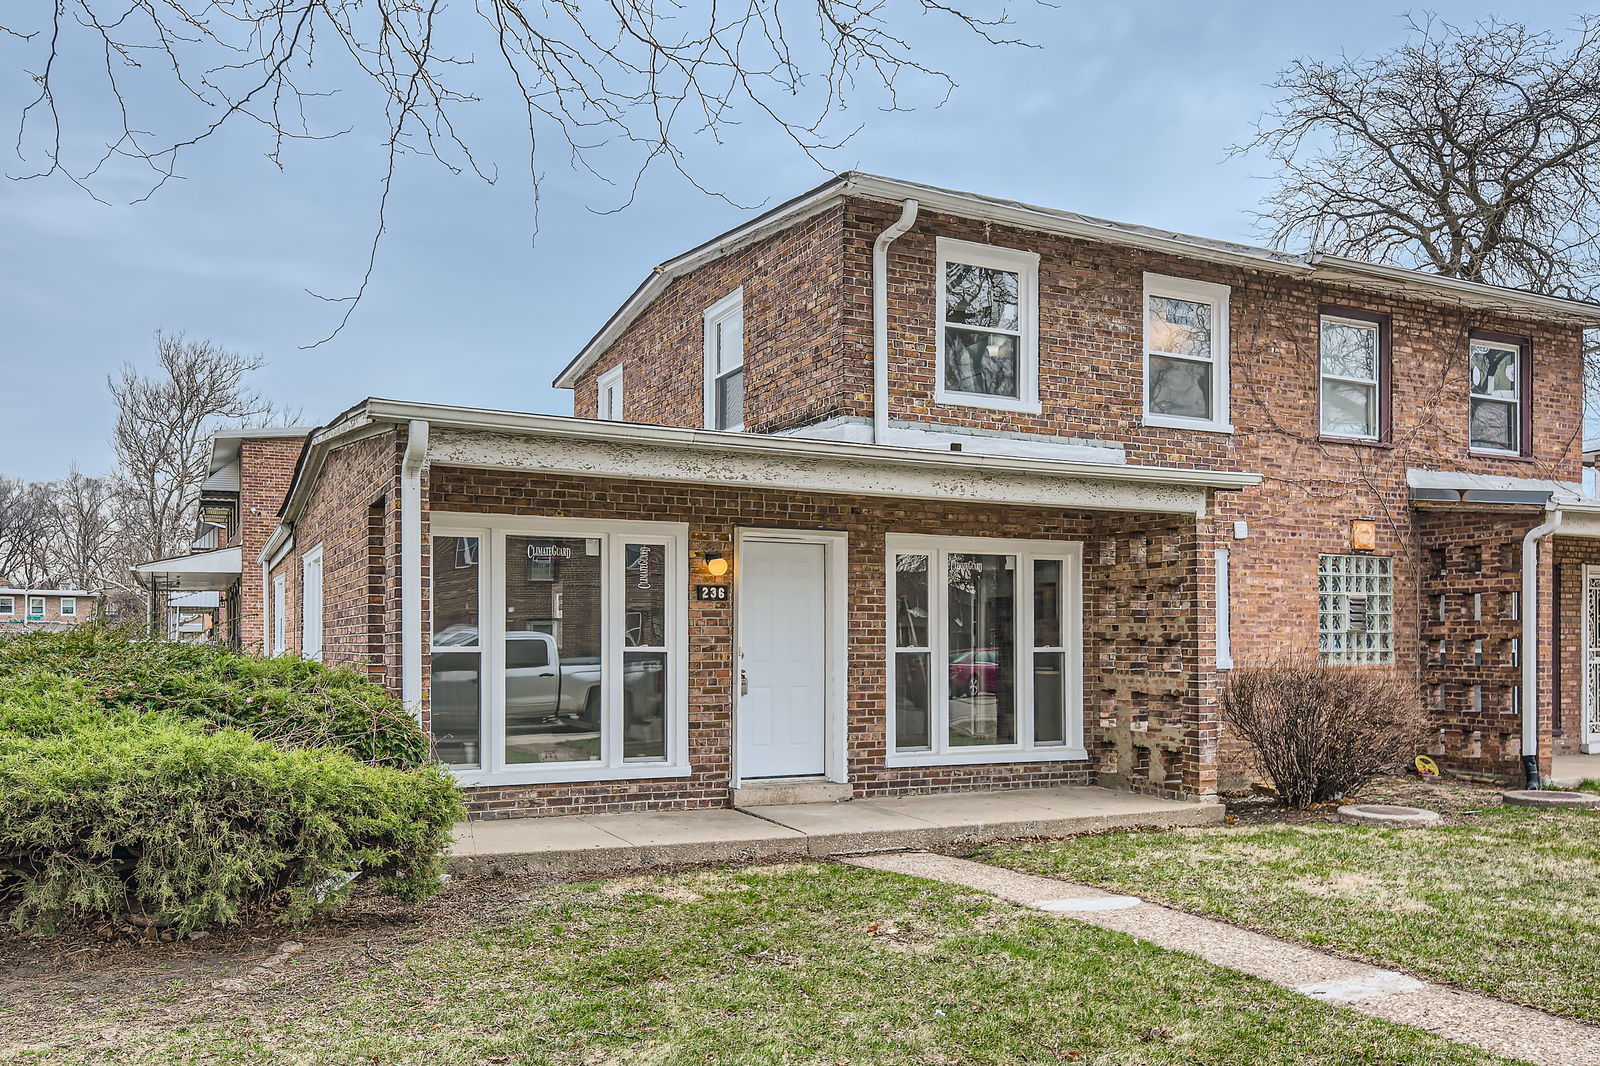
Active
$189,995
3
bds
|
1
ba
|
1,250
sqft
|
built
1942
236 E 92nd St, Chicago, IL 60619
$320
Cash flow
8.8%
Cash-on-Cash Return
8.3%
Cap rate
1.1%
Rent to Value Ratio