Chicago, IL Investment Properties for Sale
Browse homes for sale and investment properties in Chicago, IL. Refine your search by price, property type, or more.
Best cash flowing properties in Chicago, IL
Active
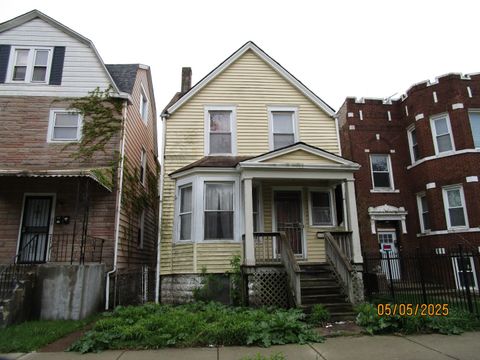
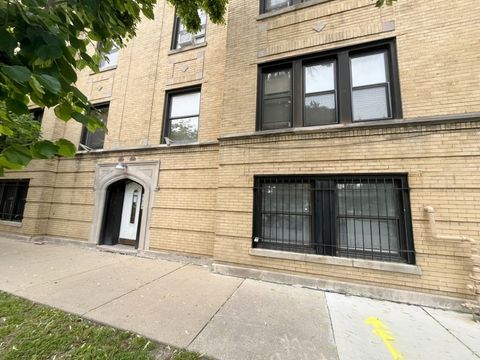
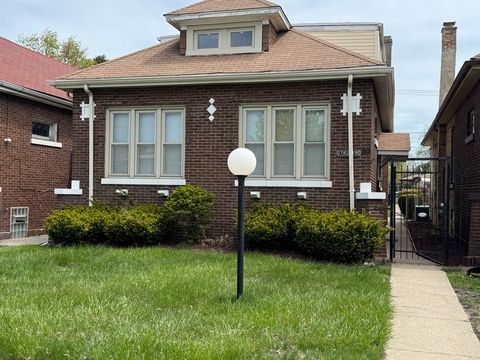
$84,000
3
bds
|
2
ba
|
1,250
sqft
|
built
1905
605 E 92nd Pl, Chicago, IL 60619
$832
Cash flow
51.7%
Cash-on-Cash Return
18.2%
Cap rate
2.4%
Rent to Value Ratio

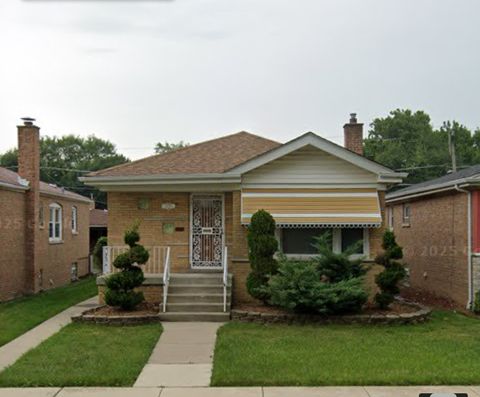
Active
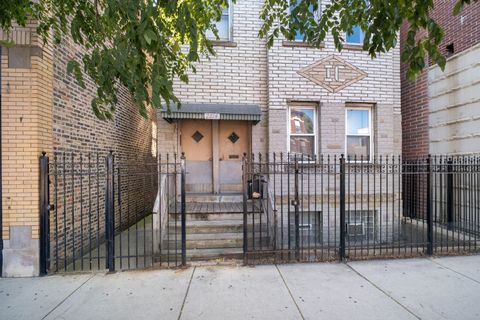
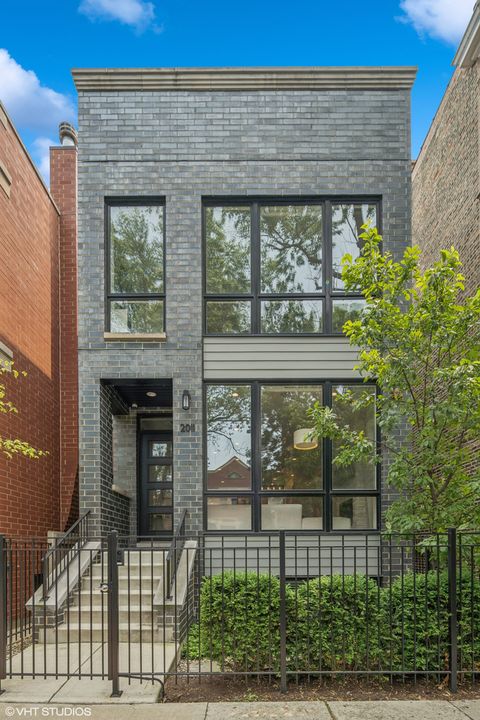
$211,999
3
bds
|
2
ba
|
1,300
sqft
|
built
1964
11642 S Loomis St, Chicago, IL 60643
$380
Cash flow
9.4%
Cash-on-Cash Return
7.8%
Cap rate
1.0%
Rent to Value Ratio
3,995 out of 4,640 properties for sale in Chicago, IL
Limited Results Shown
Create a free account, or log in to reveal all property listings and enjoy the complete experience.
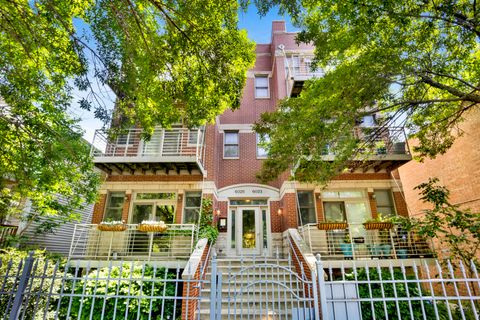
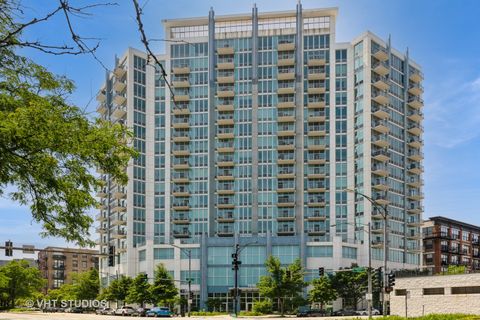
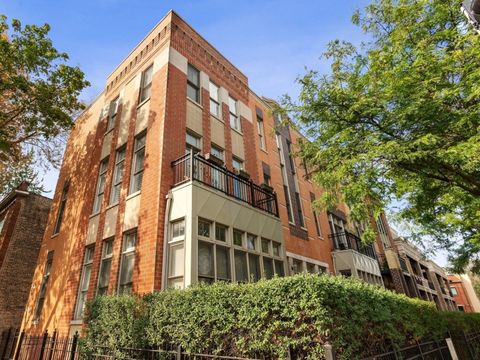
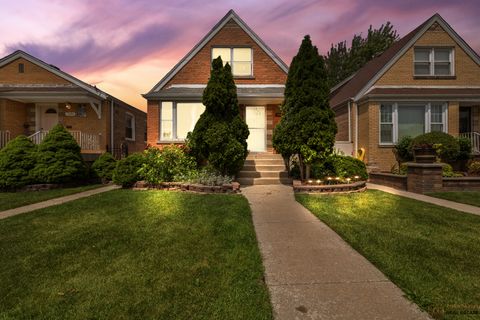
Active
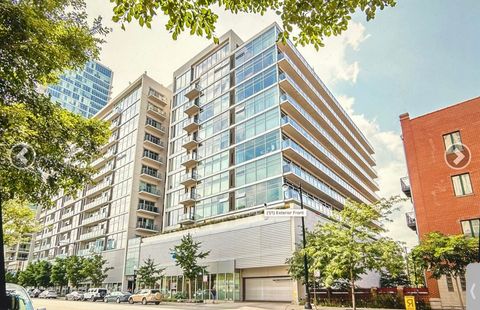
$599,000
3
bds
|
3
ba
|
0
sqft
|
built
2004
6025 N Ridge Ave, Chicago, IL 60660
$-1,631
Cash flow
-14.2%
Cash-on-Cash Return
3.0%
Cap rate
0.5%
Rent to Value Ratio
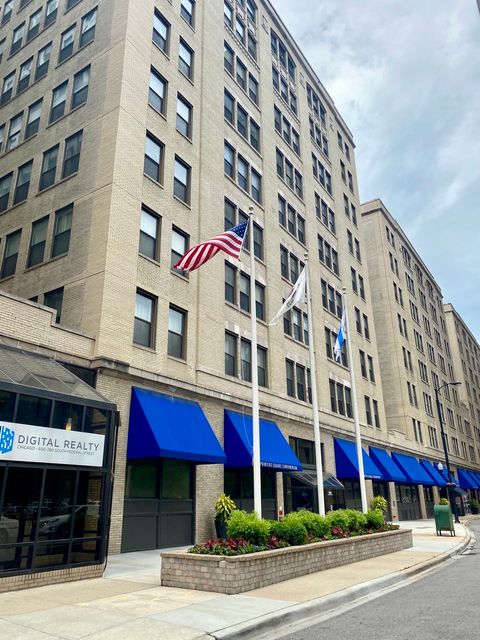
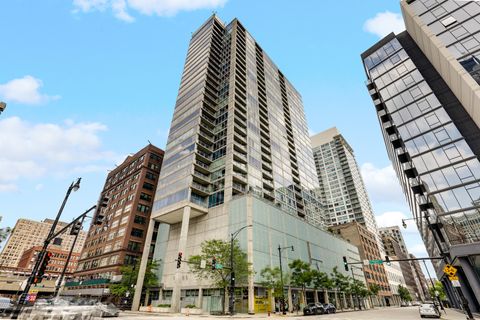
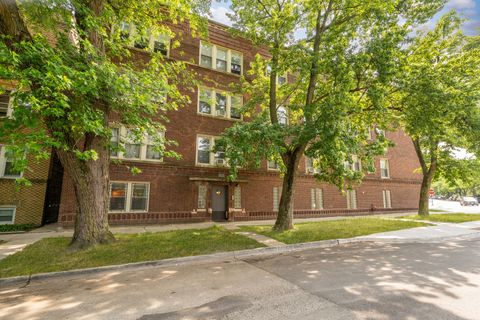
Active
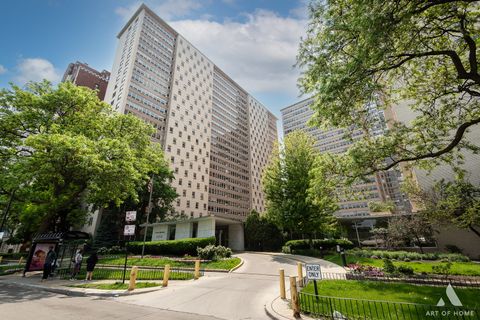
$122,500
bds
|
1
ba
|
594
sqft
|
built
1913
640 S Federal St, Chicago, IL 60605
$-41
Cash flow
-1.7%
Cash-on-Cash Return
5.9%
Cap rate
1.5%
Rent to Value Ratio
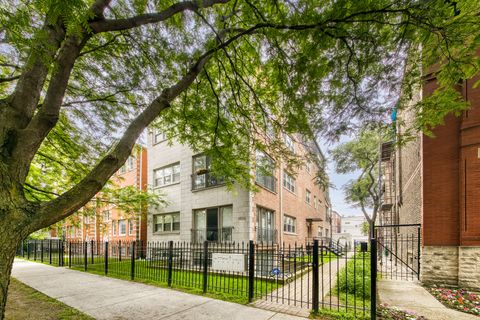
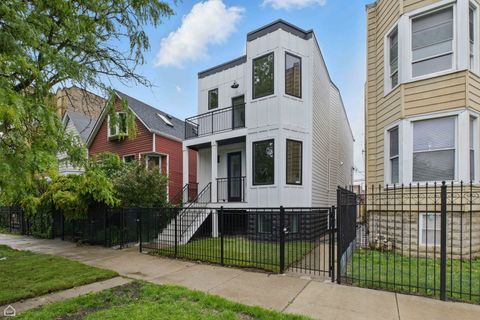
Active
$635,000
3
bds
|
3
ba
|
0
sqft
|
built
2001
1540 N Claremont Ave, Chicago, IL 60622
$-1,949
Cash flow
-16.0%
Cash-on-Cash Return
2.6%
Cap rate
0.5%
Rent to Value Ratio
Active
$385,000
2
bds
|
2
ba
|
1,183
sqft
|
built
2006
1600 S Indiana Ave, Chicago, IL 60616
$-1,277
Cash flow
-17.3%
Cash-on-Cash Return
2.3%
Cap rate
0.8%
Rent to Value Ratio
Active
$290,000
2
bds
|
2
ba
|
1,038
sqft
|
built
1956
2115 W 82nd Pl, Chicago, IL 60620
$-347
Cash flow
-6.2%
Cash-on-Cash Return
4.8%
Cap rate
0.7%
Rent to Value Ratio
Active
$364,900
1
bds
|
2
ba
|
1,002
sqft
|
built
2007
611 S Wells St, Chicago, IL 60607
$-1,249
Cash flow
-17.9%
Cash-on-Cash Return
2.2%
Cap rate
0.8%
Rent to Value Ratio
Active
$1,249,000
5
bds
|
4
ba
|
0
sqft
|
built
1908
3572 W Medill Ave, Chicago, IL 60647
$-5,231
Cash flow
-21.9%
Cash-on-Cash Return
1.2%
Cap rate
0.3%
Rent to Value Ratio
Active
$650,000
2
bds
|
3
ba
|
1,600
sqft
|
built
2001
1501 W Diversey Pkwy, Chicago, IL 60614
$-1,529
Cash flow
-12.3%
Cash-on-Cash Return
3.4%
Cap rate
0.6%
Rent to Value Ratio
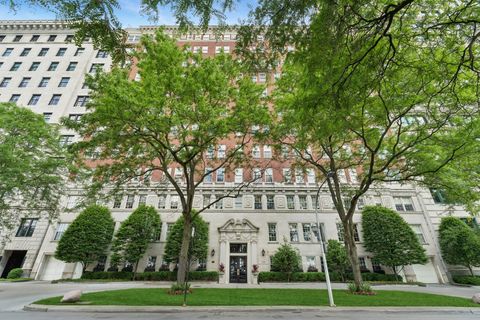
Active
$1,525,000
3
bds
|
3
ba
|
2,200
sqft
|
built
1922
219 E Lake Shore Dr, Chicago, IL 60611
$-8,944
Cash flow
-30.6%
Cash-on-Cash Return
-0.8%
Cap rate
0.4%
Rent to Value Ratio
Active
$299,900
2
bds
|
1
ba
|
1,100
sqft
|
built
1972
1339 N Dearborn St, Chicago, IL 60610
$-1,030
Cash flow
-17.9%
Cash-on-Cash Return
2.1%
Cap rate
0.9%
Rent to Value Ratio
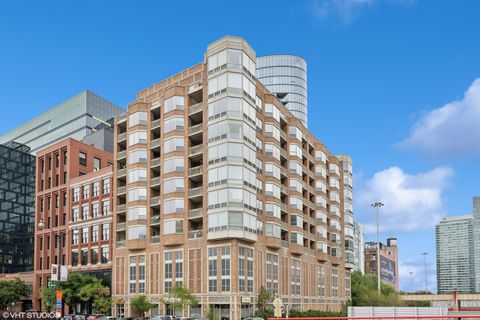
Active
$565,000
2
bds
|
2
ba
|
1,500
sqft
|
built
2003
720 W Randolph St, Chicago, IL 60661
$-2,769
Cash flow
-25.6%
Cash-on-Cash Return
0.4%
Cap rate
0.4%
Rent to Value Ratio
Active
$140,000
1
bds
|
1
ba
|
0
sqft
|
built
1928
3604 W Dickens Ave, Chicago, IL 60647
$-99
Cash flow
-3.7%
Cash-on-Cash Return
5.4%
Cap rate
1.0%
Rent to Value Ratio

Active
$145,000
1
bds
|
1
ba
|
700
sqft
|
built
1950
6833 N Oakley Ave, Chicago, IL 60645
$-181
Cash flow
-6.5%
Cash-on-Cash Return
4.2%
Cap rate
1.0%
Rent to Value Ratio
Active
$659,000
5
bds
|
3
ba
|
0
sqft
|
built
1887
2014 N Western Ave, Chicago, IL 60647
$-1,750
Cash flow
-13.9%
Cash-on-Cash Return
2.5%
Cap rate
0.5%
Rent to Value Ratio

Active
$1,685,000
3
bds
|
4
ba
|
2,130
sqft
|
built
2017
540 W Webster Ave, Chicago, IL 60614
$-7,447
Cash flow
-23.1%
Cash-on-Cash Return
0.4%
Cap rate
0.4%
Rent to Value Ratio
Active
$299,999
2
bds
|
1
ba
|
980
sqft
|
built
2006
1620 S Michigan Ave, Chicago, IL 60616
$-375
Cash flow
-6.5%
Cash-on-Cash Return
4.2%
Cap rate
0.8%
Rent to Value Ratio
Active
$184,900
2
bds
|
1
ba
|
0
sqft
|
built
1955
3950 N Lake Shore Dr, Chicago, IL 60613
$-337
Cash flow
-9.5%
Cash-on-Cash Return
4.1%
Cap rate
1.2%
Rent to Value Ratio
Active
$249,900
4
bds
|
2
ba
|
2,220
sqft
|
built
1924
7649 S Michigan Ave, Chicago, IL 60619
$-85
Cash flow
-1.8%
Cash-on-Cash Return
5.9%
Cap rate
0.8%
Rent to Value Ratio
Active
$1,998,000
4
bds
|
5
ba
|
4,000
sqft
|
built
2017
2011 N Oakley Ave, Chicago, IL 60647
$-9,207
Cash flow
-24.0%
Cash-on-Cash Return
0.7%
Cap rate
0.3%
Rent to Value Ratio
Active
$335,000
4
bds
|
2
ba
|
3,190
sqft
|
built
1953
7220 S Spaulding Ave, Chicago, IL 60629
$-629
Cash flow
-9.8%
Cash-on-Cash Return
4.0%
Cap rate
0.6%
Rent to Value Ratio
Active
$160,000
2
bds
|
1
ba
|
0
sqft
|
built
1920
1941 W Chase Ave, Chicago, IL 60626
$-136
Cash flow
-4.4%
Cash-on-Cash Return
5.2%
Cap rate
1.0%
Rent to Value Ratio
Active
$529,900
2
bds
|
2
ba
|
1,350
sqft
|
built
1969
2800 N Lake Shore Dr, Chicago, IL 60657
$-1,899
Cash flow
-18.7%
Cash-on-Cash Return
2.0%
Cap rate
0.7%
Rent to Value Ratio
Active
$359,000
1
bds
|
2
ba
|
0
sqft
|
built
2004
210 S Desplaines St, Chicago, IL 60661
$-1,241
Cash flow
-18.0%
Cash-on-Cash Return
2.1%
Cap rate
0.7%
Rent to Value Ratio
Active
$290,000
1
bds
|
1
ba
|
860
sqft
|
built
1949
130 S Canal St, Chicago, IL 60606
$-894
Cash flow
-16.1%
Cash-on-Cash Return
2.6%
Cap rate
0.9%
Rent to Value Ratio
Active
$520,000
2
bds
|
2
ba
|
1,750
sqft
|
built
1968
3470 N Lake Shore Dr, Chicago, IL 60657
$-2,261
Cash flow
-22.7%
Cash-on-Cash Return
1.0%
Cap rate
0.8%
Rent to Value Ratio
Active
$485,000
2
bds
|
2
ba
|
1,034
sqft
|
built
2003
400 N La Salle Dr, Chicago, IL 60654
$-1,364
Cash flow
-14.7%
Cash-on-Cash Return
2.9%
Cap rate
0.8%
Rent to Value Ratio
Active
$345,000
2
bds
|
2
ba
|
1,143
sqft
|
built
1909
2545 S Dearborn St, Chicago, IL 60616
$-870
Cash flow
-13.2%
Cash-on-Cash Return
3.2%
Cap rate
0.8%
Rent to Value Ratio
Active
$210,000
2
bds
|
2
ba
|
1,350
sqft
|
built
1936
1791 W Howard St, Chicago, IL 60626
$-688
Cash flow
-17.1%
Cash-on-Cash Return
2.3%
Cap rate
0.9%
Rent to Value Ratio
Active
$84,000
3
bds
|
2
ba
|
1,250
sqft
|
built
1905
605 E 92nd Pl, Chicago, IL 60619
$832
Cash flow
51.7%
Cash-on-Cash Return
18.2%
Cap rate
2.4%
Rent to Value Ratio
Active
$1,999,000
4
bds
|
4
ba
|
4,200
sqft
|
built
1916
3834 N Lakewood Ave, Chicago, IL 60613
$-6,429
Cash flow
-16.8%
Cash-on-Cash Return
2.4%
Cap rate
0.4%
Rent to Value Ratio
Active
$275,000
1
bds
|
1
ba
|
900
sqft
|
built
1914
5656 S Dorchester Ave, Chicago, IL 60637
$-620
Cash flow
-11.8%
Cash-on-Cash Return
3.6%
Cap rate
0.7%
Rent to Value Ratio

Active
$769,000
12
bds
|
7
ba
|
0
sqft
|
built
1920
1531 S Kolin Ave, Chicago, IL 60623
$-2,718
Cash flow
-18.4%
Cash-on-Cash Return
1.4%
Cap rate
0.3%
Rent to Value Ratio
Active
$211,999
3
bds
|
2
ba
|
1,300
sqft
|
built
1964
11642 S Loomis St, Chicago, IL 60643
$380
Cash flow
9.4%
Cash-on-Cash Return
7.8%
Cap rate
1.0%
Rent to Value Ratio

Active
$2,199,999
6
bds
|
6
ba
|
0
sqft
|
built
1883
1420 W Fulton St, Chicago, IL 60607
$-7,940
Cash flow
-18.8%
Cash-on-Cash Return
1.3%
Cap rate
0.3%
Rent to Value Ratio

Active
$714,500
9
bds
|
3
ba
|
0
sqft
|
built
1924
6030 N Claremont Ave, Chicago, IL 60659
$-2,082
Cash flow
-15.2%
Cash-on-Cash Return
2.2%
Cap rate
0.4%
Rent to Value Ratio

Active
$192,500
1
bds
|
1
ba
|
0
sqft
|
built
1954
2909 N Sheridan Rd, Chicago, IL 60657
$-551
Cash flow
-14.9%
Cash-on-Cash Return
2.2%
Cap rate
0.9%
Rent to Value Ratio

Active
$675,000
6
bds
|
3
ba
|
0
sqft
|
built
1982
3430 S Parnell Ave, Chicago, IL 60616
$-2,669
Cash flow
-20.6%
Cash-on-Cash Return
0.9%
Cap rate
0.3%
Rent to Value Ratio
Active
$240,000
6
bds
|
2
ba
|
0
sqft
|
built
1908
7042 S Carpenter St, Chicago, IL 60621
$-392
Cash flow
-8.5%
Cash-on-Cash Return
4.3%
Cap rate
0.6%
Rent to Value Ratio
Active
$1,495,000
2
bds
|
3
ba
|
2,076
sqft
|
built
2008
401 N Wabash Ave, Chicago, IL 60611
$-6,931
Cash flow
-24.2%
Cash-on-Cash Return
0.7%
Cap rate
0.4%
Rent to Value Ratio
Active
$320,000
2
bds
|
1
ba
|
0
sqft
|
built
1969
5455 N Sheridan Rd, Chicago, IL 60640
$-801
Cash flow
-13.1%
Cash-on-Cash Return
3.3%
Cap rate
0.9%
Rent to Value Ratio