Chicago, IL Investment Properties for Sale
Browse homes for sale and investment properties in Chicago, IL. Refine your search by price, property type, or more.
Best cash flowing properties in Chicago, IL
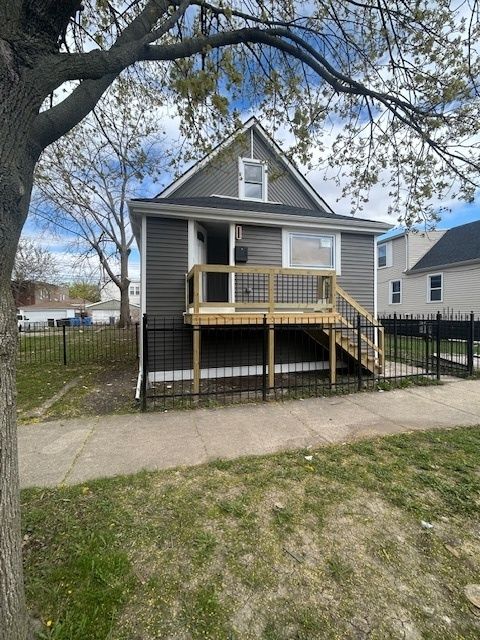
Active
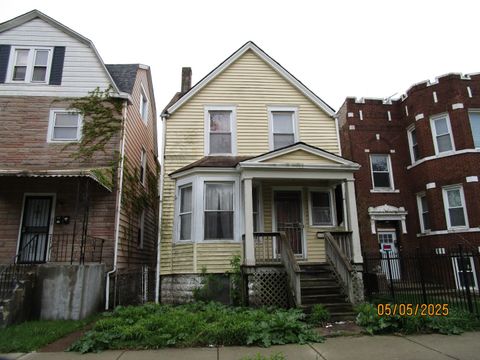
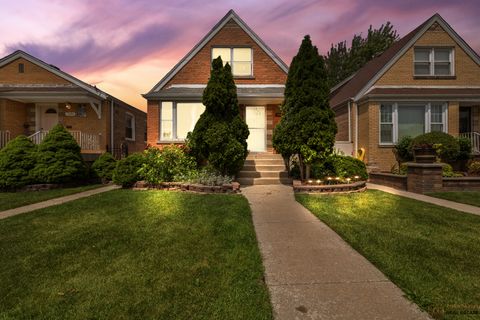
$84,000
3
bds
|
2
ba
|
1,250
sqft
|
built
1905
605 E 92nd Pl, Chicago, IL 60619
$832
Cash flow
51.7%
Cash-on-Cash Return
18.2%
Cap rate
2.4%
Rent to Value Ratio

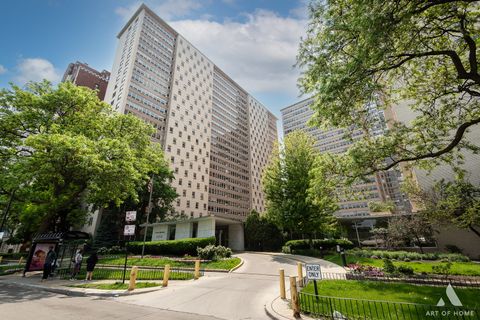
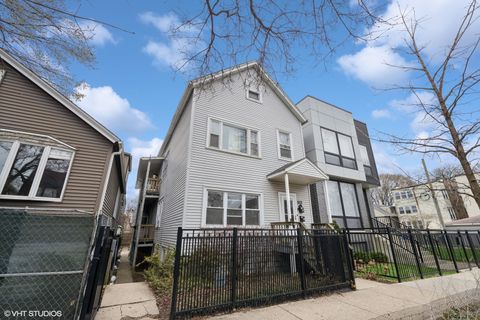
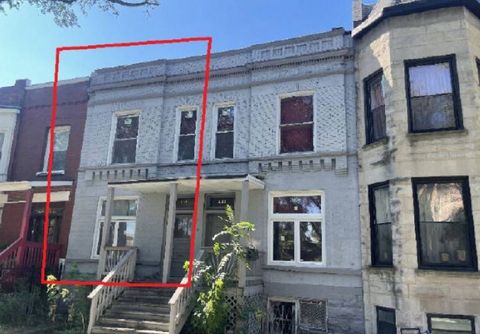
Active
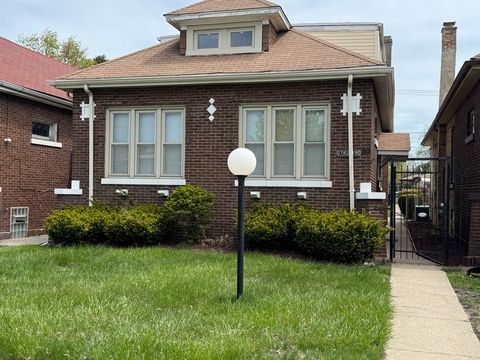
$169,000
5
bds
|
2
ba
|
988
sqft
|
built
1968
5348 S Peoria St, Chicago, IL 60609
$486
Cash flow
15.0%
Cash-on-Cash Return
9.7%
Cap rate
1.2%
Rent to Value Ratio
3,957 out of 4,600 properties for sale in Chicago, IL
Limited Results Shown
Create a free account, or log in to reveal all property listings and enjoy the complete experience.
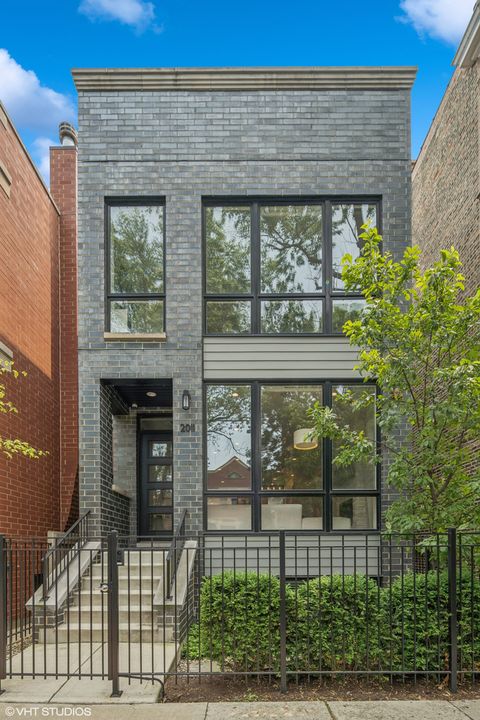
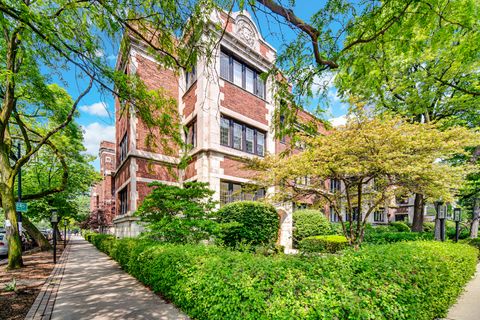
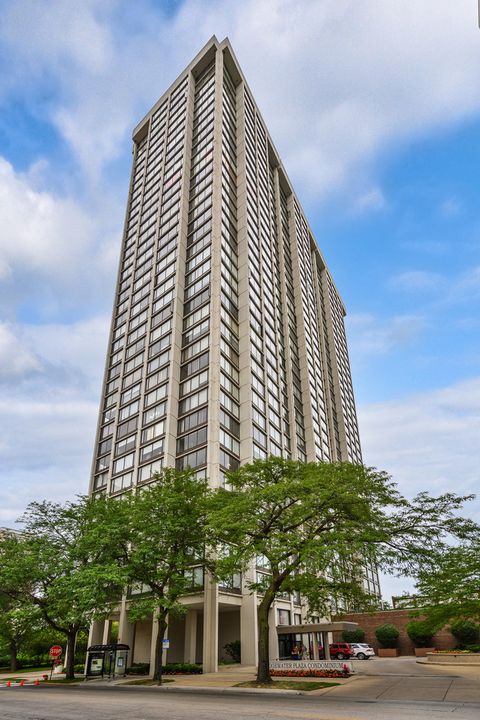
Active
$184,900
2
bds
|
1
ba
|
0
sqft
|
built
1955
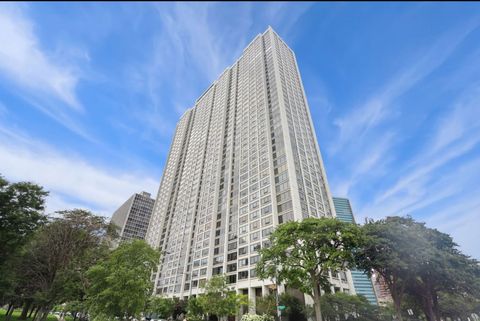
3950 N Lake Shore Dr, Chicago, IL 60613
$-337
Cash flow
-9.5%
Cash-on-Cash Return
4.1%
Cap rate
1.2%
Rent to Value Ratio
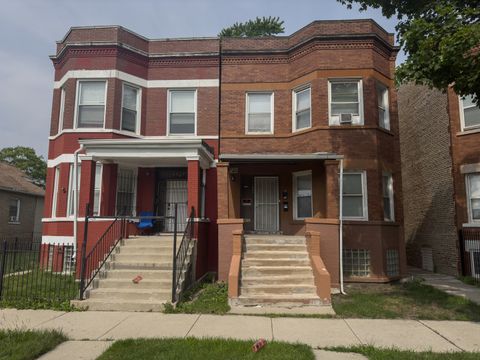
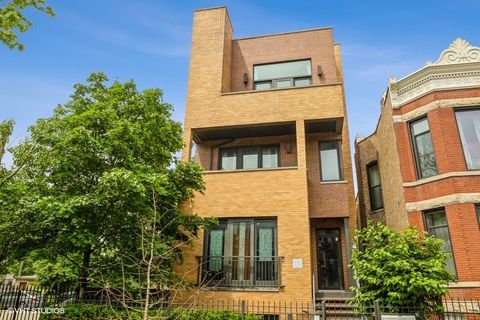
Active
$1,998,000
4
bds
|
5
ba
|
4,000
sqft
|
built
2017
2011 N Oakley Ave, Chicago, IL 60647
$-9,207
Cash flow
-24.0%
Cash-on-Cash Return
0.7%
Cap rate
0.3%
Rent to Value Ratio
Active
$160,000
2
bds
|
1
ba
|
0
sqft
|
built
1920
1941 W Chase Ave, Chicago, IL 60626
$-136
Cash flow
-4.4%
Cash-on-Cash Return
5.2%
Cap rate
1.0%
Rent to Value Ratio
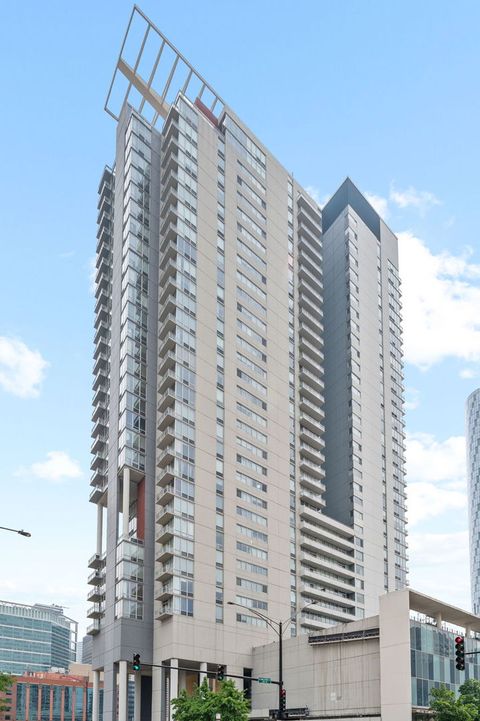
Active
$529,900
2
bds
|
2
ba
|
1,350
sqft
|
built
1969
2800 N Lake Shore Dr, Chicago, IL 60657
$-1,899
Cash flow
-18.7%
Cash-on-Cash Return
2.0%
Cap rate
0.7%
Rent to Value Ratio
Active
$520,000
2
bds
|
2
ba
|
1,750
sqft
|
built
1968
3470 N Lake Shore Dr, Chicago, IL 60657
$-2,261
Cash flow
-22.7%
Cash-on-Cash Return
1.0%
Cap rate
0.8%
Rent to Value Ratio
Active
$485,000
2
bds
|
2
ba
|
1,034
sqft
|
built
2003
400 N La Salle Dr, Chicago, IL 60654
$-1,364
Cash flow
-14.7%
Cash-on-Cash Return
2.9%
Cap rate
0.8%
Rent to Value Ratio
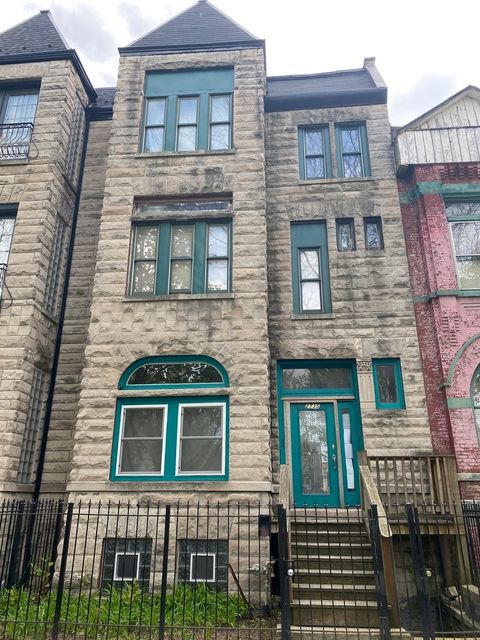
Active
$345,000
2
bds
|
2
ba
|
1,143
sqft
|
built
1909
2545 S Dearborn St, Chicago, IL 60616
$-870
Cash flow
-13.2%
Cash-on-Cash Return
3.2%
Cap rate
0.8%
Rent to Value Ratio
Active
$210,000
2
bds
|
2
ba
|
1,350
sqft
|
built
1936
1791 W Howard St, Chicago, IL 60626
$-688
Cash flow
-17.1%
Cash-on-Cash Return
2.3%
Cap rate
0.9%
Rent to Value Ratio
Active
$84,000
3
bds
|
2
ba
|
1,250
sqft
|
built
1905
605 E 92nd Pl, Chicago, IL 60619
$832
Cash flow
51.7%
Cash-on-Cash Return
18.2%
Cap rate
2.4%
Rent to Value Ratio
Active
$1,999,000
4
bds
|
4
ba
|
4,200
sqft
|
built
1916
3834 N Lakewood Ave, Chicago, IL 60613
$-6,429
Cash flow
-16.8%
Cash-on-Cash Return
2.4%
Cap rate
0.4%
Rent to Value Ratio
Active
$359,000
1
bds
|
2
ba
|
0
sqft
|
built
2004
210 S Desplaines St, Chicago, IL 60661
$-1,241
Cash flow
-18.0%
Cash-on-Cash Return
2.1%
Cap rate
0.7%
Rent to Value Ratio
Active
$290,000
1
bds
|
1
ba
|
860
sqft
|
built
1949
130 S Canal St, Chicago, IL 60606
$-894
Cash flow
-16.1%
Cash-on-Cash Return
2.6%
Cap rate
0.9%
Rent to Value Ratio
Active
$335,000
4
bds
|
2
ba
|
3,190
sqft
|
built
1953
7220 S Spaulding Ave, Chicago, IL 60629
$-629
Cash flow
-9.8%
Cash-on-Cash Return
4.0%
Cap rate
0.6%
Rent to Value Ratio
Active
$249,900
4
bds
|
2
ba
|
2,220
sqft
|
built
1924
7649 S Michigan Ave, Chicago, IL 60619
$37
Cash flow
0.8%
Cash-on-Cash Return
5.9%
Cap rate
0.8%
Rent to Value Ratio
Active
$275,000
1
bds
|
1
ba
|
900
sqft
|
built
1914
5656 S Dorchester Ave, Chicago, IL 60637
$-620
Cash flow
-11.8%
Cash-on-Cash Return
3.6%
Cap rate
0.7%
Rent to Value Ratio

Active
$192,500
1
bds
|
1
ba
|
0
sqft
|
built
1954
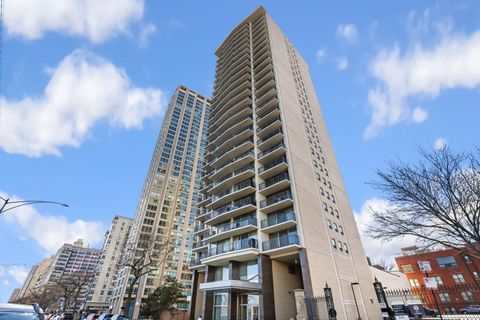
2909 N Sheridan Rd, Chicago, IL 60657
$-551
Cash flow
-14.9%
Cash-on-Cash Return
2.2%
Cap rate
0.9%
Rent to Value Ratio

Active
$211,999
3
bds
|
2
ba
|
1,300
sqft
|
built
1964
11642 S Loomis St, Chicago, IL 60643
$380
Cash flow
9.4%
Cash-on-Cash Return
7.8%
Cap rate
1.0%
Rent to Value Ratio

Active
$769,000
12
bds
|
7
ba
|
0
sqft
|
built
1920
1531 S Kolin Ave, Chicago, IL 60623
$-2,718
Cash flow
-18.4%
Cash-on-Cash Return
1.4%
Cap rate
0.3%
Rent to Value Ratio

Active
$675,000
6
bds
|
3
ba
|
0
sqft
|
built
1982
3430 S Parnell Ave, Chicago, IL 60616
$-2,669
Cash flow
-20.6%
Cash-on-Cash Return
0.9%
Cap rate
0.3%
Rent to Value Ratio

Active
$2,199,999
6
bds
|
6
ba
|
0
sqft
|
built
1883
1420 W Fulton St, Chicago, IL 60607
$-7,940
Cash flow
-18.8%
Cash-on-Cash Return
1.3%
Cap rate
0.3%
Rent to Value Ratio

Active
$714,500
9
bds
|
3
ba
|
0
sqft
|
built
1924
6030 N Claremont Ave, Chicago, IL 60659
$-2,082
Cash flow
-15.2%
Cash-on-Cash Return
2.2%
Cap rate
0.4%
Rent to Value Ratio
Active
$240,000
6
bds
|
2
ba
|
0
sqft
|
built
1908
7042 S Carpenter St, Chicago, IL 60621
$-392
Cash flow
-8.5%
Cash-on-Cash Return
4.3%
Cap rate
0.6%
Rent to Value Ratio
Active
$320,000
2
bds
|
1
ba
|
0
sqft
|
built
1969
5455 N Sheridan Rd, Chicago, IL 60640
$-801
Cash flow
-13.1%
Cash-on-Cash Return
3.3%
Cap rate
0.9%
Rent to Value Ratio
Active
$235,000
2
bds
|
2
ba
|
1,500
sqft
|
built
2004
6640 S Maryland Ave, Chicago, IL 60637
$-629
Cash flow
-14.0%
Cash-on-Cash Return
3.1%
Cap rate
0.8%
Rent to Value Ratio
Active
$399,000
1
bds
|
1
ba
|
975
sqft
|
built
2003
737 W Washington Blvd, Chicago, IL 60661
$-1,709
Cash flow
-22.3%
Cash-on-Cash Return
1.1%
Cap rate
0.7%
Rent to Value Ratio
Active
$495,000
12
bds
|
3
ba
|
0
sqft
|
built
1890
2735 W Washington Blvd, Chicago, IL 60612
$-1,453
Cash flow
-15.3%
Cash-on-Cash Return
2.7%
Cap rate
0.5%
Rent to Value Ratio
Active
$900,000
8
bds
|
5
ba
|
0
sqft
|
built
1883
2531 W Lyndale St, Chicago, IL 60647
$-3,154
Cash flow
-18.3%
Cash-on-Cash Return
2.1%
Cap rate
0.4%
Rent to Value Ratio
Active
$169,000
5
bds
|
2
ba
|
988
sqft
|
built
1968
5348 S Peoria St, Chicago, IL 60609
$486
Cash flow
15.0%
Cash-on-Cash Return
9.7%
Cap rate
1.2%
Rent to Value Ratio
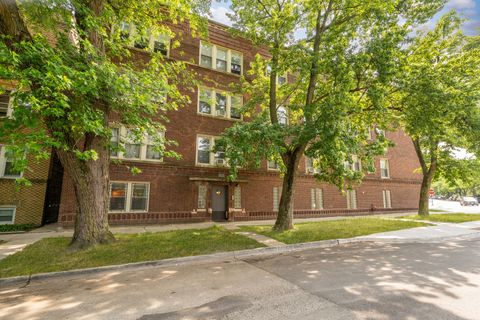
Active
$154,900
2
bds
|
1
ba
|
800
sqft
|
built
1924
2554 W Rosemont Ave, Chicago, IL 60659
$-313
Cash flow
-10.5%
Cash-on-Cash Return
3.8%
Cap rate
0.9%
Rent to Value Ratio
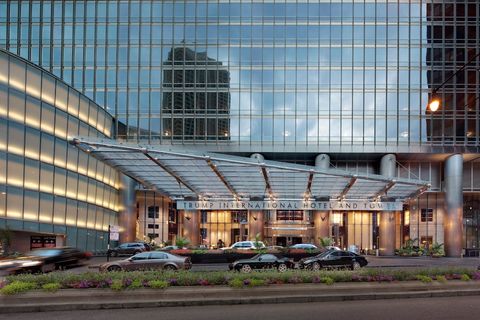
Active
$1,495,000
2
bds
|
3
ba
|
2,076
sqft
|
built
2008
401 N Wabash Ave, Chicago, IL 60611
$-6,931
Cash flow
-24.2%
Cash-on-Cash Return
0.7%
Cap rate
0.4%
Rent to Value Ratio

Active
$269,000
4
bds
|
2
ba
|
1,496
sqft
|
built
1910
6409 S Champlain Ave, Chicago, IL 60637
$258
Cash flow
5.0%
Cash-on-Cash Return
6.8%
Cap rate
0.9%
Rent to Value Ratio

Active
$170,000
2
bds
|
1
ba
|
1,082
sqft
|
built
1943
8619 S Jeffery Blvd, Chicago, IL 60617
$423
Cash flow
13.0%
Cash-on-Cash Return
8.7%
Cap rate
1.2%
Rent to Value Ratio

Active
$240,000
1
bds
|
1
ba
|
875
sqft
|
built
1911
910 S Michigan Ave, Chicago, IL 60605
$-423
Cash flow
-9.2%
Cash-on-Cash Return
3.6%
Cap rate
1.0%
Rent to Value Ratio

Active
$225,000
2
bds
|
2
ba
|
792
sqft
|
built
1951
10005 S Calhoun Ave, Chicago, IL 60617
$338
Cash flow
7.8%
Cash-on-Cash Return
7.5%
Cap rate
1.0%
Rent to Value Ratio
Active
$259,000
3
bds
|
2
ba
|
2,307
sqft
|
built
1894
10509 S Edbrooke Ave, Chicago, IL 60628
$230
Cash flow
4.6%
Cash-on-Cash Return
6.7%
Cap rate
0.8%
Rent to Value Ratio
Active
$249,999
5
bds
|
2
ba
|
1,350
sqft
|
built
1903
10554 S State St, Chicago, IL 60628
$369
Cash flow
7.7%
Cash-on-Cash Return
7.4%
Cap rate
0.9%
Rent to Value Ratio
Active
$235,000
4
bds
|
2
ba
|
1,502
sqft
|
built
1880
435 E 46th Pl, Chicago, IL 60653
$186
Cash flow
4.1%
Cash-on-Cash Return
7.2%
Cap rate
1.1%
Rent to Value Ratio

Active
$409,000
4
bds
|
2
ba
|
1,500
sqft
|
built
1967
3455 W 115th St, Chicago, IL 60655
$-739
Cash flow
-9.4%
Cash-on-Cash Return
4.1%
Cap rate
0.6%
Rent to Value Ratio

Active
$399,000
2
bds
|
2
ba
|
0
sqft
|
built
2006
1620 S Michigan Ave, Chicago, IL 60616
$-976
Cash flow
-12.8%
Cash-on-Cash Return
3.3%
Cap rate
0.8%
Rent to Value Ratio
Active
$750,000
8
bds
|
4
ba
|
0
sqft
|
built
1924
5125 N La Crosse Ave, Chicago, IL 60630
$-2,935
Cash flow
-20.4%
Cash-on-Cash Return
1.6%
Cap rate
0.3%
Rent to Value Ratio