Chicago, IL Investment Properties for Sale
Browse homes for sale and investment properties in Chicago, IL. Refine your search by price, property type, or more.
Best cash flowing properties in Chicago, IL

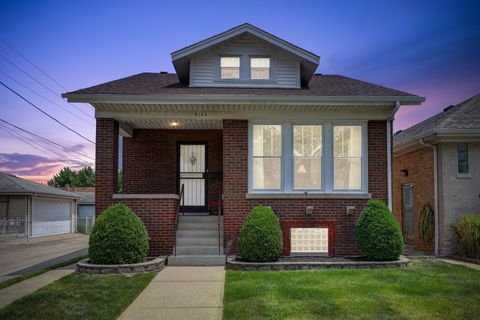
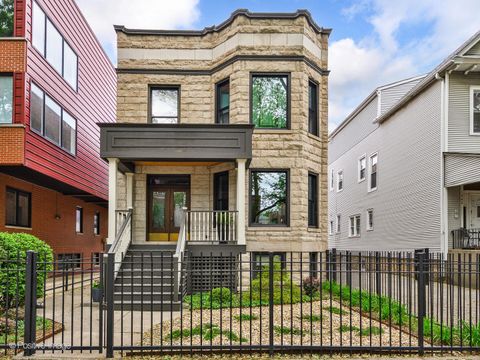
Active
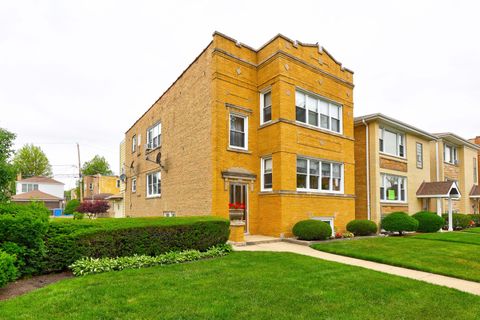
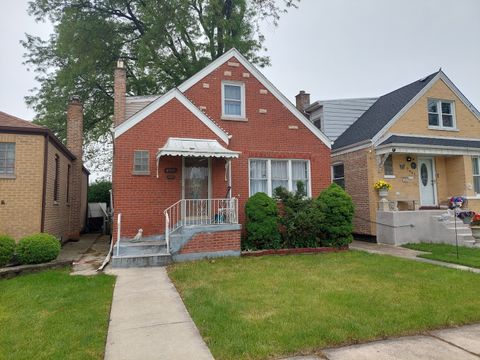
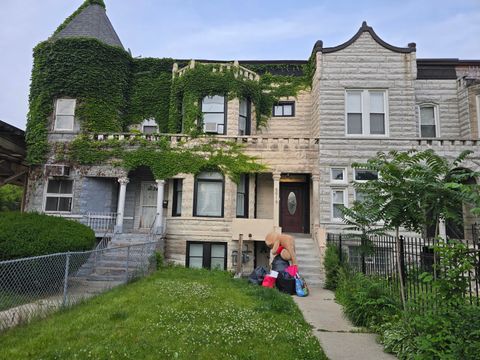
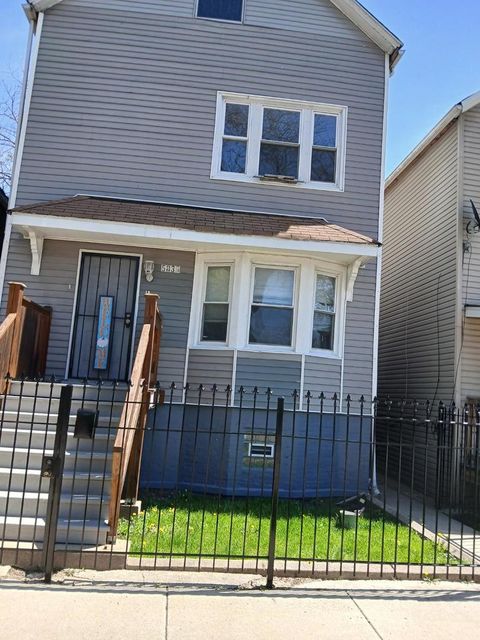
$245,000
4
bds
|
2
ba
|
1,439
sqft
|
built
1898
7227 S Paulina St, Chicago, IL 60636
$582
Cash flow
12.4%
Cash-on-Cash Return
8.5%
Cap rate
1.1%
Rent to Value Ratio

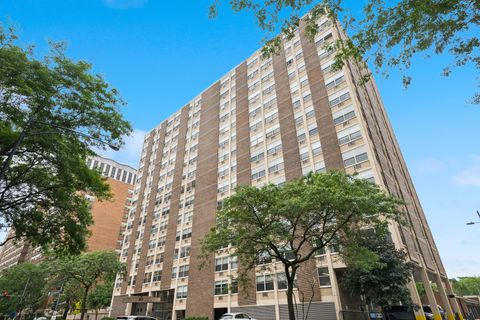
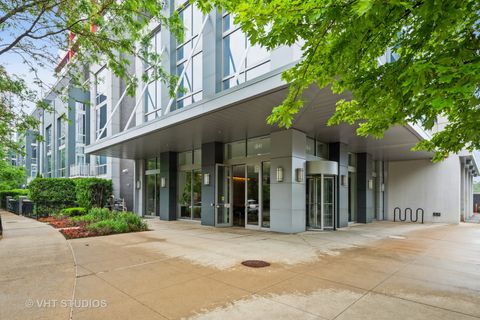
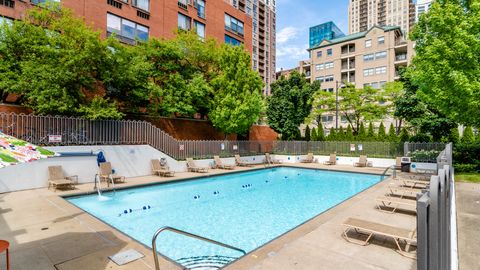
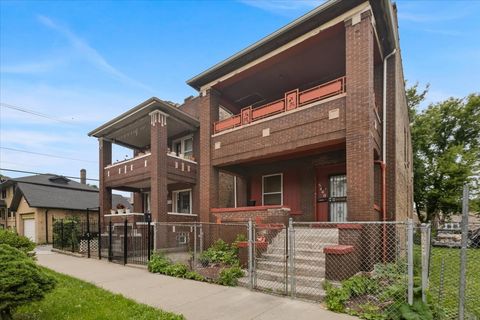
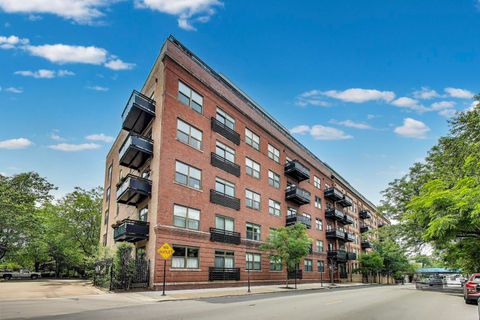
Active
$415,000
1
bds
|
1
ba
|
706
sqft
|
built
1968
505 N Lake Shore Dr, Chicago, IL 60611
$465
Cash flow
5.8%
Cash-on-Cash Return
7.0%
Cap rate
1.2%
Rent to Value Ratio
3,849 out of 4,474 properties for sale in Chicago, IL
Limited Results Shown
Create a free account, or log in to reveal all property listings and enjoy the complete experience.

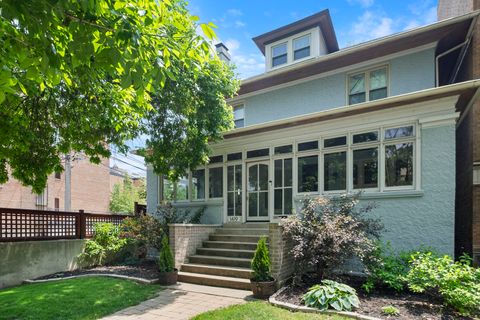
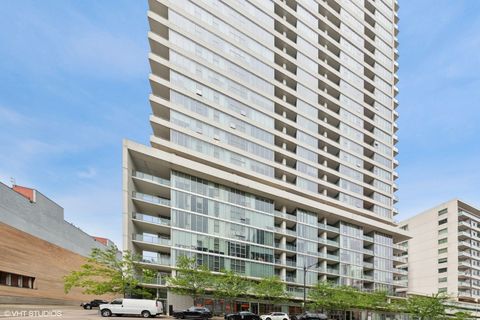
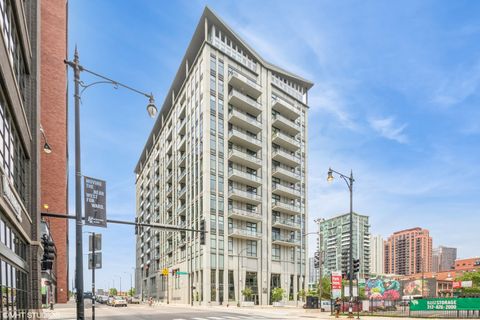
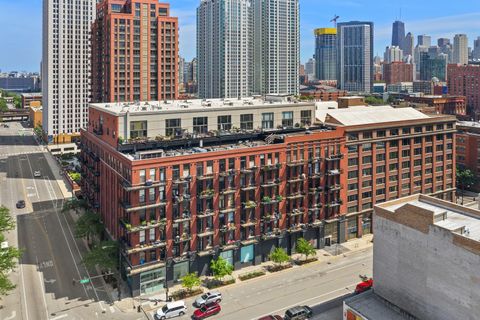
Active
$485,000
2
bds
|
2
ba
|
0
sqft
|
built
1974
2144 N Lincoln Park W, Chicago, IL 60614
$-1,860
Cash flow
-20.0%
Cash-on-Cash Return
1.1%
Cap rate
0.5%
Rent to Value Ratio

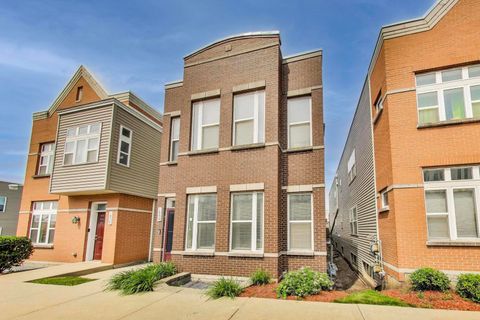
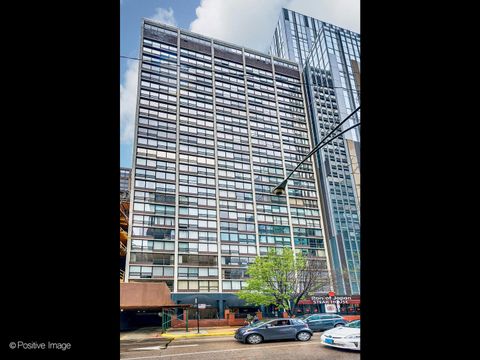
Active
$435,000
2
bds
|
2
ba
|
1,300
sqft
|
built
1977
405 N Wabash Ave, Chicago, IL 60611
$-1,968
Cash flow
-23.6%
Cash-on-Cash Return
0.3%
Cap rate
0.9%
Rent to Value Ratio

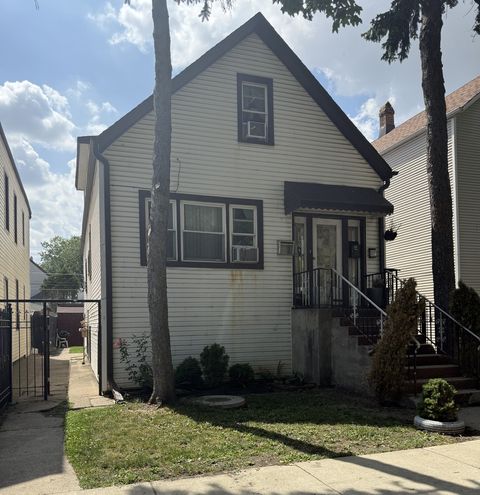
Active
$470,000
4
bds
|
2
ba
|
0
sqft
|
built
1926
1009 N Harding Ave, Chicago, IL 60651
$-964
Cash flow
-10.7%
Cash-on-Cash Return
3.2%
Cap rate
0.4%
Rent to Value Ratio
Active
$399,000
2
bds
|
2
ba
|
1,151
sqft
|
built
1966
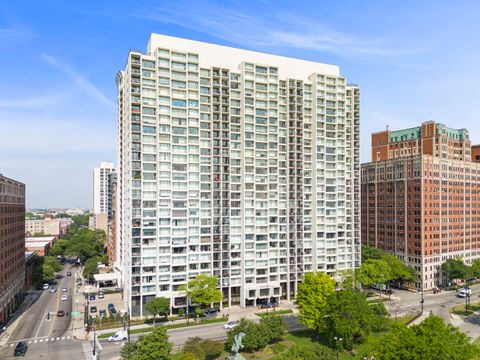
3200 N Lake Shore Dr, Chicago, IL 60657
$-1,853
Cash flow
-24.2%
Cash-on-Cash Return
0.7%
Cap rate
0.8%
Rent to Value Ratio
Active
$1,075,000
5
bds
|
4
ba
|
3,300
sqft
|
built
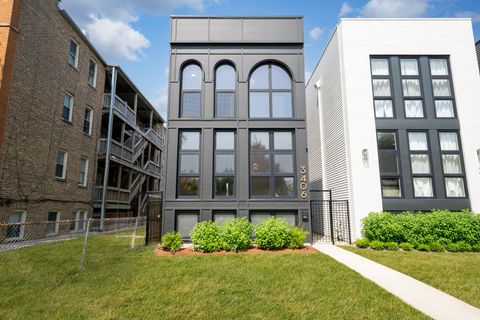
2019
3406 N Keating Ave, Chicago, IL 60641
$-1,648
Cash flow
-8.0%
Cash-on-Cash Return
4.4%
Cap rate
0.7%
Rent to Value Ratio
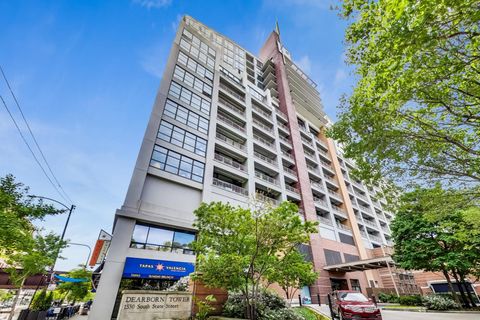
Active
$409,000
2
bds
|
2
ba
|
1,416
sqft
|
built
1530 S State St, Chicago, IL 60605
$-1,961
Cash flow
-25.0%
Cash-on-Cash Return
0.5%
Cap rate
0.6%
Rent to Value Ratio
Active
$1,100,000
3
bds
|
3
ba
|
3,000
sqft
|
built
1887
2012 W Charleston St, Chicago, IL 60647
$-2,923
Cash flow
-13.9%
Cash-on-Cash Return
3.1%
Cap rate
0.5%
Rent to Value Ratio
Active
$270,000
2
bds
|
1
ba
|
0
sqft
|
built
1968
3033 N Sheridan Rd, Chicago, IL 60657
$-753
Cash flow
-14.6%
Cash-on-Cash Return
2.9%
Cap rate
1.0%
Rent to Value Ratio
Active
$397,000
5
bds
|
2
ba
|
1,479
sqft
|
built
1910
5143 N Monitor Ave, Chicago, IL 60630
$-358
Cash flow
-4.7%
Cash-on-Cash Return
5.2%
Cap rate
0.8%
Rent to Value Ratio
Active
$415,000
1
bds
|
1
ba
|
706
sqft
|
built
1968
505 N Lake Shore Dr, Chicago, IL 60611
$465
Cash flow
5.8%
Cash-on-Cash Return
7.0%
Cap rate
1.2%
Rent to Value Ratio

Active
$325,000
1
bds
|
2
ba
|
0
sqft
|
built
1997
1418 W Cortez St, Chicago, IL 60642
$-306
Cash flow
-4.9%
Cash-on-Cash Return
4.5%
Cap rate
0.8%
Rent to Value Ratio
Active
$325,000
4
bds
|
3
ba
|
1,688
sqft
|
built
1948
8207 S Laflin St, Chicago, IL 60620
$-501
Cash flow
-8.0%
Cash-on-Cash Return
3.8%
Cap rate
0.6%
Rent to Value Ratio
Active
$579,900
4
bds
|
2
ba
|
0
sqft
|
built
1925
5624 N Major Ave, Chicago, IL 60646
$-1,622
Cash flow
-14.6%
Cash-on-Cash Return
2.3%
Cap rate
0.4%
Rent to Value Ratio
Active
$679,000
5
bds
|
3
ba
|
0
sqft
|
built
1926
4934 N Marmora Ave, Chicago, IL 60630
$-1,973
Cash flow
-15.2%
Cash-on-Cash Return
2.8%
Cap rate
0.4%
Rent to Value Ratio
Active
$435,000
2
bds
|
2
ba
|
1,260
sqft
|
built
2006
1841 S Calumet Ave, Chicago, IL 60616
$-2,155
Cash flow
-25.8%
Cash-on-Cash Return
0.3%
Cap rate
0.6%
Rent to Value Ratio
Active
$890,000
5
bds
|
4
ba
|
4,210
sqft
|
built
1901
1419 W Birchwood Ave, Chicago, IL 60626
$-1,222
Cash flow
-7.2%
Cash-on-Cash Return
4.6%
Cap rate
0.7%
Rent to Value Ratio
Active
$600,000
6
bds
|
5
ba
|
0
sqft
|
built
2008
1900 N Laramie Ave, Chicago, IL 60639
$-2,040
Cash flow
-17.7%
Cash-on-Cash Return
2.2%
Cap rate
0.4%
Rent to Value Ratio
Active
$219,900
3
bds
|
3
ba
|
1,200
sqft
|
built
1950
3639 W 69th St, Chicago, IL 60629
$110
Cash flow
2.6%
Cash-on-Cash Return
6.9%
Cap rate
1.0%
Rent to Value Ratio
Active
$349,900
2
bds
|
2
ba
|
1,250
sqft
|
built
1979
1169 S Plymouth Ct, Chicago, IL 60605
$-1,294
Cash flow
-19.3%
Cash-on-Cash Return
1.8%
Cap rate
0.8%
Rent to Value Ratio
Active
$315,000
2
bds
|
1
ba
|
0
sqft
|
built
2008
1720 S Michigan Ave, Chicago, IL 60616
$-965
Cash flow
-16.0%
Cash-on-Cash Return
2.6%
Cap rate
0.8%
Rent to Value Ratio
Active
$249,900
4
bds
|
3
ba
|
1,900
sqft
|
built
1914
5130 S Whipple St, Chicago, IL 60632
$-130
Cash flow
-2.7%
Cash-on-Cash Return
5.6%
Cap rate
0.8%
Rent to Value Ratio

Active
$389,900
4
bds
|
2
ba
|
1,107
sqft
|
built
1923
5941 W Waveland Ave, Chicago, IL 60634
$-267
Cash flow
-3.6%
Cash-on-Cash Return
4.9%
Cap rate
0.7%
Rent to Value Ratio
Active
$145,000
1
bds
|
1
ba
|
796
sqft
|
built
1982
4800 S Chicago Beach Dr, Chicago, IL 60615
$-315
Cash flow
-11.3%
Cash-on-Cash Return
3.1%
Cap rate
1.4%
Rent to Value Ratio

Active
$319,900
8
bds
|
3
ba
|
0
sqft
|
built
1898
6948 S Eberhart Ave, Chicago, IL 60637
$-413
Cash flow
-6.7%
Cash-on-Cash Return
4.1%
Cap rate
0.6%
Rent to Value Ratio

Active
$625,000
1
bds
|
2
ba
|
1,897
sqft
|
built
1974
1516 N State Pkwy, Chicago, IL 60610
$-2,121
Cash flow
-17.7%
Cash-on-Cash Return
1.6%
Cap rate
0.7%
Rent to Value Ratio
Active
$1,795,000
6
bds
|
5
ba
|
4,000
sqft
|
built
1920
1252 W Carmen Ave, Chicago, IL 60640
$-9,318
Cash flow
-27.1%
Cash-on-Cash Return
0.0%
Cap rate
0.2%
Rent to Value Ratio
Active
$240,000
5
bds
|
3
ba
|
0
sqft
|
built
1914
5440 S Paulina St, Chicago, IL 60609
$89
Cash flow
1.9%
Cash-on-Cash Return
6.7%
Cap rate
0.9%
Rent to Value Ratio
Active
$620,000
2
bds
|
2
ba
|
1,338
sqft
|
built
2007
740 W Fulton St, Chicago, IL 60661
$-2,000
Cash flow
-16.8%
Cash-on-Cash Return
2.4%
Cap rate
0.7%
Rent to Value Ratio
Active
$465,000
7
bds
|
3
ba
|
0
sqft
|
built
1898
5919 S Indiana Ave, Chicago, IL 60637
$-884
Cash flow
-9.9%
Cash-on-Cash Return
4.0%
Cap rate
0.6%
Rent to Value Ratio
Active
$445,000
2
bds
|
2
ba
|
1,153
sqft
|
built
1978
1735 W Diversey Pkwy, Chicago, IL 60614
$-1,374
Cash flow
-16.1%
Cash-on-Cash Return
2.6%
Cap rate
0.6%
Rent to Value Ratio
Active
$570,000
2
bds
|
2
ba
|
0
sqft
|
built
1881
616 W Fulton St, Chicago, IL 60661
$-2,265
Cash flow
-20.7%
Cash-on-Cash Return
1.5%
Cap rate
0.5%
Rent to Value Ratio
Active
$220,000
1
bds
|
1
ba
|
0
sqft
|
built
1969
230 E Ontario St, Chicago, IL 60611
$-996
Cash flow
-23.6%
Cash-on-Cash Return
0.8%
Cap rate
0.9%
Rent to Value Ratio
Active
$245,000
4
bds
|
2
ba
|
1,439
sqft
|
built
1898
7227 S Paulina St, Chicago, IL 60636
$582
Cash flow
12.4%
Cash-on-Cash Return
8.5%
Cap rate
1.1%
Rent to Value Ratio

Active
$385,000
2
bds
|
2
ba
|
1,165
sqft
|
built
1989
200 N Dearborn St, Chicago, IL 60601
$-1,459
Cash flow
-19.8%
Cash-on-Cash Return
1.1%
Cap rate
0.8%
Rent to Value Ratio
Active
$229,900
8
bds
|
2
ba
|
0
sqft
|
built
1886
5039 S Elizabeth St, Chicago, IL 60609
$106
Cash flow
2.4%
Cash-on-Cash Return
6.8%
Cap rate
1.0%
Rent to Value Ratio
Active
$554,900
6
bds
|
3
ba
|
0
sqft
|
built
1903
157 N Leamington Ave, Chicago, IL 60644
$-2,045
Cash flow
-19.2%
Cash-on-Cash Return
1.8%
Cap rate
0.3%
Rent to Value Ratio
Active
$499,900
5
bds
|
4
ba
|
3,500
sqft
|
built
1903
5127 S Artesian Ave, Chicago, IL 60632
$-1,155
Cash flow
-12.1%
Cash-on-Cash Return
3.5%
Cap rate
0.5%
Rent to Value Ratio
Active
$2,795,000
5
bds
|
4
ba
|
5,000
sqft
|
built
1874
1714 N Sedgwick St, Chicago, IL 60614
$-12,497
Cash flow
-23.3%
Cash-on-Cash Return
0.9%
Cap rate
0.3%
Rent to Value Ratio

Active
$510,000
2
bds
|
3
ba
|
0
sqft
|
built
1901
2150 W North Ave, Chicago, IL 60647
$-1,099
Cash flow
-11.2%
Cash-on-Cash Return
3.1%
Cap rate
0.6%
Rent to Value Ratio

Active
$219,900
9
bds
|
4
ba
|
0
sqft
|
built
1925
10230 S Yates Blvd, Chicago, IL 60617
$-458
Cash flow
-10.9%
Cash-on-Cash Return
3.2%
Cap rate
0.5%
Rent to Value Ratio