Chicago, IL Investment Properties for Sale
Browse homes for sale and investment properties in Chicago, IL. Refine your search by price, property type, or more.
Best cash flowing properties in Chicago, IL
Active
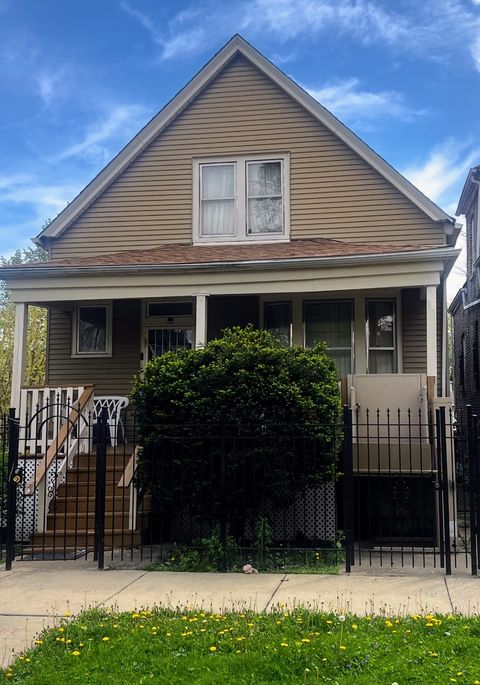
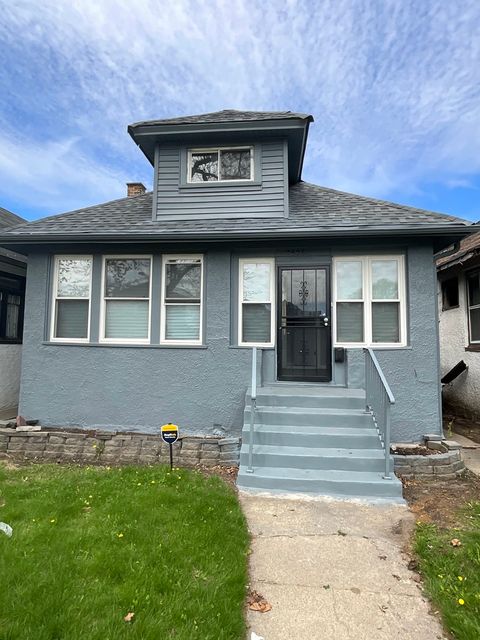
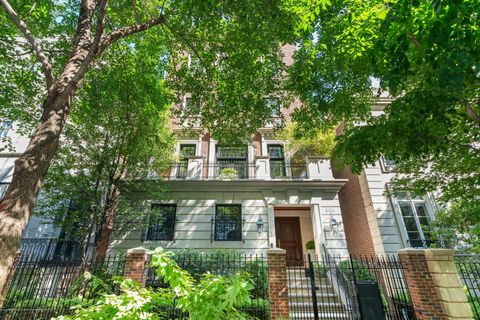
$109,900
3
bds
|
2
ba
|
3,321
sqft
|
built
1908
6427 S Winchester Ave, Chicago, IL 60636
$668
Cash flow
31.7%
Cash-on-Cash Return
13.6%
Cap rate
1.6%
Rent to Value Ratio
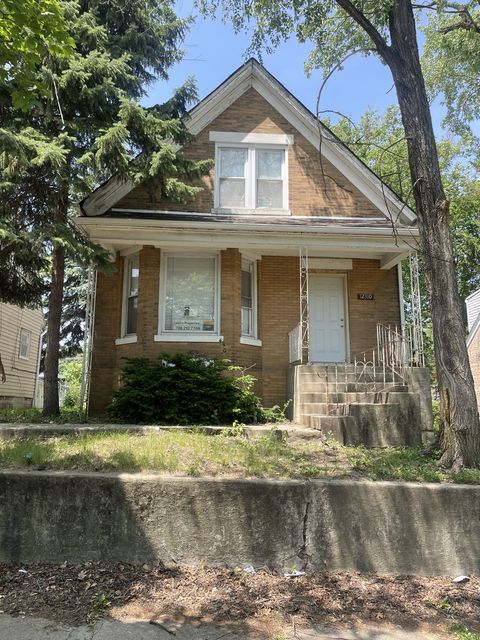
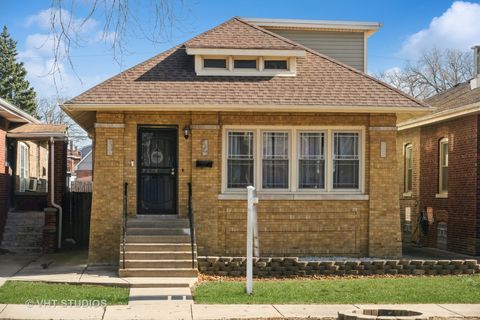
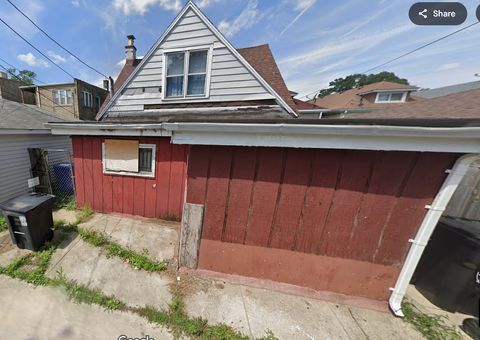
Active
$89,900
4
bds
|
2
ba
|
0
sqft
|
built
1904
12310 S Yale Ave, Chicago, IL 60628
$591
Cash flow
34.3%
Cash-on-Cash Return
13.6%
Cap rate
1.8%
Rent to Value Ratio
3,110 out of 3,654 properties for sale in Chicago, IL
Limited Results Shown
Create a free account, or log in to reveal all property listings and enjoy the complete experience.

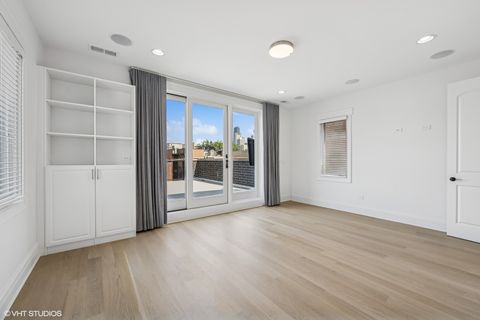
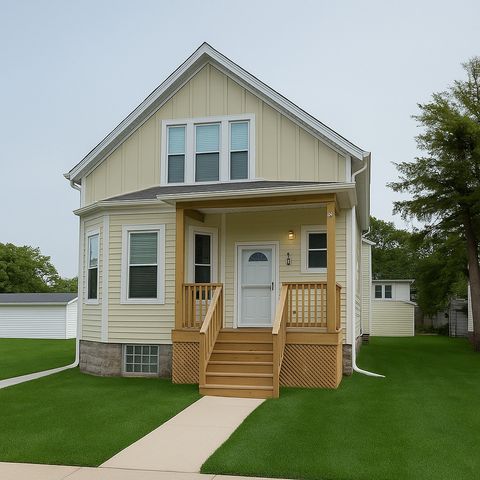
Active
$350,000
2
bds
|
2
ba
|
1,500
sqft
|
built
2007
4325 N Cicero Ave, Chicago, IL 60641
$-827
Cash flow
-12.3%
Cash-on-Cash Return
2.8%
Cap rate
0.6%
Rent to Value Ratio

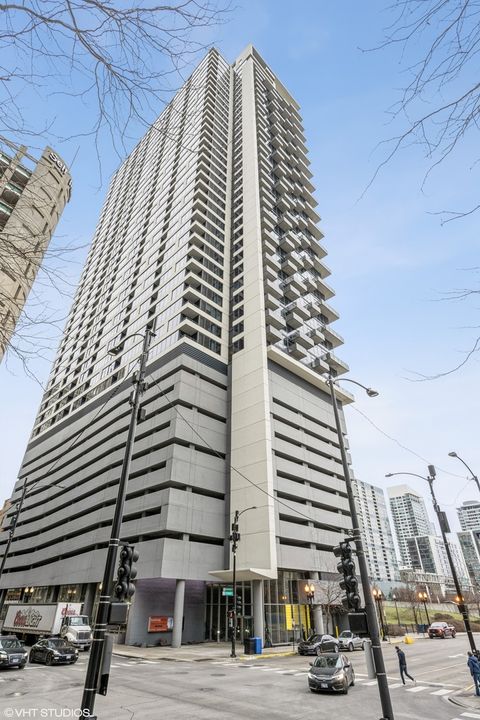
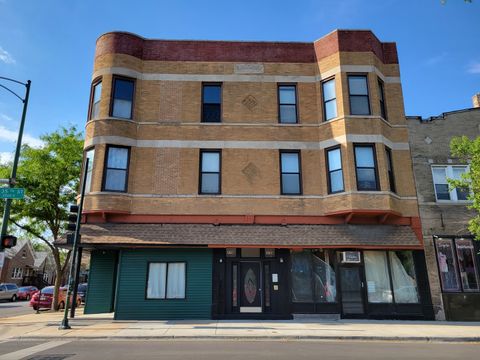
Active
$399,900
2
bds
|
2
ba
|
1,074
sqft
|
built
1934
1847 N Kedzie Ave, Chicago, IL 60647
$-856
Cash flow
-11.2%
Cash-on-Cash Return
3.1%
Cap rate
0.6%
Rent to Value Ratio

Active
$319,900
2
bds
|
1
ba
|
0
sqft
|
built
1905
1423 N Ashland Ave, Chicago, IL 60622
$-486
Cash flow
-7.9%
Cash-on-Cash Return
3.9%
Cap rate
0.8%
Rent to Value Ratio

Active
$229,000
3
bds
|
1
ba
|
1,256
sqft
|
built
1949
9019 S Justine St, Chicago, IL 60620
$49
Cash flow
1.1%
Cash-on-Cash Return
5.9%
Cap rate
0.9%
Rent to Value Ratio
Active
$2,395,000
5
bds
|
6
ba
|
5,200
sqft
|
built
2007
1431 N Mohawk St, Chicago, IL 60610
$-8,659
Cash flow
-18.9%
Cash-on-Cash Return
1.3%
Cap rate
0.4%
Rent to Value Ratio

Active
$149,900
3
bds
|
1
ba
|
0
sqft
|
built
1953
4505 S Kilpatrick Ave, Chicago, IL 60632
$11
Cash flow
0.4%
Cash-on-Cash Return
5.8%
Cap rate
0.9%
Rent to Value Ratio

Active
$815,000
2
bds
|
2
ba
|
2,058
sqft
|
built
1989
132 E Delaware Pl, Chicago, IL 60611
$-4,482
Cash flow
-28.7%
Cash-on-Cash Return
-0.9%
Cap rate
0.6%
Rent to Value Ratio

Active
$245,000
4
bds
|
1
ba
|
1,542
sqft
|
built
1919
5443 S Long Ave, Chicago, IL 60638
$74
Cash flow
1.6%
Cash-on-Cash Return
6.0%
Cap rate
0.9%
Rent to Value Ratio
Active
$360,000
2
bds
|
2
ba
|
1,083
sqft
|
built
2009
235 W Van Buren St, Chicago, IL 60607
$-1,039
Cash flow
-15.1%
Cash-on-Cash Return
2.2%
Cap rate
0.7%
Rent to Value Ratio

Active
$464,900
2
bds
|
1
ba
|
0
sqft
|
built
1970
1560 N Sandburg Ter, Chicago, IL 60610
$-889
Cash flow
-10.0%
Cash-on-Cash Return
3.4%
Cap rate
0.8%
Rent to Value Ratio

Active
$519,900
5
bds
|
3
ba
|
2,756
sqft
|
built
1950
6321 N Merrimac Ave, Chicago, IL 60646
$-538
Cash flow
-5.4%
Cash-on-Cash Return
4.4%
Cap rate
0.7%
Rent to Value Ratio
Active
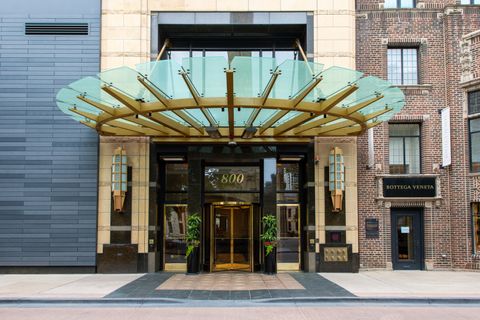
$2,995,000
4
bds
|
5
ba
|
5,200
sqft
|
built
2000
800 N Michigan Ave, Chicago, IL 60611
$-19,017
Cash flow
-33.1%
Cash-on-Cash Return
-1.9%
Cap rate
0.3%
Rent to Value Ratio
Active
$300,000
2
bds
|
1
ba
|
1,100
sqft
|
built
1925
918 W Sunnyside Ave, Chicago, IL 60640
$-463
Cash flow
-8.1%
Cash-on-Cash Return
3.8%
Cap rate
0.8%
Rent to Value Ratio
Active
$250,000
2
bds
|
2
ba
|
1,250
sqft
|
built
1918
4537 S Drexel Blvd, Chicago, IL 60653
$-257
Cash flow
-5.4%
Cash-on-Cash Return
4.4%
Cap rate
1.0%
Rent to Value Ratio

Active
$165,000
3
bds
|
2
ba
|
1,281
sqft
|
built
1952
8518 S Seeley Ave, Chicago, IL 60620
$468
Cash flow
14.8%
Cash-on-Cash Return
9.7%
Cap rate
1.4%
Rent to Value Ratio
Active
$410,000
2
bds
|
1
ba
|
1,140
sqft
|
built
2006
150 W Superior St, Chicago, IL 60654
$-1,558
Cash flow
-19.8%
Cash-on-Cash Return
1.1%
Cap rate
0.8%
Rent to Value Ratio

Active
$295,000
1
bds
|
1
ba
|
900
sqft
|
built
1893
525 N Halsted St, Chicago, IL 60642
$-513
Cash flow
-9.1%
Cash-on-Cash Return
3.6%
Cap rate
0.8%
Rent to Value Ratio

Active
$315,000
3
bds
|
2
ba
|
1,025
sqft
|
built
1958
4021 W 82nd Pl, Chicago, IL 60652
$-62
Cash flow
-1.0%
Cash-on-Cash Return
5.4%
Cap rate
0.8%
Rent to Value Ratio
Active
$290,000
4
bds
|
2
ba
|
1,900
sqft
|
built
1915
7606 S Luella Ave, Chicago, IL 60649
$109
Cash flow
2.0%
Cash-on-Cash Return
6.7%
Cap rate
0.9%
Rent to Value Ratio
Active
$420,000
4
bds
|
3
ba
|
3,000
sqft
|
built
1920
7427 S Bennett Ave, Chicago, IL 60649
$125
Cash flow
1.6%
Cash-on-Cash Return
6.0%
Cap rate
0.9%
Rent to Value Ratio
Active
$275,000
3
bds
|
3
ba
|
1,700
sqft
|
built
1907
7825 S Saint Lawrence Ave, Chicago, IL 60619
$-361
Cash flow
-6.8%
Cash-on-Cash Return
4.1%
Cap rate
0.5%
Rent to Value Ratio

Active
$825,000
6
bds
|
3
ba
|
2,120
sqft
|
built
1918
2231 N Lawndale Ave, Chicago, IL 60647
$-1,952
Cash flow
-12.3%
Cash-on-Cash Return
2.8%
Cap rate
0.5%
Rent to Value Ratio
Active
$185,000
3
bds
|
2
ba
|
1,080
sqft
|
built
1881
1756 W 35th St, Chicago, IL 60609
$-107
Cash flow
-3.0%
Cash-on-Cash Return
5.0%
Cap rate
1.1%
Rent to Value Ratio
Active
$3,500,000
5
bds
|
7
ba
|
6,500
sqft
|
built
1885
34 E Bellevue Pl, Chicago, IL 60611
$-16,481
Cash flow
-24.6%
Cash-on-Cash Return
0.0%
Cap rate
0.3%
Rent to Value Ratio
Active
$320,000
4
bds
|
3
ba
|
0
sqft
|
built
1913
6523 S Evans Ave, Chicago, IL 60637
$-340
Cash flow
-5.5%
Cash-on-Cash Return
4.4%
Cap rate
0.6%
Rent to Value Ratio

Active
$269,999
3
bds
|
2
ba
|
1,882
sqft
|
built
1961
457 E 91st St, Chicago, IL 60619
$358
Cash flow
6.9%
Cash-on-Cash Return
7.3%
Cap rate
0.9%
Rent to Value Ratio
Active
$230,000
3
bds
|
2
ba
|
1,522
sqft
|
built
1928
12509 S Emerald Ave, Chicago, IL 60628
$38
Cash flow
0.9%
Cash-on-Cash Return
6.5%
Cap rate
0.8%
Rent to Value Ratio
Active
$274,900
6
bds
|
3
ba
|
2,856
sqft
|
built
1923
8144 S Ada St, Chicago, IL 60620
$268
Cash flow
5.1%
Cash-on-Cash Return
7.4%
Cap rate
1.0%
Rent to Value Ratio
Active
$1,479,000
8
bds
|
8
ba
|
0
sqft
|
built
2017
4833 N Harding Ave, Chicago, IL 60625
$-7,189
Cash flow
-25.4%
Cash-on-Cash Return
0.4%
Cap rate
0.2%
Rent to Value Ratio
Active
$669,000
2
bds
|
3
ba
|
1,512
sqft
|
built
2004
737 W Washington Blvd, Chicago, IL 60661
$-2,468
Cash flow
-19.2%
Cash-on-Cash Return
1.3%
Cap rate
0.7%
Rent to Value Ratio
Active
$185,000
4
bds
|
1
ba
|
1,250
sqft
|
built
1920
8011 S Ada St, Chicago, IL 60620
$586
Cash flow
16.5%
Cash-on-Cash Return
9.5%
Cap rate
1.4%
Rent to Value Ratio

Active
$169,900
1
bds
|
1
ba
|
600
sqft
|
built
1974
4343 N Clarendon Ave, Chicago, IL 60613
$-409
Cash flow
-12.6%
Cash-on-Cash Return
2.8%
Cap rate
1.1%
Rent to Value Ratio

Active
$444,900
2
bds
|
1
ba
|
0
sqft
|
built
1974
405 N Wabash Ave, Chicago, IL 60611
$-852
Cash flow
-10.0%
Cash-on-Cash Return
3.4%
Cap rate
0.9%
Rent to Value Ratio
Active
$449,900
2
bds
|
1
ba
|
0
sqft
|
built
1970
1560 N Sandburg Ter, Chicago, IL 60610
$-812
Cash flow
-9.4%
Cash-on-Cash Return
3.5%
Cap rate
0.8%
Rent to Value Ratio

Active
$615,000
6
bds
|
4
ba
|
2,870
sqft
|
built
1902
10628 S Longwood Dr, Chicago, IL 60643
$-945
Cash flow
-8.0%
Cash-on-Cash Return
3.8%
Cap rate
0.7%
Rent to Value Ratio

Active
$349,000
2
bds
|
2
ba
|
1,200
sqft
|
built
2004
1503 S State St, Chicago, IL 60605
$-706
Cash flow
-10.6%
Cash-on-Cash Return
3.3%
Cap rate
0.8%
Rent to Value Ratio
Active
$4,500,000
6
bds
|
9
ba
|
0
sqft
|
built
2010
446 W Huron St, Chicago, IL 60654
$-21,010
Cash flow
-24.4%
Cash-on-Cash Return
0.1%
Cap rate
0.2%
Rent to Value Ratio
Active
$85,000
4
bds
|
1
ba
|
900
sqft
|
built
1926
7239 S Maplewood Ave, Chicago, IL 60629
$527
Cash flow
32.3%
Cash-on-Cash Return
13.7%
Cap rate
1.9%
Rent to Value Ratio