Chicago, IL Investment Properties for Sale
Browse homes for sale and investment properties in Chicago, IL. Refine your search by price, property type, or more.
Best cash flowing properties in Chicago, IL
Active
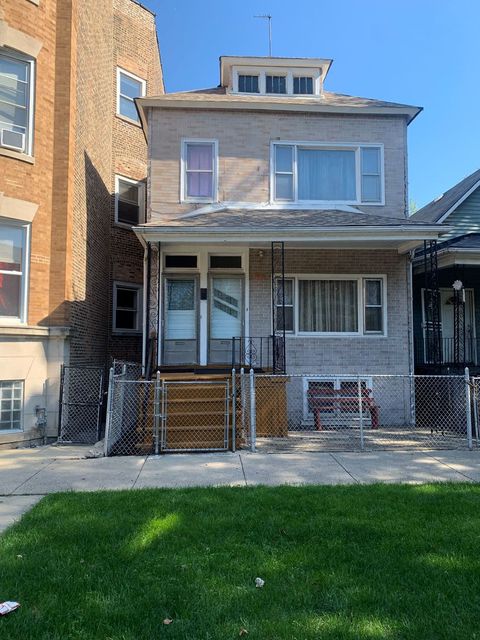
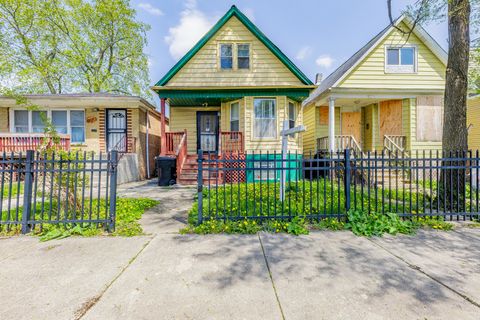
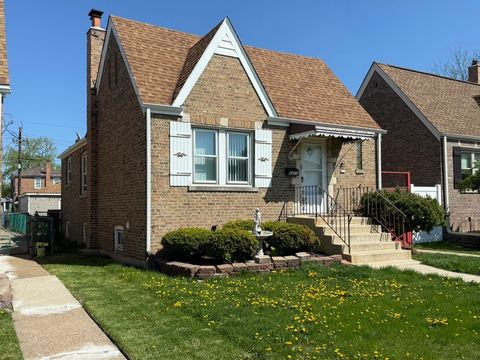
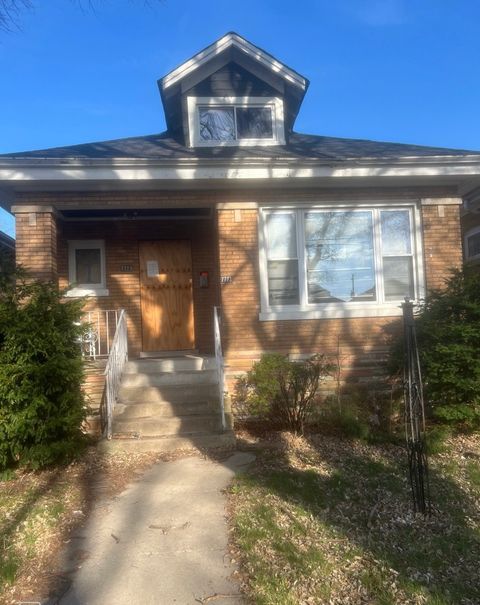
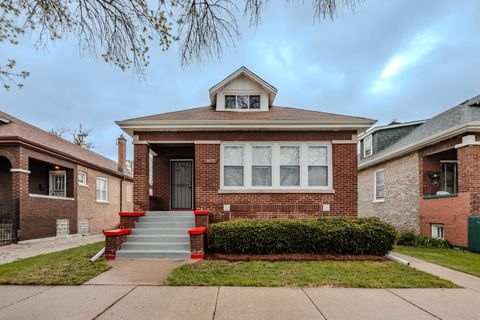
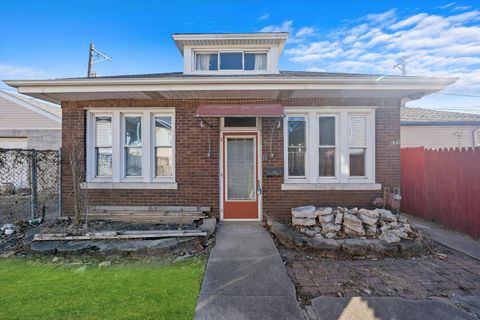
$144,900
4
bds
|
2
ba
|
0
sqft
|
built
1888
9019 S Exchange Ave, Chicago, IL 60617
$671
Cash flow
24.2%
Cash-on-Cash Return
11.2%
Cap rate
1.4%
Rent to Value Ratio
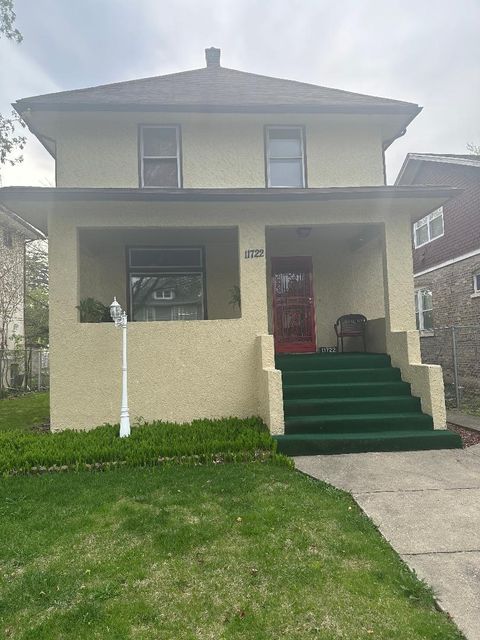
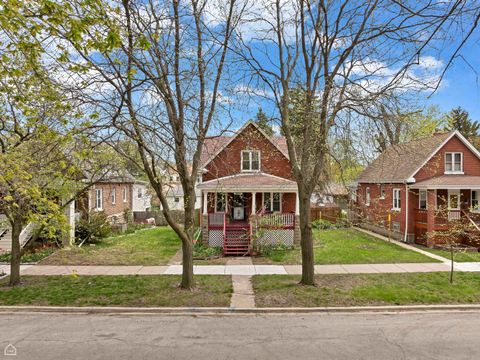
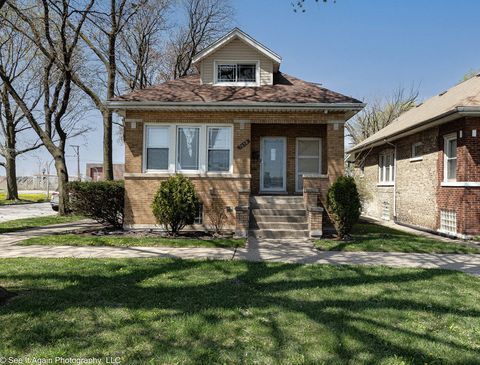
Active
$175,000
3
bds
|
3
ba
|
1,500
sqft
|
built
1908
11722 S Parnell Ave, Chicago, IL 60628
$627
Cash flow
18.7%
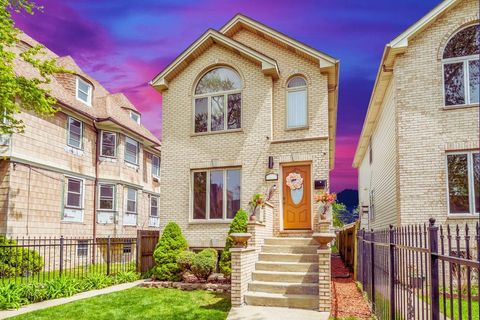
Cash-on-Cash Return
10.0%
Cap rate
1.3%
Rent to Value Ratio
3,965 out of 4,608 properties for sale in Chicago, IL
Limited Results Shown
Create a free account, or log in to reveal all property listings and enjoy the complete experience.
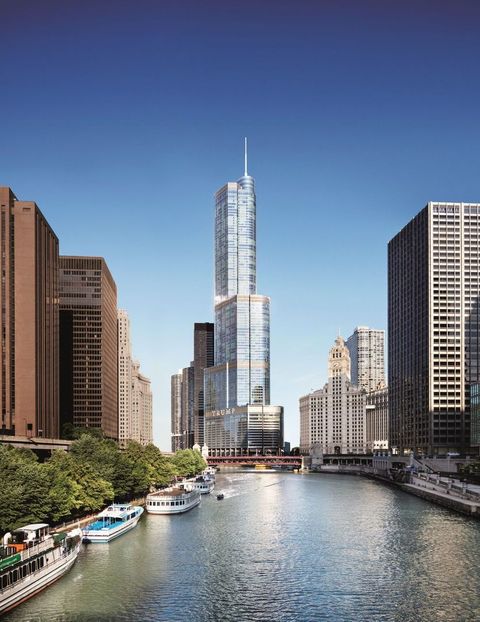
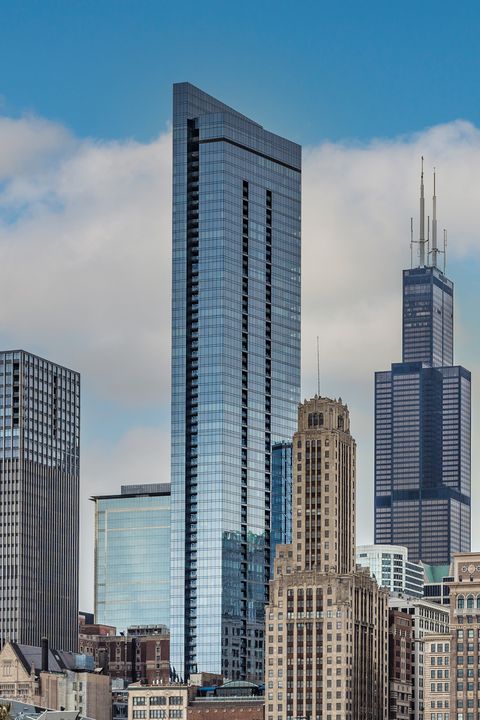
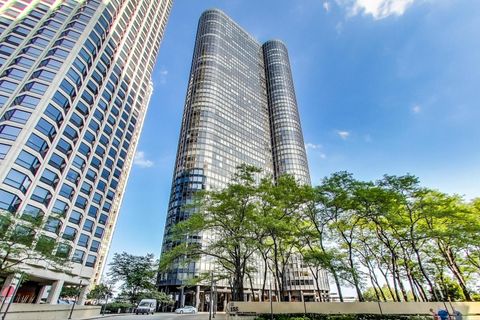
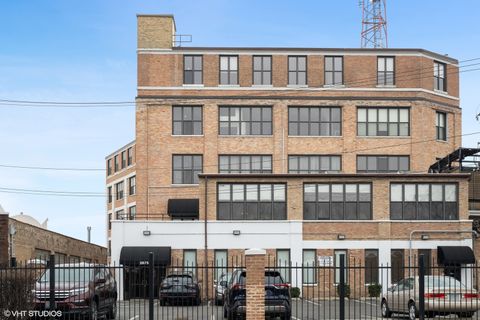
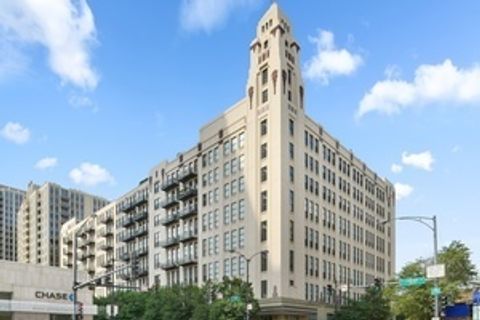
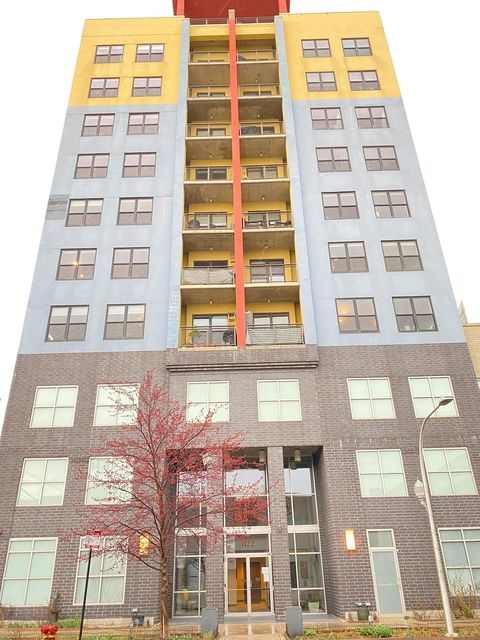
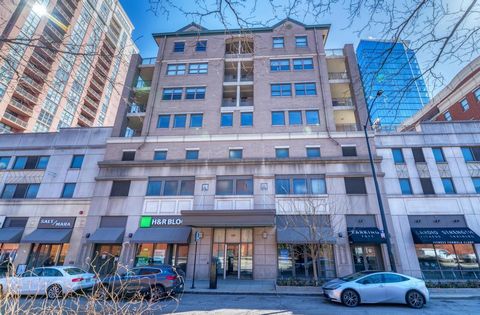
Active
$750,000
1
bds
|
2
ba
|
919
sqft
|
built
2008
401 N Wabash Ave, Chicago, IL 60611
$-2,813
Cash flow
-19.6%
Cash-on-Cash Return
1.2%
Cap rate
0.5%
Rent to Value Ratio
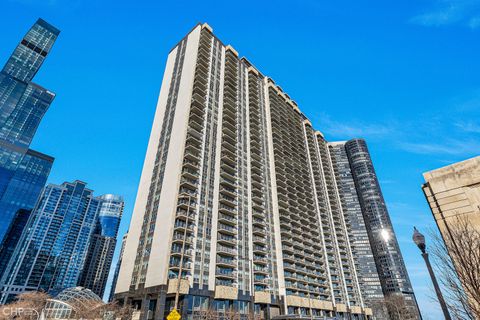
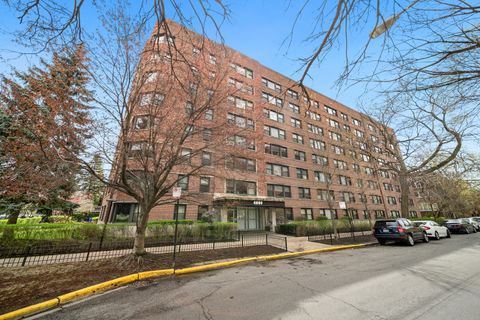
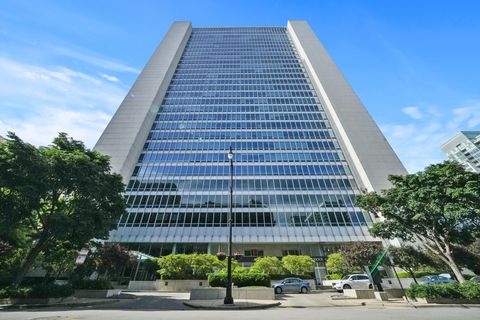
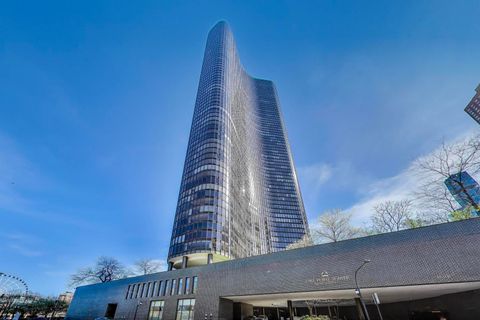
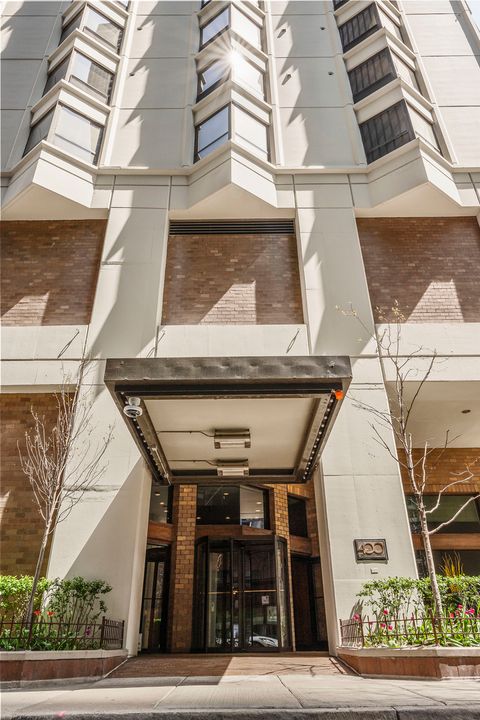
Active
$349,000
1
bds
|
1
ba
|
850
sqft
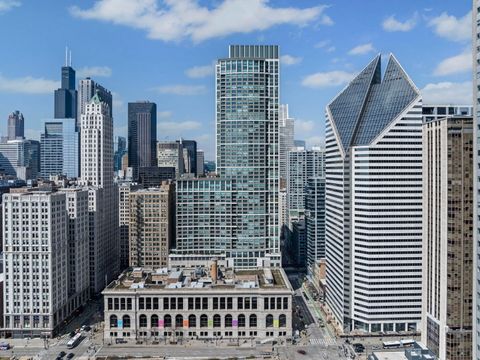
|
built
1963
400 E Randolph St, Chicago, IL 60601
$-1,140
Cash flow
-17.0%
Cash-on-Cash Return
1.8%
Cap rate
0.7%
Rent to Value Ratio
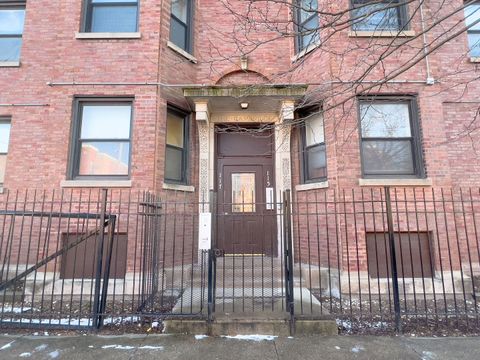
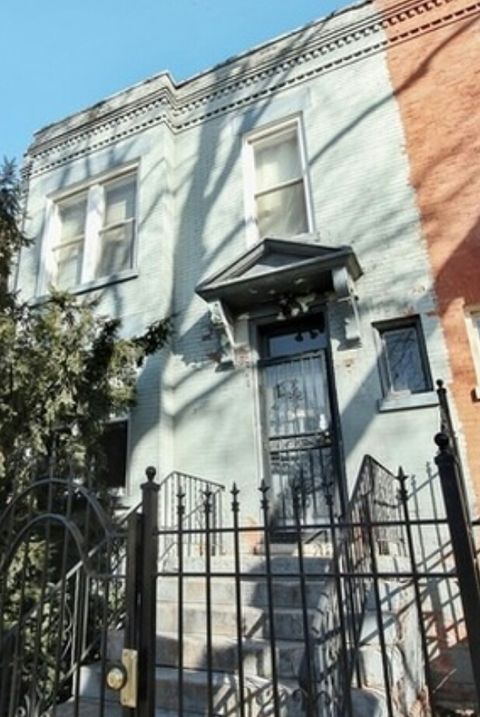
Active
$95,000
2
bds
|
1
ba
|
828
sqft
|
built
1903
6835 S Winchester Ave, Chicago, IL 60636
$601
Cash flow
33.0%
Cash-on-Cash Return
13.3%
Cap rate
1.7%
Rent to Value Ratio
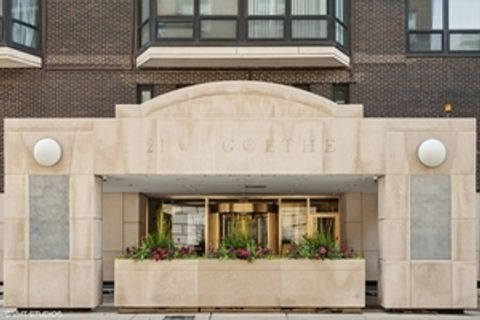
Active
$265,000
1
bds
|
1
ba
|
1,000
sqft
|
built
1962
21 W Goethe St, Chicago, IL 60610
$-1,226
Cash flow
-24.1%
Cash-on-Cash Return
0.1%
Cap rate
0.9%
Rent to Value Ratio

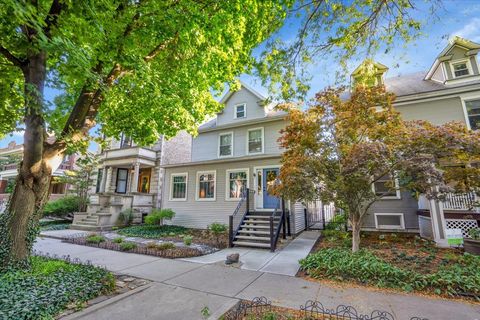
Active
$299,900
3
bds
|
2
ba
|
1,279
sqft
|
built
1941
10522 S Albany Ave, Chicago, IL 60655
$272
Cash flow
4.7%
Cash-on-Cash Return
6.8%
Cap rate
0.9%
Rent to Value Ratio
Active
$144,900
4
bds
|
2
ba
|
0
sqft
|
built
1888
9019 S Exchange Ave, Chicago, IL 60617
$671
Cash flow
24.2%
Cash-on-Cash Return
11.2%
Cap rate
1.4%
Rent to Value Ratio
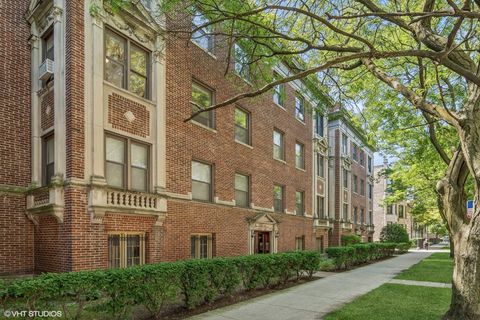
Active
$1,150,000
4
bds
|
3
ba
|
3,132
sqft
|
built
1936
1331 W Granville Ave, Chicago, IL 60660
$-1,836
Cash flow
-8.3%
Cash-on-Cash Return
3.8%
Cap rate
0.6%
Rent to Value Ratio
Active
$315,000
3
bds
|
2
ba
|
1,600
sqft
|
built
1920
1151 E Hyde Park Blvd, Chicago, IL 60615
$-183
Cash flow
-3.0%
Cash-on-Cash Return
5.0%
Cap rate
0.9%
Rent to Value Ratio
Active
$649,000
2
bds
|
2
ba
|
1,376
sqft
|
built
2009
60 E Monroe St, Chicago, IL 60603
$-2,155
Cash flow
-17.3%
Cash-on-Cash Return
1.7%
Cap rate
0.7%
Rent to Value Ratio
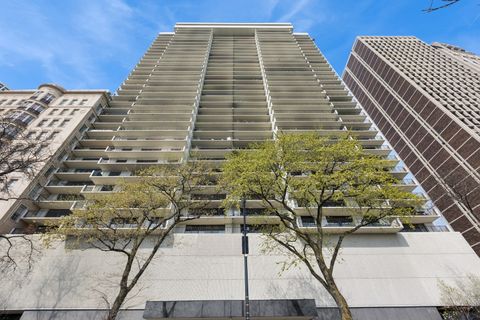
Active
$899,000
2
bds
|
2
ba
|
1,700
sqft
|
built
1970
1212 N Lake Shore Dr, Chicago, IL 60610
$-4,254
Cash flow
-24.7%
Cash-on-Cash Return
n/a
Cap rate
0.5%
Rent to Value Ratio
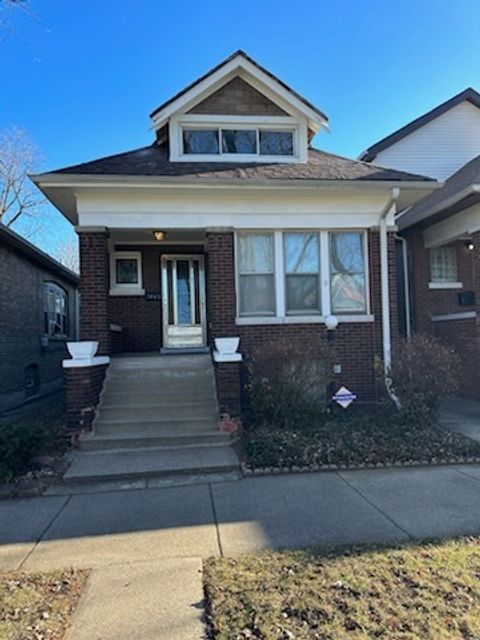
Active
$179,000
3
bds
|
1
ba
|
1,200
sqft
|
built
1918
7443 S Wabash Ave, Chicago, IL 60619
$427
Cash flow
12.4%
Cash-on-Cash Return
8.5%
Cap rate
1.1%
Rent to Value Ratio
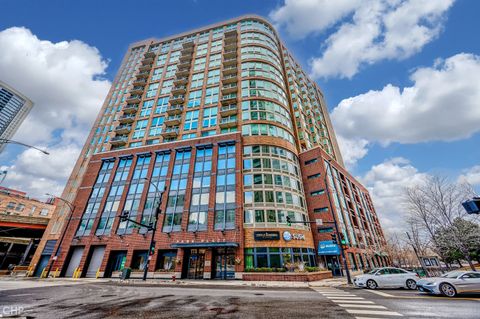
Active
$925,000
3
bds
|
4
ba
|
0
sqft
|
built
2002
600 N Kingsbury St, Chicago, IL 60654
$-9,191
Cash flow
-51.8%
Cash-on-Cash Return
-6.2%
Cap rate
0.3%
Rent to Value Ratio
Active
$349,900
2
bds
|
2
ba
|
2,100
sqft
|
built
1942
5221 S Mayfield Ave, Chicago, IL 60638
$-87
Cash flow
-1.3%
Cash-on-Cash Return
5.4%
Cap rate
0.7%
Rent to Value Ratio
Active
$550,000
3
bds
|
2
ba
|
1,539
sqft
|
built
1905
3829 N Kilbourn Ave, Chicago, IL 60641
$-1,247
Cash flow
-11.8%
Cash-on-Cash Return
3.0%
Cap rate
0.6%
Rent to Value Ratio
Active
$450,000
2
bds
|
2
ba
|
1,464
sqft
|
built
1974
155 N Harbor Dr, Chicago, IL 60601
$-1,486
Cash flow
-17.2%
Cash-on-Cash Return
1.7%
Cap rate
0.9%
Rent to Value Ratio
Active
$110,000
0
bds
|
1
ba
|
500
sqft
|
built
1950
4880 N Marine Dr, Chicago, IL 60640
$-279
Cash flow
-13.2%
Cash-on-Cash Return
2.6%
Cap rate
1.2%
Rent to Value Ratio
Active
$148,900
3
bds
|
2
ba
|
1,230
sqft
|
built
1925
7723 S Honore St, Chicago, IL 60620
$552
Cash flow
19.3%
Cash-on-Cash Return
10.1%
Cap rate
1.3%
Rent to Value Ratio
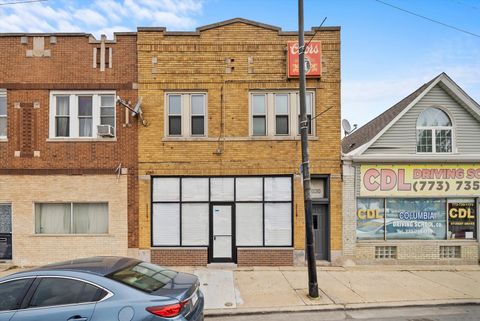
Active
$349,900
2
bds
|
1
ba
|
1,200
sqft
|
built
1918
2675 W Grand Ave, Chicago, IL 60612
$-989
Cash flow
-14.7%
Cash-on-Cash Return
2.3%
Cap rate
0.6%
Rent to Value Ratio
Active
$639,000
3
bds
|
2
ba
|
0
sqft
|
built
1928
5030 S Archer Ave, Chicago, IL 60632
$-1,529
Cash flow
-12.5%
Cash-on-Cash Return
2.8%
Cap rate
0.4%
Rent to Value Ratio
Active
$1,148,000
3
bds
|
3
ba
|
2,157
sqft
|
built
2005
130 N Garland Ct, Chicago, IL 60602
$-5,814
Cash flow
-26.4%
Cash-on-Cash Return
-0.4%
Cap rate
0.4%
Rent to Value Ratio
Active
$195,000
2
bds
|
1
ba
|
0
sqft
|
built
1970
5241 N East River Rd, Chicago, IL 60656
$-122
Cash flow
-3.3%
Cash-on-Cash Return
5.5%
Cap rate
0.9%
Rent to Value Ratio
Active
$253,000
6
bds
|
2
ba
|
0
sqft
|
built
1893
5633 S Ada St, Chicago, IL 60636
$42
Cash flow
0.9%
Cash-on-Cash Return
5.9%
Cap rate
0.8%
Rent to Value Ratio
Active
$440,000
4
bds
|
3
ba
|
0
sqft
|
built
1909
162 N La Crosse Ave, Chicago, IL 60644
$-599
Cash flow
-7.1%
Cash-on-Cash Return
4.0%
Cap rate
0.6%
Rent to Value Ratio
Active
$370,000
4
bds
|
3
ba
|
2,656
sqft
|
built
1924
8022 S Euclid Ave, Chicago, IL 60617
$-720
Cash flow
-10.2%
Cash-on-Cash Return
3.3%
Cap rate
0.5%
Rent to Value Ratio
Active
$899,000
3
bds
|
3
ba
|
2,123
sqft
|
built
1929
758 N Larrabee St, Chicago, IL 60654
$-5,520
Cash flow
-32.0%
Cash-on-Cash Return
-1.7%
Cap rate
0.3%
Rent to Value Ratio

Active
$184,900
2
bds
|
1
ba
|
1,000
sqft
|
built
1953
6118 N Sheridan Rd, Chicago, IL 60660
$-361
Cash flow
-10.2%
Cash-on-Cash Return
3.3%
Cap rate
1.2%
Rent to Value Ratio
Active
$349,999
3
bds
|
3
ba
|
1,800
sqft
|
built
1999
7015 S Indiana Ave, Chicago, IL 60637
$-136
Cash flow
-2.0%
Cash-on-Cash Return
5.2%
Cap rate
0.7%
Rent to Value Ratio
Active
$445,000
2
bds
|
2
ba
|
1,200
sqft
|
built
1974
500 W Superior St, Chicago, IL 60654
$-1,710
Cash flow
-20.0%
Cash-on-Cash Return
1.1%
Cap rate
0.8%
Rent to Value Ratio
Active
$99,900
2
bds
|
1
ba
|
950
sqft
|
built
1901
115 E 60th St, Chicago, IL 60637
$162
Cash flow
8.5%
Cash-on-Cash Return
7.6%
Cap rate
1.4%
Rent to Value Ratio
Active
$345,900
4
bds
|
2
ba
|
3,200
sqft
|
built
1929
9035 S Marshfield Ave, Chicago, IL 60620
$-257
Cash flow
-3.9%
Cash-on-Cash Return
4.8%
Cap rate
0.6%
Rent to Value Ratio
Active
$227,000
1
bds
|
1
ba
|
0
sqft
|
built
2007
1122 W Catalpa Ave, Chicago, IL 60640
$-556
Cash flow
-12.8%
Cash-on-Cash Return
2.7%
Cap rate
0.9%
Rent to Value Ratio
Active
$515,000
1
bds
|
1
ba
|
1,100
sqft
|
built
1968
505 N Lake Shore Dr, Chicago, IL 60611
$-1,614
Cash flow
-16.4%
Cash-on-Cash Return
1.9%
Cap rate
0.6%
Rent to Value Ratio
Active
$350,000
5
bds
|
2
ba
|
0
sqft
|
built
1900
4838 W Fulton St, Chicago, IL 60644
$-332
Cash flow
-4.9%
Cash-on-Cash Return
4.5%
Cap rate
0.7%
Rent to Value Ratio
Active
$112,999
2
bds
|
1
ba
|
1,000
sqft
|
built
1922
5931 S Troy St, Chicago, IL 60629
$263
Cash flow
12.1%
Cash-on-Cash Return
8.5%
Cap rate
1.2%
Rent to Value Ratio

Active
$439,000
3
bds
|
4
ba
|
2,000
sqft
|
built
1959
10639 S Whipple St, Chicago, IL 60655
$-33
Cash flow
-0.4%
Cash-on-Cash Return
5.6%
Cap rate
0.8%
Rent to Value Ratio
Active
$425,000
2
bds
|
2
ba
|
1,500
sqft
|
built
2006
1111 S State St, Chicago, IL 60605
$-1,420
Cash flow
-17.4%
Cash-on-Cash Return
1.7%
Cap rate
0.8%
Rent to Value Ratio
Active
$175,000
3
bds
|
3
ba
|
1,500
sqft
|
built
1908
11722 S Parnell Ave, Chicago, IL 60628
$627
Cash flow
18.7%
Cash-on-Cash Return
10.0%
Cap rate
1.3%
Rent to Value Ratio
Active
$319,900
3
bds
|
4
ba
|
1,800
sqft
|
built
1923
7658 S Lafayette Ave, Chicago, IL 60620
$-204
Cash flow
-3.3%
Cash-on-Cash Return
4.9%
Cap rate
0.7%
Rent to Value Ratio
Active
$769,900
3
bds
|
3
ba
|
2,000
sqft
|
built
1982
400 E Ohio St, Chicago, IL 60611
$-3,243
Cash flow
-22.0%
Cash-on-Cash Return
0.6%
Cap rate
0.7%
Rent to Value Ratio

Active
$675,000
2
bds
|
2
ba
|
1,500
sqft
|
built
1884
1000 W Washington Blvd, Chicago, IL 60607
$-1,943
Cash flow
-15.0%
Cash-on-Cash Return
2.2%
Cap rate
0.7%
Rent to Value Ratio