Chicago, IL Investment Properties for Sale
Browse homes for sale and investment properties in Chicago, IL. Refine your search by price, property type, or more.
Best cash flowing properties in Chicago, IL
Active
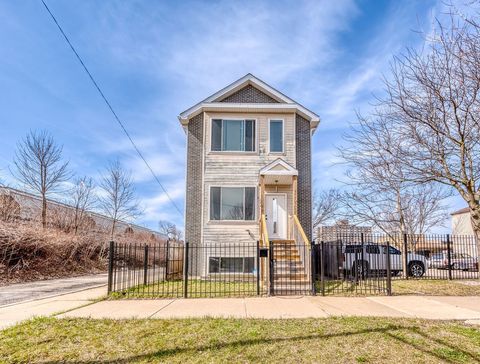
$260,000
4
bds
|
4
ba
|
5,250
sqft
|
built
1951
7735 S Laflin St, Chicago, IL 60620
$911
Cash flow
18.3%
Cash-on-Cash Return
9.9%
Cap rate
1.3%
Rent to Value Ratio
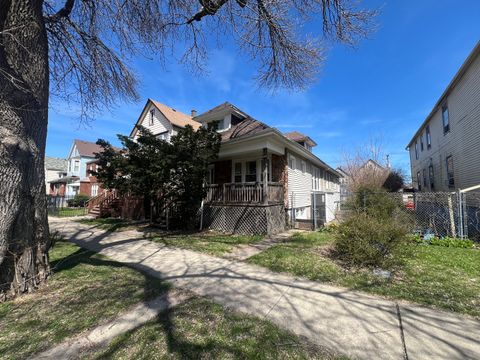
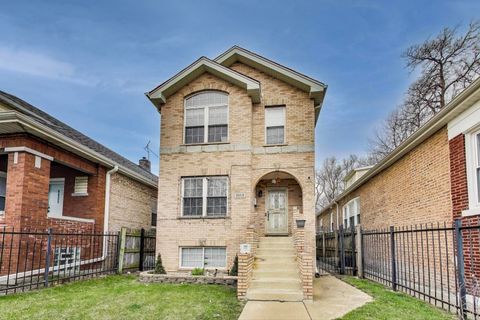
Active
$210,000
3
bds
|
2
ba
|
1,296
sqft
|
built
1924
8639 S Burnham Ave, Chicago, IL 60617
$608
Cash flow
15.1%
Cash-on-Cash Return
9.2%
Cap rate
1.2%
Rent to Value Ratio
3,965 out of 4,608 properties for sale in Chicago, IL
Limited Results Shown
Create a free account, or log in to reveal all property listings and enjoy the complete experience.
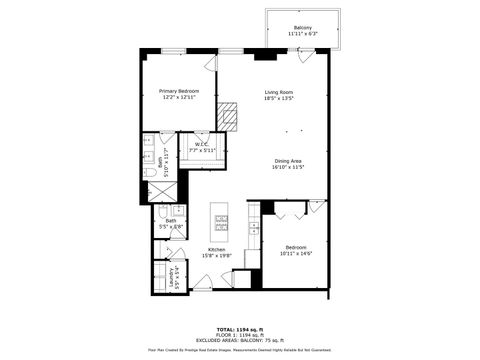
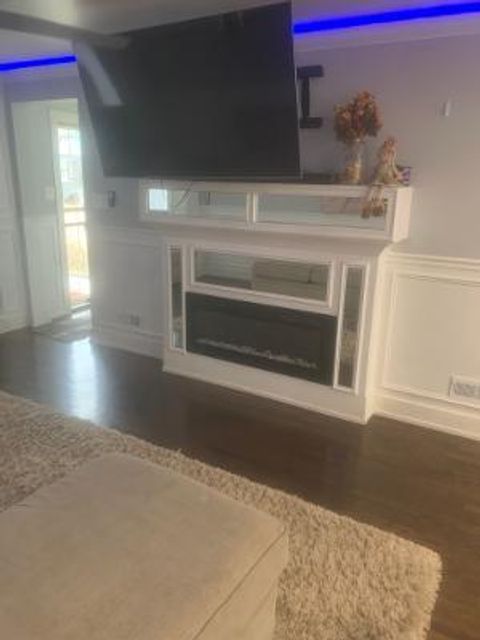
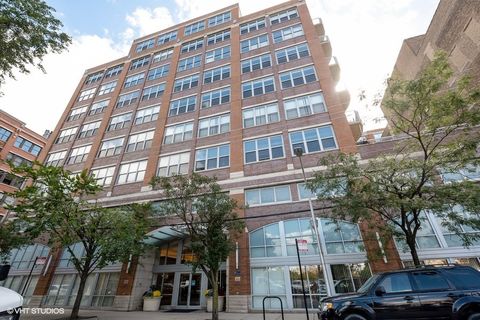
Active
$415,000
2
bds
|
2
ba
|
1,194
sqft
|
built
1910
910 S Michigan Ave, Chicago, IL 60605
$-874
Cash flow
-11.0%
Cash-on-Cash Return
3.2%
Cap rate
0.9%
Rent to Value Ratio

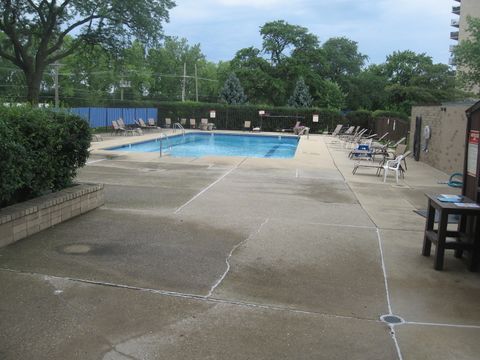
Active
$224,900
bds
|
1
ba
|
500
sqft
|
built
1968
300 N State St, Chicago, IL 60654
$-10
Cash flow
-0.2%
Cash-on-Cash Return
5.6%
Cap rate
1.2%
Rent to Value Ratio
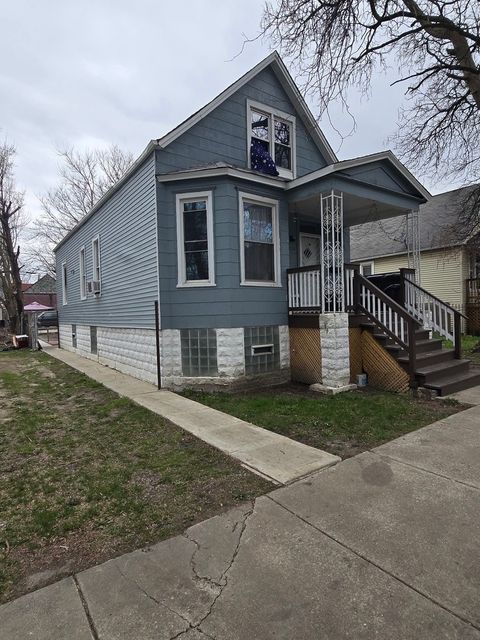
Active
$174,900
4
bds
|
1
ba
|
984
sqft
|
built
1910
6824 S Throop St, Chicago, IL 60636
$276
Cash flow
8.2%
Cash-on-Cash Return
7.6%
Cap rate
0.9%
Rent to Value Ratio
Active
$399,777
3
bds
|
2
ba
|
1,993
sqft
|
built
1929
3507 N Osceola Ave, Chicago, IL 60634
$-71
Cash flow
-0.9%
Cash-on-Cash Return
5.5%
Cap rate
0.8%
Rent to Value Ratio

Active
$155,000
1
bds
|
1
ba
|
750
sqft
|
built
1963
4258 W Lawrence Ave, Chicago, IL 60630
$-252
Cash flow
-8.5%
Cash-on-Cash Return
3.7%
Cap rate
0.9%
Rent to Value Ratio

Active
$360,000
4
bds
|
2
ba
|
0
sqft
|
built
1951
7922 S Ellis Ave, Chicago, IL 60619
$-597
Cash flow
-8.7%
Cash-on-Cash Return
3.7%
Cap rate
0.5%
Rent to Value Ratio
Active
$425,000
2
bds
|
2
ba
|
1,076
sqft
|
built
2002
520 N Halsted St, Chicago, IL 60642
$-1,049
Cash flow
-12.9%
Cash-on-Cash Return
3.3%
Cap rate
0.8%
Rent to Value Ratio

Active
$450,000
4
bds
|
2
ba
|
0
sqft
|
built
1901
3552 W Palmer St, Chicago, IL 60647
$-951
Cash flow
-11.0%
Cash-on-Cash Return
3.7%
Cap rate
0.6%
Rent to Value Ratio
Active
$450,000
2
bds
|
2
ba
|
1,265
sqft
|
built
1991
474 N Lake Shore Dr, Chicago, IL 60611
$-1,647
Cash flow
-19.1%
Cash-on-Cash Return
1.3%
Cap rate
0.8%
Rent to Value Ratio
Active
$162,999
3
bds
|
1
ba
|
1,008
sqft
|
built
1921
12251 S Peoria St, Chicago, IL 60643
$459
Cash flow
14.7%
Cash-on-Cash Return
9.1%
Cap rate
1.2%
Rent to Value Ratio

Active
$750,000
2
bds
|
3
ba
|
1,750
sqft
|
built
1999
1122 N Dearborn St, Chicago, IL 60610
$-2,261
Cash flow
-15.7%
Cash-on-Cash Return
2.1%
Cap rate
0.8%
Rent to Value Ratio
Active
$239,900
4
bds
|
2
ba
|
815
sqft
|
built
1944
12449 S Union Ave, Chicago, IL 60628
$171
Cash flow
3.7%
Cash-on-Cash Return
6.5%
Cap rate
0.8%
Rent to Value Ratio
Active
$820,000
9
bds
|
6
ba
|
0
sqft
|
built
1924
7301 S Constance Ave, Chicago, IL 60649
$-2,350
Cash flow
-15.0%
Cash-on-Cash Return
2.2%
Cap rate
0.3%
Rent to Value Ratio
Active
$200,000
7
bds
|
4
ba
|
7,052
sqft
|
built
1919
645 E 113th St, Chicago, IL 60628
$-31
Cash flow
-0.8%
Cash-on-Cash Return
6.1%
Cap rate
0.9%
Rent to Value Ratio
Active
$210,000
3
bds
|
2
ba
|
1,296
sqft
|
built
1924
8639 S Burnham Ave, Chicago, IL 60617
$608
Cash flow
15.1%
Cash-on-Cash Return
9.2%
Cap rate
1.2%
Rent to Value Ratio
Active
$629,900
6
bds
|
3
ba
|
0
sqft
|
built
1890
2625 W Cullerton St, Chicago, IL 60608
$-1,777
Cash flow
-14.7%
Cash-on-Cash Return
2.3%
Cap rate
0.3%
Rent to Value Ratio
Active
$399,000
9
bds
|
3
ba
|
0
sqft
|
built
1920
7927 S Langley Ave, Chicago, IL 60619
$-441
Cash flow
-5.8%
Cash-on-Cash Return
4.4%
Cap rate
0.6%
Rent to Value Ratio

Active
$265,000
6
bds
|
3
ba
|
0
sqft
|
built
1908
7038 S Vernon Ave, Chicago, IL 60637
$53
Cash flow
1.0%
Cash-on-Cash Return
5.9%
Cap rate
0.8%
Rent to Value Ratio
Active
$525,000
3
bds
|
3
ba
|
2,300
sqft
|
built
1999
3801 N Milwaukee Ave, Chicago, IL 60641
$-1,144
Cash flow
-11.4%
Cash-on-Cash Return
3.1%
Cap rate
0.7%
Rent to Value Ratio
Active
$390,000
5
bds
|
3
ba
|
2,200
sqft
|
built
1898
2322 W 35th Pl, Chicago, IL 60609
$-338
Cash flow
-4.5%
Cash-on-Cash Return
4.6%
Cap rate
0.7%
Rent to Value Ratio
Active
$965,000
4
bds
|
4
ba
|
2,700
sqft
|
built
2015
2823 N Oakley Ave, Chicago, IL 60618
$-2,472
Cash flow
-13.4%
Cash-on-Cash Return
2.6%
Cap rate
0.5%
Rent to Value Ratio

Active
$189,500
5
bds
|
2
ba
|
0
sqft
|
built
1913
5545 S Throop St, Chicago, IL 60636
$128
Cash flow
3.5%
Cash-on-Cash Return
6.5%
Cap rate
0.8%
Rent to Value Ratio
Active
$825,000
9
bds
|
4
ba
|
0
sqft
|
built
1908
5015 N Kimberly Ave, Chicago, IL 60630
$-2,468
Cash flow
-15.6%
Cash-on-Cash Return
2.1%
Cap rate
0.4%
Rent to Value Ratio
Active
$285,000
2
bds
|
1
ba
|
2,825
sqft
|
built
1888
2816 S Loomis St, Chicago, IL 60608
$224
Cash flow
4.1%
Cash-on-Cash Return
6.6%
Cap rate
0.9%
Rent to Value Ratio
Active
$480,000
3
bds
|
4
ba
|
3,250
sqft
|
built
2018
400 N Trumbull Ave, Chicago, IL 60624
$16
Cash flow
0.2%
Cash-on-Cash Return
5.7%
Cap rate
0.9%
Rent to Value Ratio
Active
$339,000
3
bds
|
4
ba
|
2,143
sqft
|
built
2004
8618 S Morgan St, Chicago, IL 60620
$224
Cash flow
3.4%
Cash-on-Cash Return
6.5%
Cap rate
0.9%
Rent to Value Ratio
Active
$134,900
1
bds
|
1
ba
|
900
sqft
|
built
1968
6833 N Kedzie Ave, Chicago, IL 60645
$-345
Cash flow
-13.3%
Cash-on-Cash Return
2.6%
Cap rate
1.2%
Rent to Value Ratio
Active
$300,000
1
bds
|
1
ba
|
810
sqft
|
built
2003
933 W Van Buren St, Chicago, IL 60607
$-491
Cash flow
-8.5%
Cash-on-Cash Return
3.7%
Cap rate
0.8%
Rent to Value Ratio
Active
$260,000
4
bds
|
4
ba
|
5,250
sqft
|
built
1951
7735 S Laflin St, Chicago, IL 60620
$911
Cash flow
18.3%
Cash-on-Cash Return
9.9%
Cap rate
1.3%
Rent to Value Ratio
Active
$205,000
2
bds
|
1
ba
|
900
sqft
|
built
1964
345 E Eastgate Pl, Chicago, IL 60616
$-312
Cash flow
-7.9%
Cash-on-Cash Return
3.9%
Cap rate
1.0%
Rent to Value Ratio
Active
$897,747
3
bds
|
3
ba
|
2,524
sqft
|
built
1985
161 E Chicago Ave, Chicago, IL 60611
$-4,317
Cash flow
-25.1%
Cash-on-Cash Return
-0.1%
Cap rate
0.6%
Rent to Value Ratio

Active
$449,000
1
bds
|
2
ba
|
1,025
sqft
|
built
2007
240 E Illinois St, Chicago, IL 60611
$-1,329
Cash flow
-15.4%
Cash-on-Cash Return
2.1%
Cap rate
0.8%
Rent to Value Ratio
Active
$544,000
2
bds
|
2
ba
|
1,200
sqft
|
built
2001
345 N La Salle Dr, Chicago, IL 60654
$-1,348
Cash flow
-12.9%
Cash-on-Cash Return
2.7%
Cap rate
0.7%
Rent to Value Ratio

Active
$1,397,747
3
bds
|
3
ba
|
2,550
sqft
|
built
2008
110 W Superior St, Chicago, IL 60654
$-8,333
Cash flow
-31.1%
Cash-on-Cash Return
-1.5%
Cap rate
0.3%
Rent to Value Ratio
Active
$379,900
2
bds
|
2
ba
|
1,300
sqft
|
built
2002
1345 W Fillmore St, Chicago, IL 60607
$-487
Cash flow
-6.7%
Cash-on-Cash Return
4.1%
Cap rate
0.7%
Rent to Value Ratio
Active
$335,000
2
bds
|
2
ba
|
1,200
sqft
|
built
2005
4235 N Kedzie Ave, Chicago, IL 60618
$-1,024
Cash flow
-15.9%
Cash-on-Cash Return
2.6%
Cap rate
0.7%
Rent to Value Ratio

Active
$1,150,000
3
bds
|
5
ba
|
3,600
sqft
|
built
1989
455 W 38th St, Chicago, IL 60609
$-4,439
Cash flow
-20.1%
Cash-on-Cash Return
1.0%
Cap rate
0.3%
Rent to Value Ratio

Active
$420,000
2
bds
|
2
ba
|
0
sqft
|
built
2008
565 W Quincy St, Chicago, IL 60661
$-1,129
Cash flow
-14.0%
Cash-on-Cash Return
2.5%
Cap rate
0.8%
Rent to Value Ratio

Active
$289,000
2
bds
|
2
ba
|
0
sqft
|
built
1960
5355 S Tripp Ave, Chicago, IL 60632
$45
Cash flow
0.8%
Cash-on-Cash Return
5.9%
Cap rate
0.8%
Rent to Value Ratio
Active
$735,000
4
bds
|
4
ba
|
2,820
sqft
|
built
1926
7324 W Lunt Ave, Chicago, IL 60631
$-1,332
Cash flow
-9.5%
Cash-on-Cash Return
3.5%
Cap rate
0.6%
Rent to Value Ratio