Chicago, IL Investment Properties for Sale
Browse homes for sale and investment properties in Chicago, IL. Refine your search by price, property type, or more.
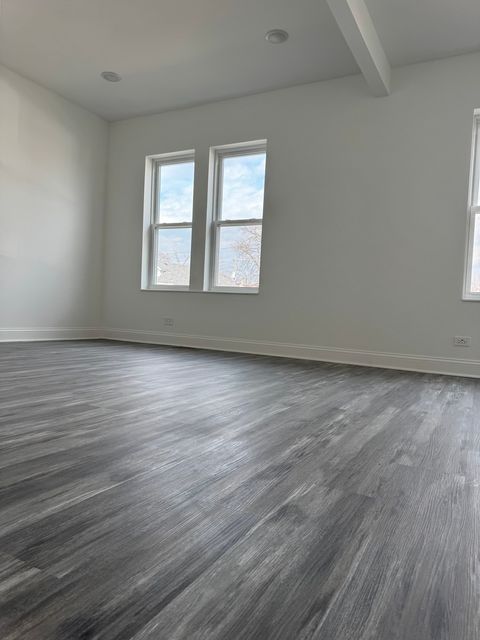
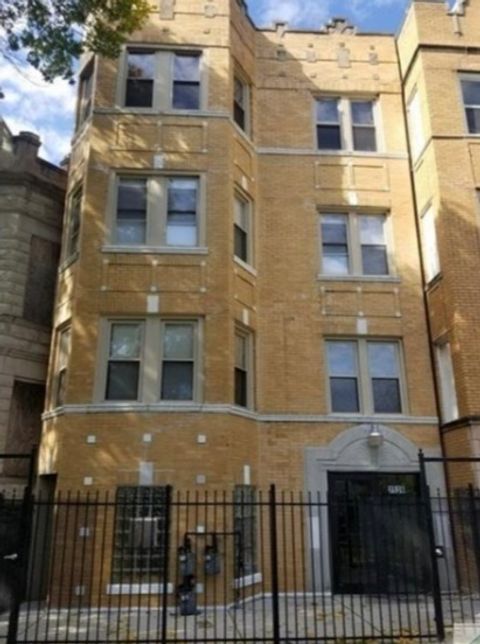
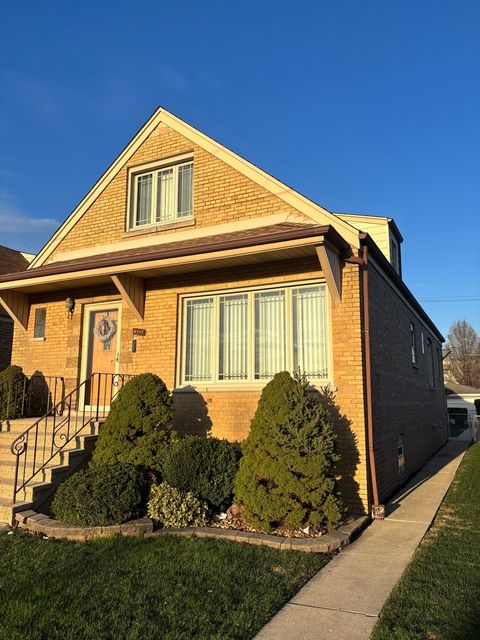
Best cash flowing properties in Chicago, IL
Active
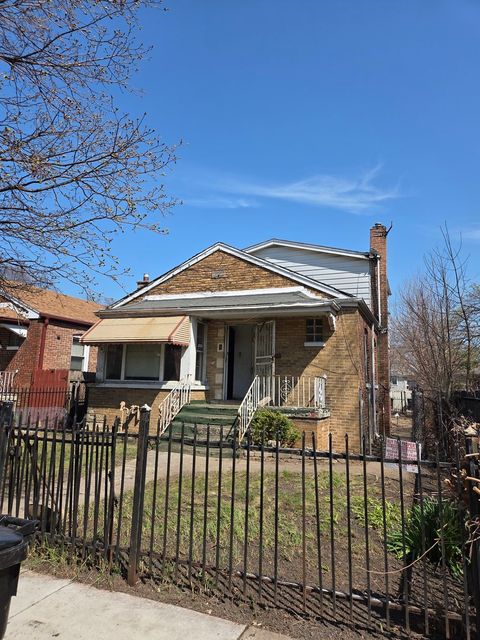
$68,500
5
bds
|
2
ba
|
1,750
sqft
|
built
1918
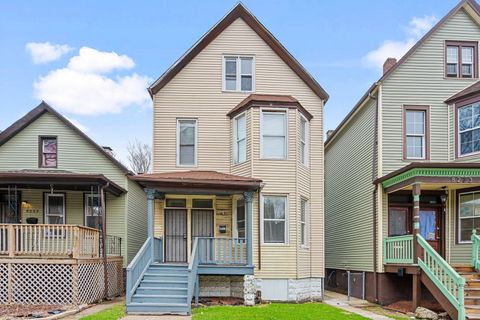
10511 S Yates Ave, Chicago, IL 60617
$989
Cash flow
16.8%
Cash-on-Cash Return
17.3%
Cap rate
2.3%
Rent to Value Ratio
Active
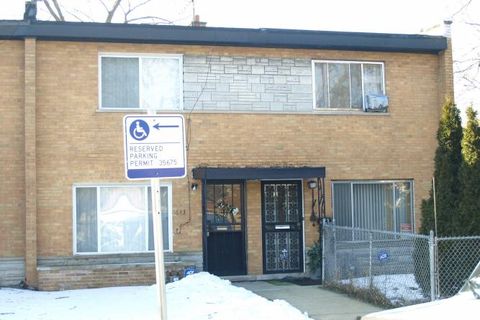
$80,000
2
bds
|
1
ba
|
1,169
sqft
|
built
1965
643 W 80th St, Chicago, IL 60620
$766
Cash flow
50.0%
Cash-on-Cash Return
17.2%
Cap rate
2.3%
Rent to Value Ratio
3,972 out of 4,615 properties for sale in Chicago, IL
Limited Results Shown
Create a free account, or log in to reveal all property listings and enjoy the complete experience.
Active
$409,999
2
bds
|
2
ba
|
1,201
sqft
|
built
1997
2317 W Wolfram St, Chicago, IL 60618
$-973
Cash flow
-12.4%
Cash-on-Cash Return
2.8%
Cap rate
0.8%
Rent to Value Ratio

Active
$740,000
2
bds
|
1
ba
|
1,485
sqft
|
built
1928
73 E Elm St, Chicago, IL 60611
$-3,578
Cash flow
-25.2%
Cash-on-Cash Return
-0.1%
Cap rate
0.4%
Rent to Value Ratio
Active
$329,000
2
bds
|
2
ba
|
0
sqft
|
built
1973
655 W Irving Park Rd, Chicago, IL 60613
$-847
Cash flow
-13.4%
Cash-on-Cash Return
2.6%
Cap rate
0.9%
Rent to Value Ratio
Active
$240,000
3
bds
|
2
ba
|
1,200
sqft
|
built
1963
8823 S Wallace St, Chicago, IL 60620
$294
Cash flow
6.4%
Cash-on-Cash Return
7.1%
Cap rate
0.9%
Rent to Value Ratio

Active
$340,000
5
bds
|
2
ba
|
0
sqft
|
built
1906
8622 S Wood St, Chicago, IL 60620
$-854
Cash flow
-13.1%
Cash-on-Cash Return
2.7%
Cap rate
0.4%
Rent to Value Ratio

Active
$1,250,000
9
bds
|
3
ba
|
0
sqft
|
built
1898
1022 N Rockwell St, Chicago, IL 60622
$-5,127
Cash flow
-21.4%
Cash-on-Cash Return
0.8%
Cap rate
0.2%
Rent to Value Ratio
Active
$229,999
3
bds
|
2
ba
|
0
sqft
|
built
1921
6756 S Oglesby Ave, Chicago, IL 60649
$-701
Cash flow
-15.9%
Cash-on-Cash Return
2.0%
Cap rate
0.7%
Rent to Value Ratio
Active
$215,000
3
bds
|
2
ba
|
1,568
sqft
|
built
2006
6835 S Cornell Ave, Chicago, IL 60649
$-391
Cash flow
-9.5%
Cash-on-Cash Return
3.5%
Cap rate
0.8%
Rent to Value Ratio
Active
$380,000
10
bds
|
3
ba
|
0
sqft
|
built
1906
1842 S Drake Ave, Chicago, IL 60623
$-837
Cash flow
-11.5%
Cash-on-Cash Return
3.0%
Cap rate
0.4%
Rent to Value Ratio
Active
$250,000
4
bds
|
2
ba
|
0
sqft
|
built
1913
8231 S Coles Ave, Chicago, IL 60617
$-272
Cash flow
-5.7%
Cash-on-Cash Return
4.4%
Cap rate
0.6%
Rent to Value Ratio
Active
$300,000
8
bds
|
2
ba
|
0
sqft
|
built
1898
4107 W 16th St, Chicago, IL 60623
$-787
Cash flow
-13.7%
Cash-on-Cash Return
2.5%
Cap rate
0.5%
Rent to Value Ratio
Active
$221,500
2
bds
|
2
ba
|
1,200
sqft
|
built
2006
3817 S Ellis Ave, Chicago, IL 60653
$-386
Cash flow
-9.1%
Cash-on-Cash Return
3.6%
Cap rate
0.9%
Rent to Value Ratio
Active
$695,000
7
bds
|
3
ba
|
0
sqft
|
built
1890
1437 W Augusta Blvd, Chicago, IL 60642
$-1,967
Cash flow
-14.8%
Cash-on-Cash Return
2.3%
Cap rate
0.5%
Rent to Value Ratio

Active
$1,150,000
2
bds
|
3
ba
|
2,000
sqft
|
built
2003
250 E Pearson St, Chicago, IL 60611
$-4,176
Cash flow
-18.9%
Cash-on-Cash Return
1.3%
Cap rate
0.5%
Rent to Value Ratio
Active
$1,795,000
3
bds
|
4
ba
|
3,050
sqft
|
built
1964
1040 N Lake Shore Dr, Chicago, IL 60611
$-7,180
Cash flow
-20.9%
Cash-on-Cash Return
0.9%
Cap rate
0.5%
Rent to Value Ratio
Active
$270,000
1
bds
|
1
ba
|
0
sqft
|
built
1987
3660 N Lake Shore Dr, Chicago, IL 60613
$-747
Cash flow
-14.4%
Cash-on-Cash Return
2.4%
Cap rate
0.7%
Rent to Value Ratio
Active
$288,000
2
bds
|
2
ba
|
0
sqft
|
built
8 W Monroe St, Chicago, IL 60603
$-972
Cash flow
-17.6%
Cash-on-Cash Return
1.6%
Cap rate
1.0%
Rent to Value Ratio
Active
$470,000
3
bds
|
5
ba
|
3,912
sqft
|
built
1920
7711 S Ridgeland Ave, Chicago, IL 60649
$-1,526
Cash flow
-16.9%
Cash-on-Cash Return
2.4%
Cap rate
0.3%
Rent to Value Ratio
Active
$419,000
2
bds
|
3
ba
|
1,600
sqft
|
built
1981
110 E Delaware Pl, Chicago, IL 60611
$-2,533
Cash flow
-31.5%
Cash-on-Cash Return
-1.6%
Cap rate
0.9%
Rent to Value Ratio
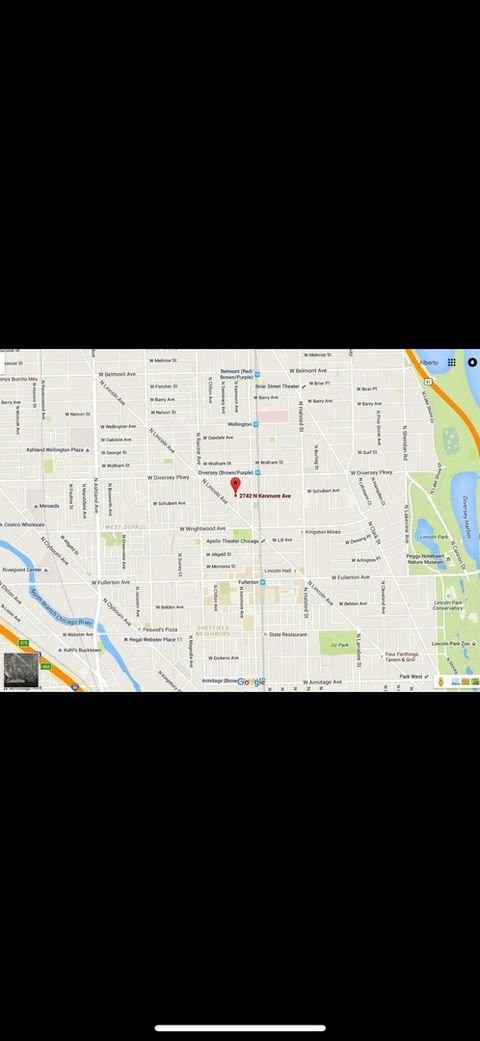
Active
$1,270,000
4
bds
|
4
ba
|
0
sqft
|
built
1889
2742 N Kenmore Ave, Chicago, IL 60614
$-4,062
Cash flow
-16.7%
Cash-on-Cash Return
1.8%
Cap rate
0.4%
Rent to Value Ratio
Active
$225,000
1
bds
|
1
ba
|
1,000
sqft
|
built
1980
899 S Plymouth Ct, Chicago, IL 60605
$-623
Cash flow
-14.4%
Cash-on-Cash Return
2.4%
Cap rate
1.0%
Rent to Value Ratio
Active
$310,000
1
bds
|
1
ba
|
0
sqft
|
built
2007
2335 W Belle Plaine Ave, Chicago, IL 60618
$-696
Cash flow
-11.7%
Cash-on-Cash Return
3.0%
Cap rate
0.6%
Rent to Value Ratio
Active
$450,000
2
bds
|
2
ba
|
1,361
sqft
|
built
2003
33 W Ontario St, Chicago, IL 60654
$-1,687
Cash flow
-19.6%
Cash-on-Cash Return
1.2%
Cap rate
0.8%
Rent to Value Ratio

Active
$169,900
1
bds
|
1
ba
|
750
sqft
|
built
1951
6030 N Sheridan Rd, Chicago, IL 60660
$-388
Cash flow
-11.9%
Cash-on-Cash Return
2.9%
Cap rate
0.9%
Rent to Value Ratio

Active
$169,900
1
bds
|
1
ba
|
0
sqft
|
built
1968
5915 W Gunnison St, Chicago, IL 60630
$45
Cash flow
1.4%
Cash-on-Cash Return
6.0%
Cap rate
1.0%
Rent to Value Ratio
Active
$240,000
1
bds
|
1
ba
|
755
sqft
|
built
1991
200 N Dearborn St, Chicago, IL 60601
$-617
Cash flow
-13.4%
Cash-on-Cash Return
2.6%
Cap rate
0.9%
Rent to Value Ratio
Active
$349,900
4
bds
|
3
ba
|
0
sqft
|
built
1906
942 N Hamlin Ave, Chicago, IL 60651
$-564
Cash flow
-8.4%
Cash-on-Cash Return
3.7%
Cap rate
0.6%
Rent to Value Ratio
Active
$430,000
8
bds
|
4
ba
|
0
sqft
|
built
1905
5729 S Michigan Ave, Chicago, IL 60637
$-971
Cash flow
-11.8%
Cash-on-Cash Return
3.0%
Cap rate
0.5%
Rent to Value Ratio
Active
$68,500
5
bds
|
2
ba
|
1,750
sqft
|
built
1918
10511 S Yates Ave, Chicago, IL 60617
$989
Cash flow
16.8%
Cash-on-Cash Return
17.3%
Cap rate
2.3%
Rent to Value Ratio
Active
$169,900
bds
|
1
ba
|
0
sqft
|
built
1980
899 S Plymouth Ct, Chicago, IL 60605
$-441
Cash flow
-13.5%
Cash-on-Cash Return
2.6%
Cap rate
1.0%
Rent to Value Ratio
Active
$234,900
3
bds
|
3
ba
|
2,600
sqft
|
built
1929
6901 S Oglesby Ave, Chicago, IL 60649
$32
Cash flow
0.7%
Cash-on-Cash Return
5.8%
Cap rate
1.5%
Rent to Value Ratio
Active
$685,000
3
bds
|
2
ba
|
0
sqft
|
built
1904
848 N Ashland Ave, Chicago, IL 60622
$-1,873
Cash flow
-14.3%
Cash-on-Cash Return
2.4%
Cap rate
0.5%
Rent to Value Ratio
Active
$1,295,000
3
bds
|
3
ba
|
2,400
sqft
|
built
2017
1625 N Burling St, Chicago, IL 60614
$-2,335
Cash flow
-9.4%
Cash-on-Cash Return
3.5%
Cap rate
0.6%
Rent to Value Ratio

Active
$295,000
3
bds
|
2
ba
|
2,210
sqft
|
built
1946
8816 S Constance Ave, Chicago, IL 60617
$274
Cash flow
4.8%
Cash-on-Cash Return
6.8%
Cap rate
0.9%
Rent to Value Ratio
Active
$344,900
4
bds
|
3
ba
|
2,200
sqft
|
built
1924
8848 S Bishop St, Chicago, IL 60620
$-516
Cash flow
-7.8%
Cash-on-Cash Return
3.9%
Cap rate
0.5%
Rent to Value Ratio
Active
$80,000
2
bds
|
1
ba
|
1,169
sqft
|
built
1965
643 W 80th St, Chicago, IL 60620
$766
Cash flow
50.0%
Cash-on-Cash Return
17.2%
Cap rate
2.3%
Rent to Value Ratio
Active
$759,000
14
bds
|
8
ba
|
0
sqft
|
built
1928
1516 S Christiana Ave, Chicago, IL 60623
$-2,728
Cash flow
-18.8%
Cash-on-Cash Return
1.4%
Cap rate
0.2%
Rent to Value Ratio

Active
$264,900
2
bds
|
2
ba
|
0
sqft
|
built
1966
5601 N Sheridan Rd, Chicago, IL 60660
$-831
Cash flow
-16.4%
Cash-on-Cash Return
1.9%
Cap rate
1.1%
Rent to Value Ratio
Active
$350,000
3
bds
|
2
ba
|
1,123
sqft
|
built
1956
6213 S Austin Ave, Chicago, IL 60638
$39
Cash flow
0.6%
Cash-on-Cash Return
5.8%
Cap rate
0.8%
Rent to Value Ratio
Active
$434,900
3
bds
|
2
ba
|
2,000
sqft
|
built
1924
5832 N Sacramento Ave, Chicago, IL 60659
$-624
Cash flow
-7.5%
Cash-on-Cash Return
4.0%
Cap rate
0.7%
Rent to Value Ratio