Chicago, IL Investment Properties for Sale
Browse homes for sale and investment properties in Chicago, IL. Refine your search by price, property type, or more.
Best cash flowing properties in Chicago, IL
Active
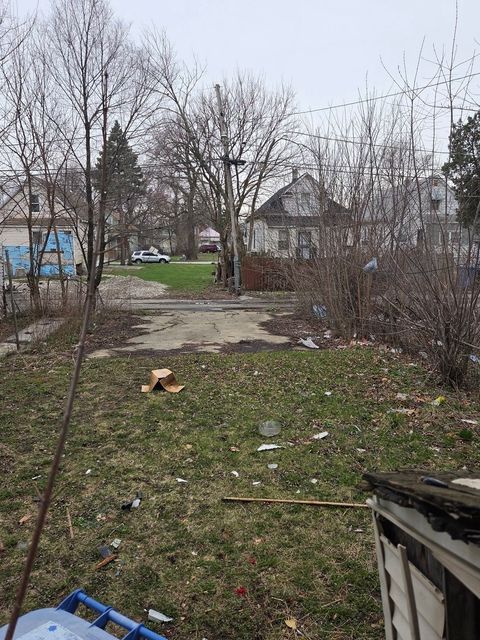
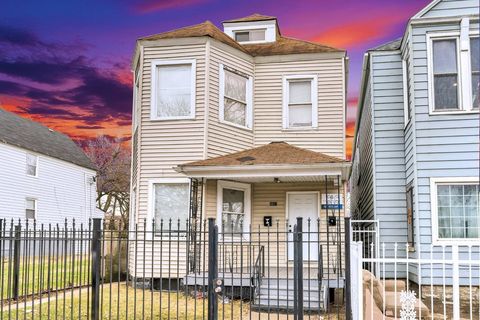
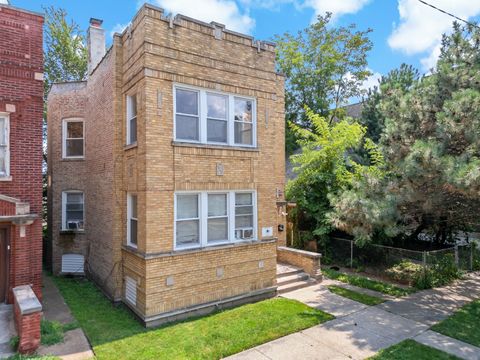
$47,500
5
bds
|
2
ba
|
1,400
sqft
|
built
1913
10514 S Perry Ave, Chicago, IL 60628
$1,125
Cash flow
27.6%
Cash-on-Cash Return
28.4%
Cap rate
3.6%
Rent to Value Ratio
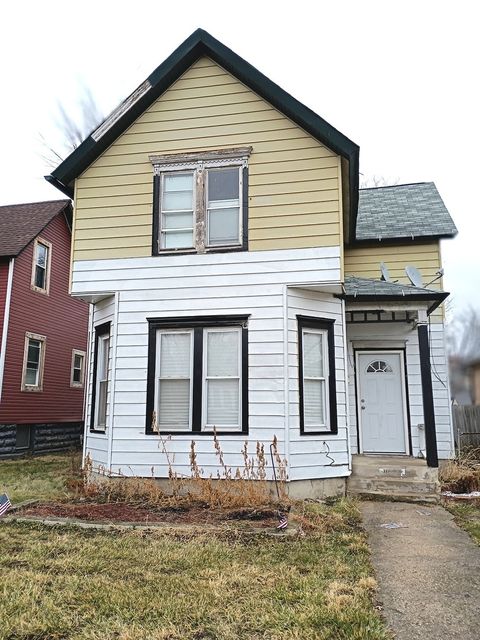
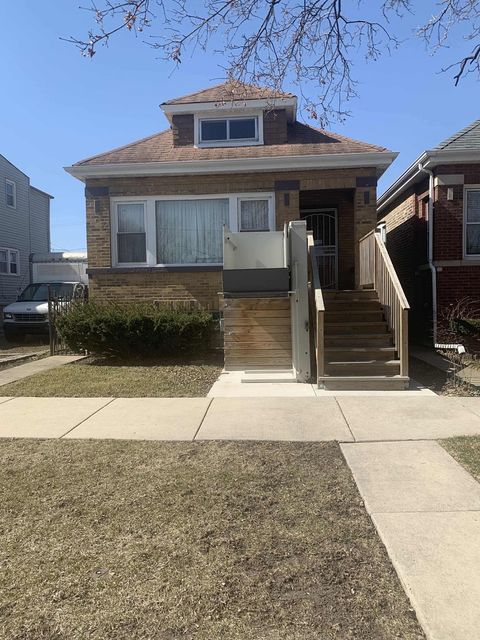
Active
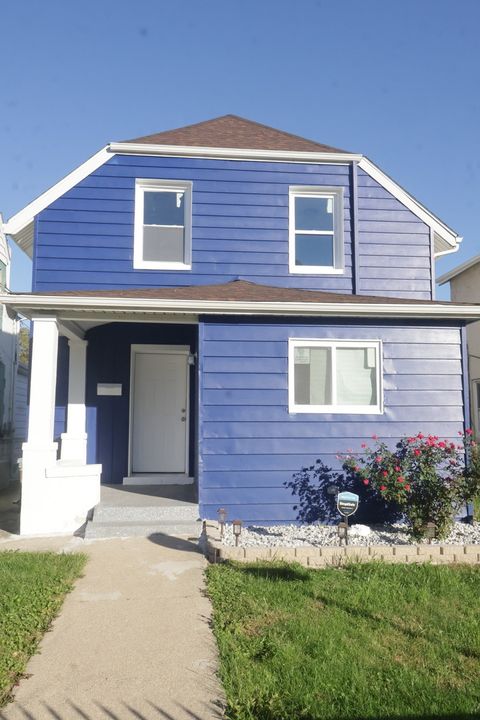
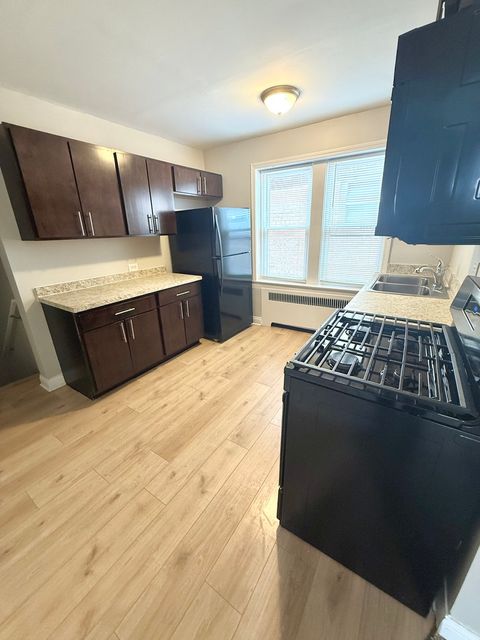
$109,000
3
bds
|
2
ba
|
1,100
sqft
|
built
1877
10217 S Lowe Ave, Chicago, IL 60628
$652
Cash flow
31.2%
Cash-on-Cash Return
12.9%
Cap rate
1.7%
Rent to Value Ratio
3,965 out of 4,608 properties for sale in Chicago, IL
Limited Results Shown
Create a free account, or log in to reveal all property listings and enjoy the complete experience.

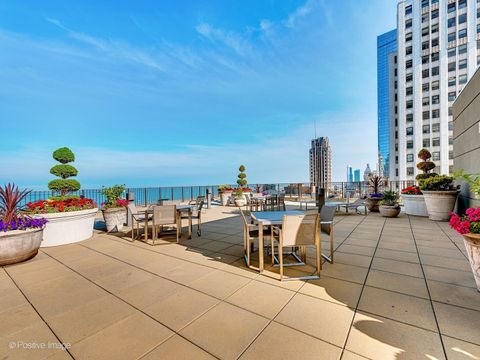
Active
$4,195,000
7
bds
|
6
ba
|
6,400
sqft
|
built
2019
4435 N Hamilton Ave, Chicago, IL 60625
$-16,205
Cash flow
-20.2%
Cash-on-Cash Return
1.0%
Cap rate
0.2%
Rent to Value Ratio
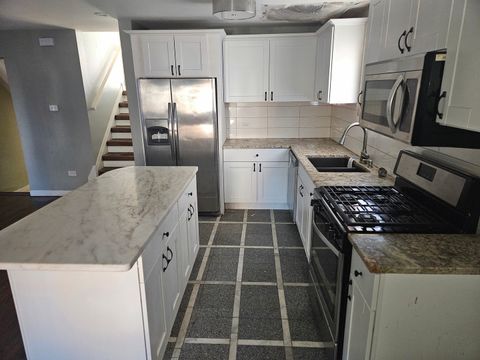
Active
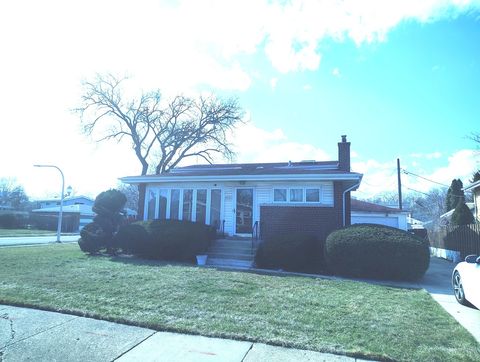
$150,000
5
bds
|
2
ba
|
1,548
sqft
|
built
1976
6732 S Peoria St, Chicago, IL 60621
$521
Cash flow
18.1%
Cash-on-Cash Return
9.8%
Cap rate
1.3%
Rent to Value Ratio
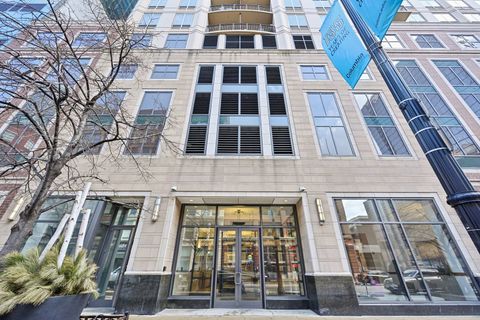
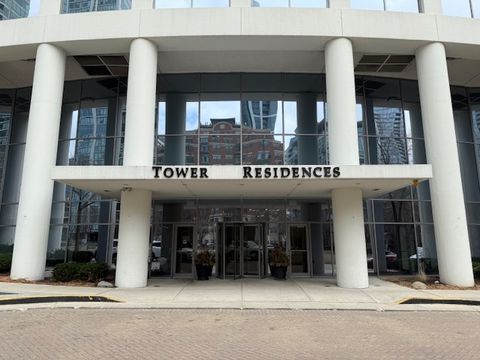
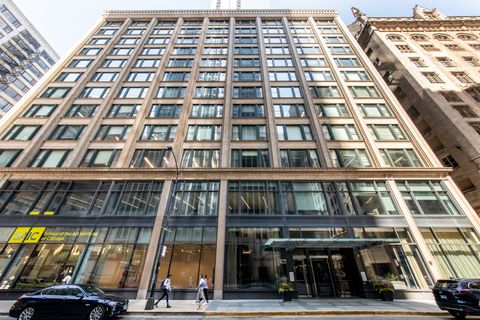
Active
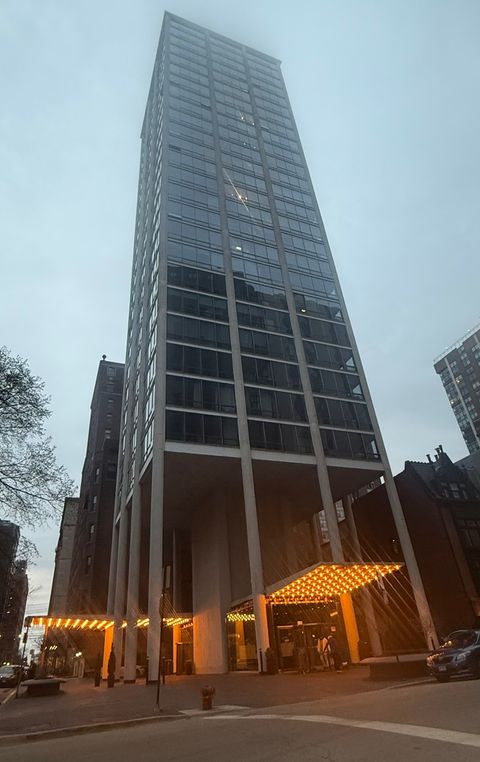
$1,150,000
3
bds
|
3
ba
|
2,096
sqft
|
built
2005
130 N Garland Ct, Chicago, IL 60602
$-5,574
Cash flow
-25.3%
Cash-on-Cash Return
-0.1%
Cap rate
0.4%
Rent to Value Ratio
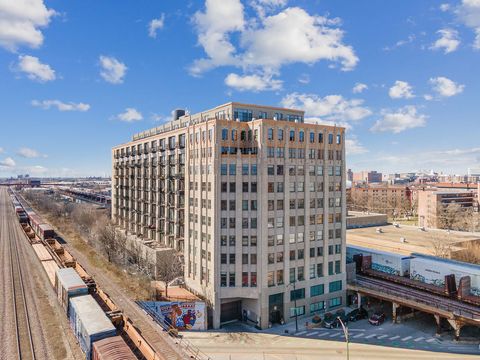
Active
$395,000
2
bds
|
2
ba
|
1,177
sqft
|
built
2004
1111 S Wabash Ave, Chicago, IL 60605
$-791
Cash flow
-10.4%
Cash-on-Cash Return
3.3%
Cap rate
0.8%
Rent to Value Ratio
Active
$365,000
1
bds
|
1
ba
|
1,000
sqft
|
built
1907
1000 W Washington Blvd, Chicago, IL 60607
$-939
Cash flow
-13.4%
Cash-on-Cash Return
2.6%
Cap rate
0.8%
Rent to Value Ratio
Active
$488,000
3
bds
|
2
ba
|
1,916
sqft
|
built
1954
921 W 35th Pl, Chicago, IL 60609
$-784
Cash flow
-8.4%
Cash-on-Cash Return
3.8%
Cap rate
0.7%
Rent to Value Ratio
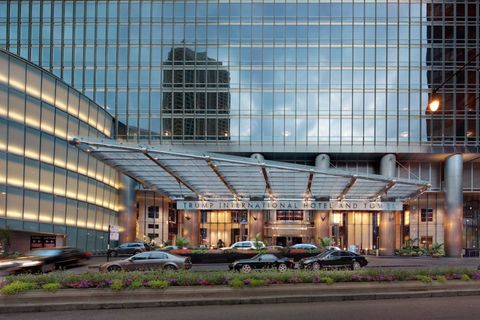
Active
$1,874,947
2
bds
|
3
ba
|
2,100
sqft
|
built
2008
401 N Wabash Ave, Chicago, IL 60611
$-7,311
Cash flow
-20.3%
Cash-on-Cash Return
1.0%
Cap rate
0.4%
Rent to Value Ratio

Active
$290,000
3
bds
|
2
ba
|
2,400
sqft
|
built
1888
3833 S Giles Ave, Chicago, IL 60653
$-277
Cash flow
-5.0%
Cash-on-Cash Return
4.5%
Cap rate
0.8%
Rent to Value Ratio
Active
$194,900
5
bds
|
2
ba
|
0
sqft
|
built
1903
3011 E 80th St, Chicago, IL 60617
$74
Cash flow
2.0%
Cash-on-Cash Return
6.1%
Cap rate
0.9%
Rent to Value Ratio
Active
$220,000
1
bds
|
2
ba
|
970
sqft
|
built
1926
6942 S Bell Ave, Chicago, IL 60636
$327
Cash flow
7.8%
Cash-on-Cash Return
7.5%
Cap rate
0.9%
Rent to Value Ratio
Active
$109,000
3
bds
|
2
ba
|
1,100
sqft
|
built
1877
10217 S Lowe Ave, Chicago, IL 60628
$652
Cash flow
31.2%
Cash-on-Cash Return
12.9%
Cap rate
1.7%
Rent to Value Ratio
Active
$659,000
2
bds
|
2
ba
|
1,335
sqft
|
built
2006
1235 S Prairie Ave, Chicago, IL 60605
$-2,970
Cash flow
-23.5%
Cash-on-Cash Return
0.3%
Cap rate
0.4%
Rent to Value Ratio
Active
$270,000
2
bds
|
2
ba
|
0
sqft
|
built
1928
1550 S Blue Island Ave, Chicago, IL 60608
$-582
Cash flow
-11.2%
Cash-on-Cash Return
3.1%
Cap rate
0.9%
Rent to Value Ratio

Active
$299,000
2
bds
|
2
ba
|
1,250
sqft
|
built
1965
6150 N Kenmore Ave, Chicago, IL 60660
$-1,186
Cash flow
-20.7%
Cash-on-Cash Return
0.9%
Cap rate
0.7%
Rent to Value Ratio
Active
$675,000
2
bds
|
2
ba
|
1,473
sqft
|
built
2010
60 E Monroe St, Chicago, IL 60603
$-2,600
Cash flow
-20.1%
Cash-on-Cash Return
1.1%
Cap rate
0.7%
Rent to Value Ratio
Active
$109,000
2
bds
|
1
ba
|
750
sqft
|
built
1890
3921 W Huron St, Chicago, IL 60624
$47
Cash flow
2.2%
Cash-on-Cash Return
6.2%
Cap rate
1.2%
Rent to Value Ratio

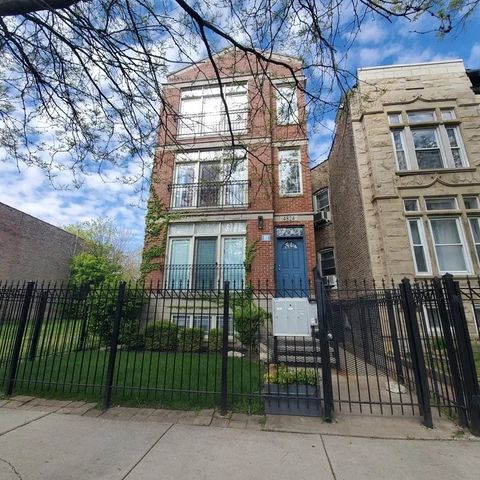
Active
$299,000
5
bds
|
4
ba
|
2,874
sqft
|
built
1928
8358 S Sangamon St, Chicago, IL 60620
$271
Cash flow
4.7%
Cash-on-Cash Return
6.8%
Cap rate
0.9%
Rent to Value Ratio
Active
$949,990
10
bds
|
7
ba
|
0
sqft
|
built
2006
4824 S Evans Ave, Chicago, IL 60615
$-3,321
Cash flow
-18.2%
Cash-on-Cash Return
1.5%
Cap rate
0.3%
Rent to Value Ratio
Active
$173,000
3
bds
|
1
ba
|
1,327
sqft
|
built
1916
11217 S Eggleston Ave, Chicago, IL 60628
$361
Cash flow
10.9%
Cash-on-Cash Return
8.2%
Cap rate
1.0%
Rent to Value Ratio
Active
$399,000
2
bds
|
2
ba
|
0
sqft
|
built
2005
233 E 13th St, Chicago, IL 60605
$-1,097
Cash flow
-14.3%
Cash-on-Cash Return
2.4%
Cap rate
0.7%
Rent to Value Ratio
Active
$296,500
4
bds
|
2
ba
|
1,440
sqft
|
built
1918
7643 S Paxton Ave, Chicago, IL 60649
$100
Cash flow
1.8%
Cash-on-Cash Return
6.1%
Cap rate
0.8%
Rent to Value Ratio
Active
$325,000
1
bds
|
1
ba
|
860
sqft
|
built
2000
330 N Jefferson St, Chicago, IL 60661
$-1,063
Cash flow
-17.1%
Cash-on-Cash Return
1.8%
Cap rate
0.9%
Rent to Value Ratio
Active
$225,000
4
bds
|
2
ba
|
1,100
sqft
|
built
1971
6913 S Woodlawn Ave, Chicago, IL 60637
$4
Cash flow
0.1%
Cash-on-Cash Return
5.7%
Cap rate
0.8%
Rent to Value Ratio
Active
$283,000
1
bds
|
1
ba
|
840
sqft
|
built
1962
1300 N Astor St, Chicago, IL 60610
$-1,126
Cash flow
-20.8%
Cash-on-Cash Return
0.9%
Cap rate
0.8%
Rent to Value Ratio

Active
$750,000
3
bds
|
2
ba
|
1,790
sqft
|
built
2005
130 N Garland Ct, Chicago, IL 60602
$-2,847
Cash flow
-19.8%
Cash-on-Cash Return
1.1%
Cap rate
0.7%
Rent to Value Ratio
Active
$224,000
3
bds
|
2
ba
|
0
sqft
|
built
1952
8550 S Avalon Ave, Chicago, IL 60619
$65
Cash flow
1.5%
Cash-on-Cash Return
6.0%
Cap rate
0.9%
Rent to Value Ratio
Active
$259,900
4
bds
|
3
ba
|
1,200
sqft
|
built
1919
8841 S Wabash Ave, Chicago, IL 60619
$138
Cash flow
2.8%
Cash-on-Cash Return
6.3%
Cap rate
0.8%
Rent to Value Ratio

Active
$539,000
8
bds
|
3
ba
|
0
sqft
|
built
1911
924 S Springfield Ave, Chicago, IL 60624
$-1,579
Cash flow
-15.3%
Cash-on-Cash Return
2.2%
Cap rate
0.3%
Rent to Value Ratio
Active
$530,000
4
bds
|
2
ba
|
0
sqft
|
built
1885
2227 W Cullerton St, Chicago, IL 60608
$-1,453
Cash flow
-14.3%
Cash-on-Cash Return
2.4%
Cap rate
0.4%
Rent to Value Ratio
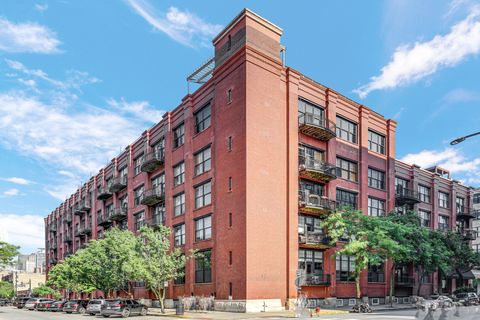
Active
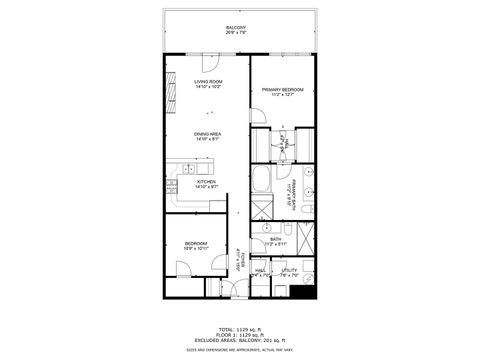
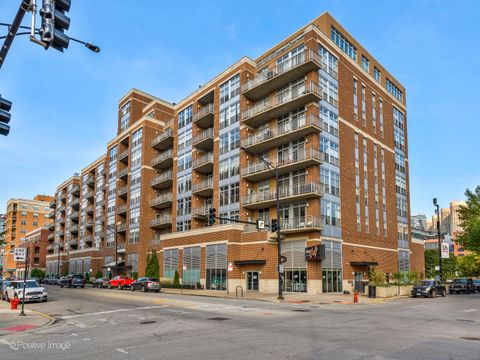
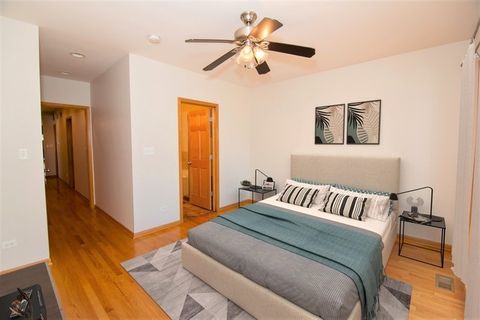
$399,000
2
bds
|
2
ba
|
1,129
sqft
|
built
2007
4141 N Kedzie Ave, Chicago, IL 60618
$-914
Cash flow
-12.0%
Cash-on-Cash Return
2.9%
Cap rate
0.7%
Rent to Value Ratio

Active
$800,000
3
bds
|
3
ba
|
1,800
sqft
|
built
1968
1700 E 56th St, Chicago, IL 60637
$-3,355
Cash flow
-21.9%
Cash-on-Cash Return
0.6%
Cap rate
0.5%
Rent to Value Ratio
Active
$350,000
1
bds
|
1
ba
|
900
sqft
|
built
2004
111 S Morgan St, Chicago, IL 60607
$-916
Cash flow
-13.7%
Cash-on-Cash Return
2.5%
Cap rate
0.8%
Rent to Value Ratio
Active
$384,900
4
bds
|
3
ba
|
2,800
sqft
|
built
2006
4312 S Saint Lawrence Ave, Chicago, IL 60653
$-209
Cash flow
-2.8%
Cash-on-Cash Return
5.0%
Cap rate
0.8%
Rent to Value Ratio
Active
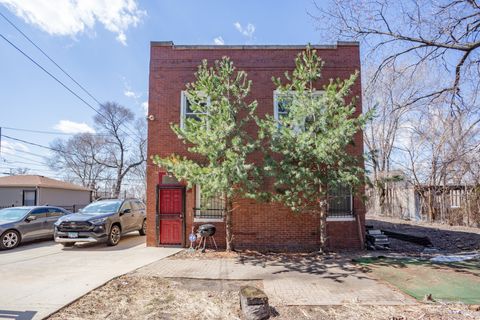
$47,500
5
bds
|
2
ba
|
1,400
sqft
|
built
1913
10514 S Perry Ave, Chicago, IL 60628
$1,125
Cash flow
27.6%
Cash-on-Cash Return
28.4%
Cap rate
3.6%
Rent to Value Ratio
Active
$265,000
3
bds
|
2
ba
|
1,825
sqft
|
built
1931
6018 S Wabash Ave, Chicago, IL 60637
$-480
Cash flow
-9.5%
Cash-on-Cash Return
3.5%
Cap rate
0.7%
Rent to Value Ratio
Active
$274,900
6
bds
|
2
ba
|
0
sqft
|
built
1925
7843 S Evans Ave, Chicago, IL 60619
$-374
Cash flow
-7.1%
Cash-on-Cash Return
4.0%
Cap rate
0.6%
Rent to Value Ratio
Active
$301,000
6
bds
|
2
ba
|
1,380
sqft
|
built
1954
3716 W 54th St, Chicago, IL 60632
$-155
Cash flow
-2.7%
Cash-on-Cash Return
5.1%
Cap rate
0.8%
Rent to Value Ratio
Active
$380,000
6
bds
|
3
ba
|
0
sqft
|
built
1888
3634 S Giles Ave, Chicago, IL 60653
$27
Cash flow
0.4%
Cash-on-Cash Return
5.8%
Cap rate
0.7%
Rent to Value Ratio
Active
$385,000
7
bds
|
5
ba
|
0
sqft
|
built
1924
7828 S Jeffery Blvd, Chicago, IL 60649
$-468
Cash flow
-6.3%
Cash-on-Cash Return
4.2%
Cap rate
0.6%
Rent to Value Ratio
Active
$535,000
2
bds
|
2
ba
|
1,650
sqft
|
built
1973
1313 N Ritchie Ct, Chicago, IL 60610
$-3,047
Cash flow
-29.7%
Cash-on-Cash Return
-1.2%
Cap rate
0.5%
Rent to Value Ratio