Chicago, IL Investment Properties for Sale
Browse homes for sale and investment properties in Chicago, IL. Refine your search by price, property type, or more.
Best cash flowing properties in Chicago, IL
Active
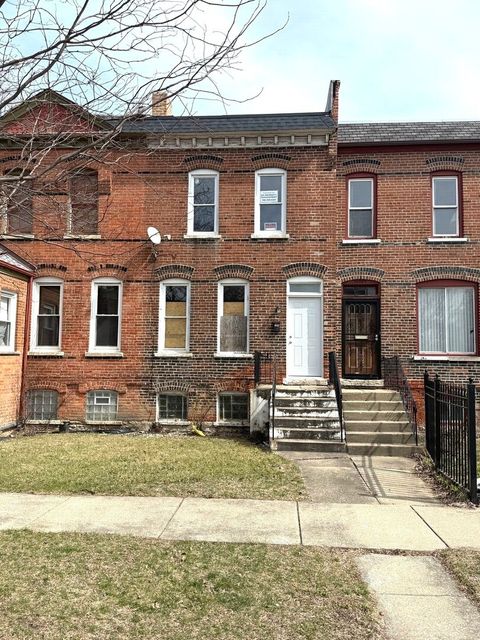
$71,000
2
bds
|
1
ba
|
1,280
sqft
|
built
1883
10763 S Champlain Ave, Chicago, IL 60628
$1,154
Cash flow
18.9%
Cash-on-Cash Return
19.5%
Cap rate
2.5%
Rent to Value Ratio
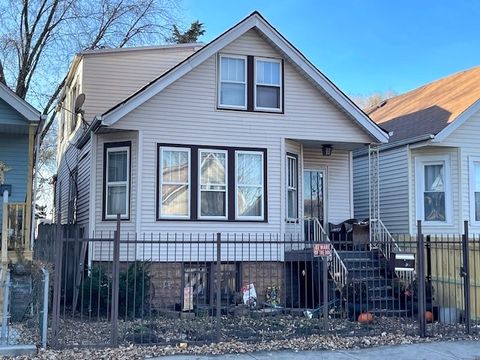
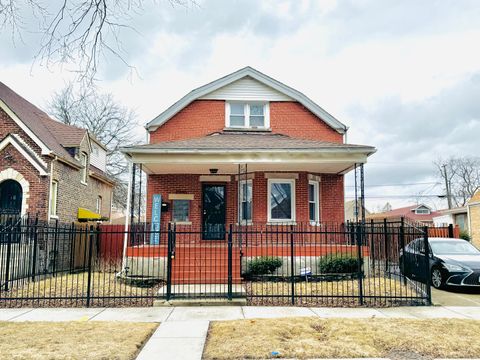
Active
$85,000
5
bds
|
2
ba
|
0
sqft
|
built
1927
7122 S Seeley Ave, Chicago, IL 60636
$867
Cash flow
53.2%
Cash-on-Cash Return
17.9%
Cap rate
2.4%
Rent to Value Ratio
3,965 out of 4,608 properties for sale in Chicago, IL
Limited Results Shown
Create a free account, or log in to reveal all property listings and enjoy the complete experience.
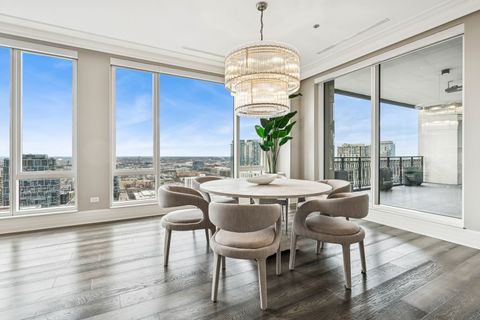
Active
$6,900,000
3
bds
|
4
ba
|
4,500
sqft
|
built
2018
9 W Walton St, Chicago, IL 60610
$-43,402
Cash flow
-32.8%
Cash-on-Cash Return
-1.9%
Cap rate
0.1%
Rent to Value Ratio
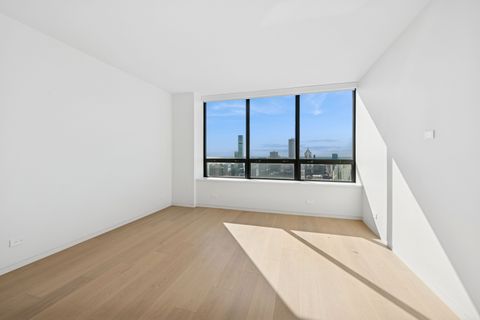
Active
$3,497,747
5
bds
|
5
ba
|
3,655
sqft
|
built
1975
180 E Pearson St, Chicago, IL 60611
$-17,702
Cash flow
-26.4%
Cash-on-Cash Return
-0.4%
Cap rate
0.2%
Rent to Value Ratio
Active
$489,900
3
bds
|
2
ba
|
0
sqft
|
built
1938
3418 N Nordica Ave, Chicago, IL 60634
$-960
Cash flow
-10.2%
Cash-on-Cash Return
3.3%
Cap rate
0.6%
Rent to Value Ratio
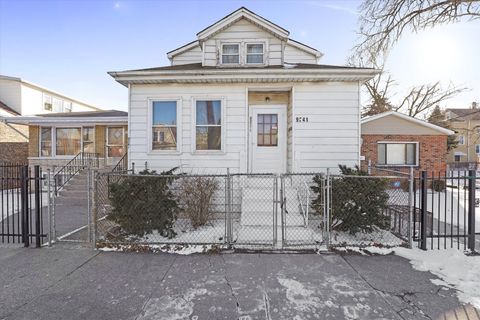
Active
$110,000
4
bds
|
2
ba
|
1,224
sqft
|
built
1923
9241 S Blackstone Ave, Chicago, IL 60619
$650
Cash flow
30.8%
Cash-on-Cash Return
12.8%
Cap rate
1.6%
Rent to Value Ratio
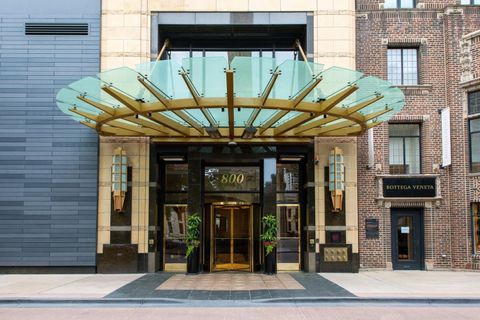
Active
$2,699,000
3
bds
|
4
ba
|
3,200
sqft
|
built
2000
800 N Michigan Ave, Chicago, IL 60611
$-14,490
Cash flow
-28.0%
Cash-on-Cash Return
-0.8%
Cap rate
0.2%
Rent to Value Ratio
Active
$280,000
4
bds
|
3
ba
|
1,933
sqft
|
built
1931
9944 S Green St, Chicago, IL 60643
$454
Cash flow
8.5%
Cash-on-Cash Return
7.6%
Cap rate
1.0%
Rent to Value Ratio
Active
$289,900
4
bds
|
3
ba
|
4,655
sqft
|
built
1925
9046 S Laflin St, Chicago, IL 60620
$-13
Cash flow
-0.2%
Cash-on-Cash Return
5.6%
Cap rate
0.8%
Rent to Value Ratio
Active
$325,000
8
bds
|
6
ba
|
0
sqft
|
built
1893
4558 S Laflin St, Chicago, IL 60609
$-765
Cash flow
-12.3%
Cash-on-Cash Return
2.9%
Cap rate
0.4%
Rent to Value Ratio
Active
$674,900
4
bds
|
6
ba
|
3,900
sqft
|
built
1880
4364 S Oakenwald Ave, Chicago, IL 60653
$-980
Cash flow
-7.6%
Cash-on-Cash Return
3.9%
Cap rate
0.7%
Rent to Value Ratio
Active
$340,000
4
bds
|
2
ba
|
1,800
sqft
|
built
1925
8406 S Oglesby Ave, Chicago, IL 60617
$-157
Cash flow
-2.4%
Cash-on-Cash Return
5.1%
Cap rate
0.7%
Rent to Value Ratio

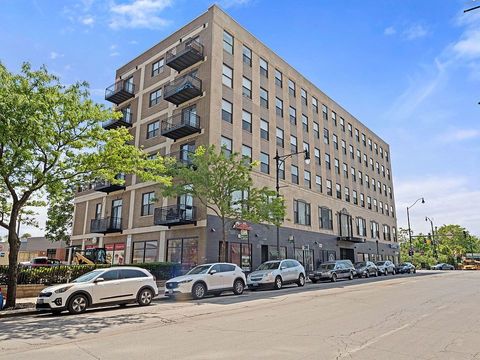
Active
$425,000
2
bds
|
2
ba
|
1,224
sqft
|
built
2002
933 W Van Buren St, Chicago, IL 60607
$-980
Cash flow
-12.0%
Cash-on-Cash Return
2.9%
Cap rate
0.8%
Rent to Value Ratio
Active
$325,000
3
bds
|
2
ba
|
1,792
sqft
|
built
1960
9113 S Constance Ave, Chicago, IL 60617
$213
Cash flow
3.4%
Cash-on-Cash Return
6.5%
Cap rate
1.0%
Rent to Value Ratio
Active
$175,900
2
bds
|
2
ba
|
900
sqft
|
built
1908
4557 S Michigan Ave, Chicago, IL 60653
$-236
Cash flow
-7.0%
Cash-on-Cash Return
4.1%
Cap rate
1.0%
Rent to Value Ratio
Active
$325,000
1
bds
|
1
ba
|
725
sqft
|
built
1962
300 N State St, Chicago, IL 60654
$-794
Cash flow
-12.7%
Cash-on-Cash Return
2.7%
Cap rate
0.9%
Rent to Value Ratio

Active
$5,995,000
3
bds
|
6
ba
|
6,500
sqft
|
built
1969
1524 N Astor St, Chicago, IL 60610
$-27,620
Cash flow
-24.0%
Cash-on-Cash Return
0.2%
Cap rate
0.2%
Rent to Value Ratio
Active
$99,500
3
bds
|
2
ba
|
1,330
sqft
|
built
1883
10757 S Champlain Ave, Chicago, IL 60628
$743
Cash flow
39.0%
Cash-on-Cash Return
14.6%
Cap rate
1.9%
Rent to Value Ratio
Active
$1,195,000
2
bds
|
3
ba
|
1,937
sqft
|
built
2012
118 E Erie St, Chicago, IL 60611
$-6,536
Cash flow
-28.5%
Cash-on-Cash Return
-0.9%
Cap rate
0.5%
Rent to Value Ratio

Active
$520,000
2
bds
|
2
ba
|
1,248
sqft
|
built
2006
100 E 14th St, Chicago, IL 60605
$-1,806
Cash flow
-18.1%
Cash-on-Cash Return
1.5%
Cap rate
0.6%
Rent to Value Ratio

Active
$85,000
2
bds
|
1
ba
|
966
sqft
|
built
1913
9030 S Ellis Ave, Chicago, IL 60619
$486
Cash flow
29.8%
Cash-on-Cash Return
12.5%
Cap rate
1.6%
Rent to Value Ratio
Active
$237,000
3
bds
|
2
ba
|
0
sqft
|
built
1974
1505 E 83rd St, Chicago, IL 60619
$363
Cash flow
8.0%
Cash-on-Cash Return
7.5%
Cap rate
1.1%
Rent to Value Ratio

Active
$295,000
4
bds
|
2
ba
|
0
sqft
|
built
1923
7326 S Saint Lawrence Ave, Chicago, IL 60619
$-290
Cash flow
-5.1%
Cash-on-Cash Return
4.5%
Cap rate
0.7%
Rent to Value Ratio
Active
$71,000
2
bds
|
1
ba
|
1,280
sqft
|
built
1883
10763 S Champlain Ave, Chicago, IL 60628
$1,154
Cash flow
18.9%
Cash-on-Cash Return
19.5%
Cap rate
2.5%
Rent to Value Ratio
Active
$380,000
7
bds
|
3
ba
|
0
sqft
|
built
1923
4944 S Honore St, Chicago, IL 60609
$-423
Cash flow
-5.8%
Cash-on-Cash Return
4.3%
Cap rate
0.6%
Rent to Value Ratio

Active
$379,900
1
bds
|
2
ba
|
1,036
sqft
|
built
2005
130 N Garland Ct, Chicago, IL 60602
$-1,274
Cash flow
-17.5%
Cash-on-Cash Return
1.7%
Cap rate
0.7%
Rent to Value Ratio
Active
$439,900
4
bds
|
3
ba
|
3,250
sqft
|
built
2008
3319 W Jackson Blvd, Chicago, IL 60624
$-183
Cash flow
-2.2%
Cash-on-Cash Return
5.2%
Cap rate
0.8%
Rent to Value Ratio

Active
$5,495,000
4
bds
|
9
ba
|
7,600
sqft
|
built
1887
1540 N Dearborn Pkwy, Chicago, IL 60610
$-26,990
Cash flow
-25.6%
Cash-on-Cash Return
-0.2%
Cap rate
0.2%
Rent to Value Ratio
Active
$295,000
bds
|
1
ba
|
740
sqft
|
built
2000
501 N Clinton St, Chicago, IL 60654
$-702
Cash flow
-12.4%
Cash-on-Cash Return
2.8%
Cap rate
0.8%
Rent to Value Ratio
Active
$649,000
6
bds
|
4
ba
|
0
sqft
|
built
1922
5007 N Lawndale Ave, Chicago, IL 60625
$-2,034
Cash flow
-16.4%
Cash-on-Cash Return
1.9%
Cap rate
0.4%
Rent to Value Ratio
Active
$270,000
3
bds
|
2
ba
|
1,300
sqft
|
built
1900
4608 S Marshfield Ave, Chicago, IL 60609
$538
Cash flow
10.4%
Cash-on-Cash Return
8.1%
Cap rate
1.0%
Rent to Value Ratio
Active
$640,000
9
bds
|
3
ba
|
0
sqft
|
built
1912
5710 W Leland Ave, Chicago, IL 60630
$-2,025
Cash flow
-16.5%
Cash-on-Cash Return
1.9%
Cap rate
0.4%
Rent to Value Ratio
Active
$85,000
5
bds
|
2
ba
|
0
sqft
|
built
1927
7122 S Seeley Ave, Chicago, IL 60636
$867
Cash flow
53.2%
Cash-on-Cash Return
17.9%
Cap rate
2.4%
Rent to Value Ratio
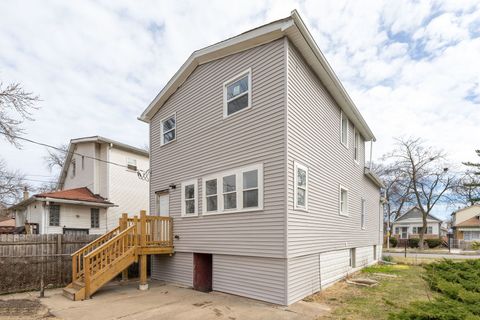
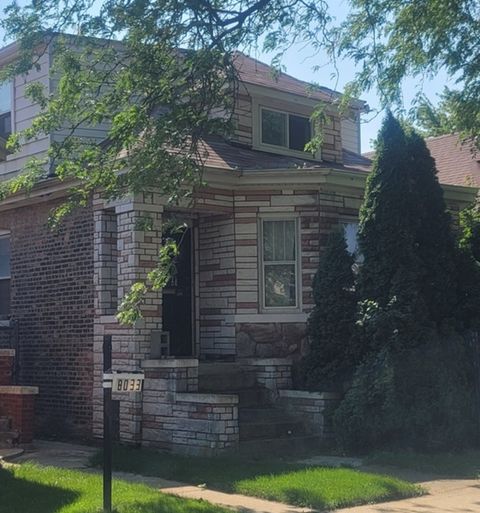
Active
$319,000
5
bds
|
3
ba
|
2,200
sqft
|
built
1876
8048 S Avalon Ave, Chicago, IL 60619
$-690
Cash flow
-11.3%
Cash-on-Cash Return
3.1%
Cap rate
0.4%
Rent to Value Ratio
Active
$135,000
6
bds
|
3
ba
|
1,033
sqft
|
built
1930
8037 S Princeton Ave, Chicago, IL 60620
$595
Cash flow
23.0%
Cash-on-Cash Return
11.0%
Cap rate
1.3%
Rent to Value Ratio
Active
$300,000
4
bds
|
3
ba
|
0
sqft
|
built
1912
742 S Kostner Ave, Chicago, IL 60624
$-153
Cash flow
-2.7%
Cash-on-Cash Return
5.1%
Cap rate
0.7%
Rent to Value Ratio

Active
$749,000
4
bds
|
3
ba
|
2,400
sqft
|
built
2000
1340 W Hubbard St, Chicago, IL 60642
$-2,504
Cash flow
-17.4%
Cash-on-Cash Return
1.7%
Cap rate
0.4%
Rent to Value Ratio
Active
$159,000
1
bds
|
1
ba
|
0
sqft
|
built
1925
1791 W Howard St, Chicago, IL 60626
$-159
Cash flow
-5.2%
Cash-on-Cash Return
4.5%
Cap rate
0.9%
Rent to Value Ratio
Active
$399,900
3
bds
|
2
ba
|
1,340
sqft
|
built
1953
9726 S Longwood Dr, Chicago, IL 60643
$-188
Cash flow
-2.5%
Cash-on-Cash Return
5.1%
Cap rate
0.8%
Rent to Value Ratio
Active
$278,995
3
bds
|
3
ba
|
1,545
sqft
|
built
1913
4551 S Michigan Ave, Chicago, IL 60653
$-736
Cash flow
-13.8%
Cash-on-Cash Return
2.5%
Cap rate
0.7%
Rent to Value Ratio
Active
$309,000
9
bds
|
3
ba
|
0
sqft
|
built
1908
8811 S Exchange Ave, Chicago, IL 60617
$-241
Cash flow
-4.1%
Cash-on-Cash Return
4.7%
Cap rate
0.6%
Rent to Value Ratio

Active
$295,000
3
bds
|
2
ba
|
0
sqft
|
built
1916
13258 S Houston Ave, Chicago, IL 60633
$-272
Cash flow
-4.8%
Cash-on-Cash Return
4.6%
Cap rate
0.6%
Rent to Value Ratio