Chicago, IL Investment Properties for Sale
Browse homes for sale and investment properties in Chicago, IL. Refine your search by price, property type, or more.
Best cash flowing properties in Chicago, IL
Active
$69,000
3
bds
|
1
ba
|
894
sqft
|
built
1888
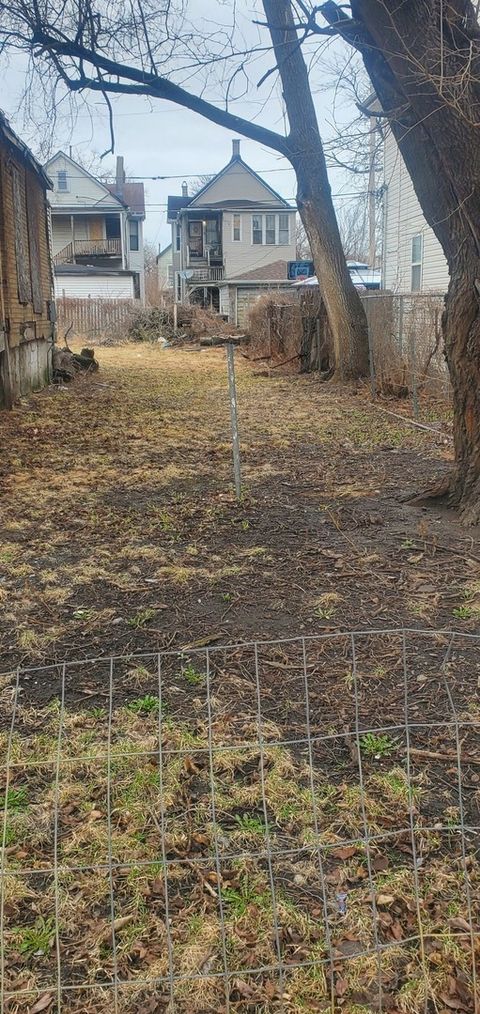
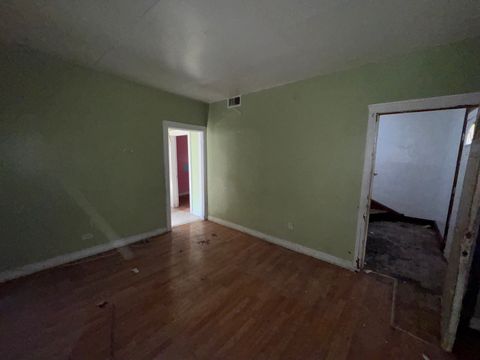
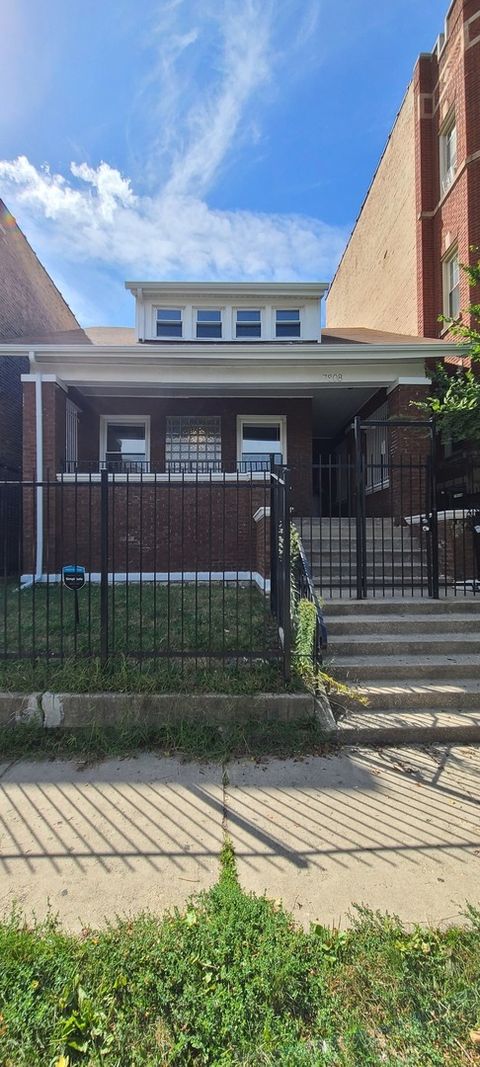
346 W 60th St, Chicago, IL 60621
$1,336
Cash flow
22.6%
Cash-on-Cash Return
23.2%
Cap rate
2.9%
Rent to Value Ratio
Active
$59,000
6
bds
|
2
ba
|
0
sqft
|
built
1888
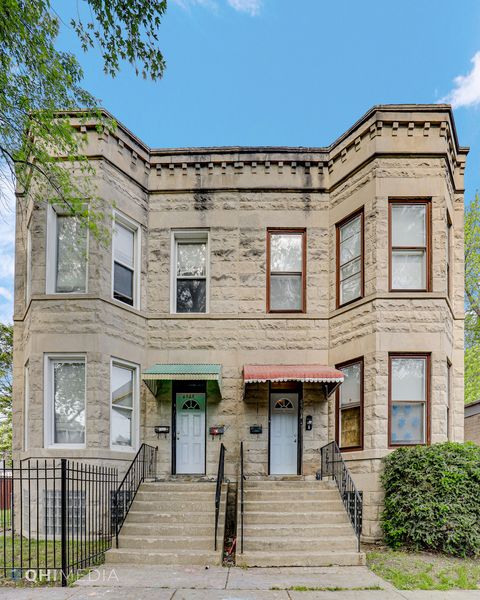
8412 S Exchange Ave, Chicago, IL 60617
$946
Cash flow
18.7%
Cash-on-Cash Return
19.2%
Cap rate
2.7%
Rent to Value Ratio
3,968 out of 4,611 properties for sale in Chicago, IL
Limited Results Shown
Create a free account, or log in to reveal all property listings and enjoy the complete experience.
Active
$294,000
5
bds
|
2
ba
|
0
sqft
|
built
1895
6506 S Eberhart Ave, Chicago, IL 60637
$-814
Cash flow
-14.4%
Cash-on-Cash Return
2.4%
Cap rate
0.4%
Rent to Value Ratio
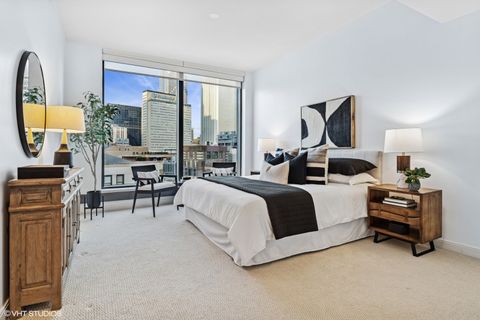
Active
$475,000
2
bds
|
2
ba
|
1,310
sqft
|
built
1999
400 W Ontario St, Chicago, IL 60654
$-1,324
Cash flow
-14.5%
Cash-on-Cash Return
2.3%
Cap rate
0.8%
Rent to Value Ratio

Active
$275,000
2
bds
|
2
ba
|
1,100
sqft
|
built
2007
2335 W Belle Plaine Ave, Chicago, IL 60618
$-571
Cash flow
-10.8%
Cash-on-Cash Return
3.2%
Cap rate
0.9%
Rent to Value Ratio
Active
$879,900
12
bds
|
6
ba
|
0
sqft
|
built
1903
6340 S Vernon Ave, Chicago, IL 60637
$-2,611
Cash flow
-15.5%
Cash-on-Cash Return
2.1%
Cap rate
0.3%
Rent to Value Ratio
Active
$1,290,000
5
bds
|
4
ba
|
3,594
sqft
|
built
1913
2216 W Greenleaf Ave, Chicago, IL 60645
$-3,926
Cash flow
-15.9%
Cash-on-Cash Return
2.0%
Cap rate
0.3%
Rent to Value Ratio
Active
$350,000
2
bds
|
1
ba
|
1,060
sqft
|
built
1989
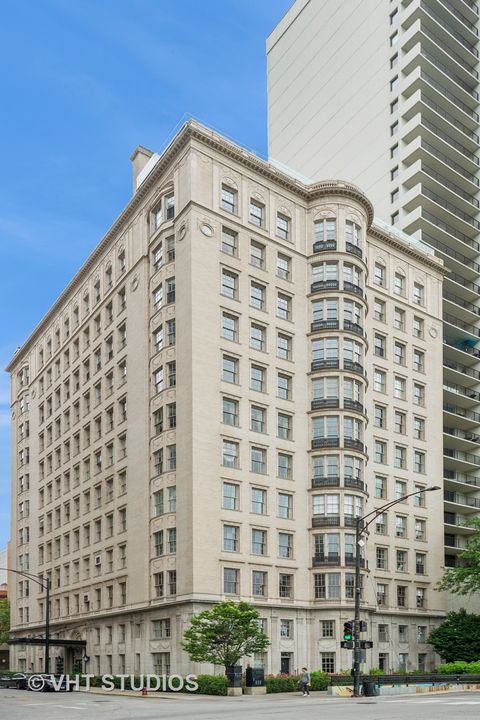
200 N Dearborn St, Chicago, IL 60601
$-1,272
Cash flow
-19.0%
Cash-on-Cash Return
1.3%
Cap rate
0.8%
Rent to Value Ratio
Active
$300,000
6
bds
|
4
ba
|
0
sqft
|
built
1903
2839 S Karlov Ave, Chicago, IL 60623
$-174
Cash flow
-3.0%
Cash-on-Cash Return
5.0%
Cap rate
0.7%
Rent to Value Ratio
Active
$413,000
3
bds
|
2
ba
|
2,200
sqft
|
built
1940
1907 N Rutherford Ave, Chicago, IL 60707
$-92
Cash flow
-1.2%
Cash-on-Cash Return
5.4%
Cap rate
0.8%
Rent to Value Ratio
Active
$385,000
10
bds
|
4
ba
|
0
sqft
|
built
1922
6758 S Hermitage Ave, Chicago, IL 60636
$-1,079
Cash flow
-14.6%
Cash-on-Cash Return
2.3%
Cap rate
0.4%
Rent to Value Ratio
Active
$1,499,900
2
bds
|
3
ba
|
2,300
sqft
|
built
1964
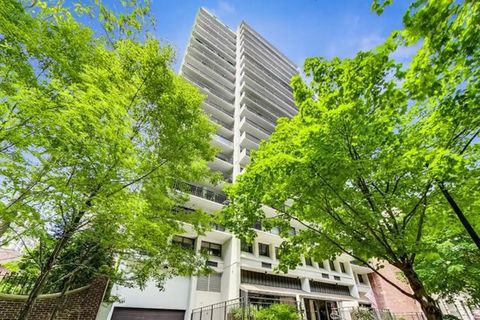
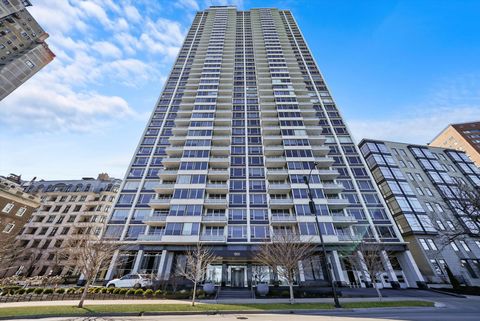
1040 N Lake Shore Dr, Chicago, IL 60611
$-7,104
Cash flow
-24.7%
Cash-on-Cash Return
0.0%
Cap rate
0.4%
Rent to Value Ratio
Active
$549,000
6
bds
|
3
ba
|
0
sqft
|
built
1907
1205 N Hamlin Ave, Chicago, IL 60651
$-1,474
Cash flow
-14.0%
Cash-on-Cash Return
2.5%
Cap rate
0.4%
Rent to Value Ratio
Active
$69,000
3
bds
|
1
ba
|
894
sqft
|
built
1888
346 W 60th St, Chicago, IL 60621
$1,336
Cash flow
22.6%
Cash-on-Cash Return
23.2%
Cap rate
2.9%
Rent to Value Ratio

Active
$505,000
5
bds
|
2
ba
|
0
sqft
|
built
1910
3736 W Cermak Rd, Chicago, IL 60623
$-1,604
Cash flow
-16.6%
Cash-on-Cash Return
1.9%
Cap rate
0.3%
Rent to Value Ratio
Active
$575,000
2
bds
|
2
ba
|
1,342
sqft
|
built
2009
60 E Monroe St, Chicago, IL 60603
$-2,582
Cash flow
-23.4%
Cash-on-Cash Return
0.3%
Cap rate
0.6%
Rent to Value Ratio

Active
$265,000
2
bds
|
2
ba
|
1,821
sqft
|
built
1954
9230 S Greenwood Ave, Chicago, IL 60619
$6
Cash flow
0.1%
Cash-on-Cash Return
5.7%
Cap rate
0.8%
Rent to Value Ratio

Active
$575,000
6
bds
|
2
ba
|
0
sqft
|
built
1895
2016 W Superior St, Chicago, IL 60612
$-779
Cash flow
-7.1%
Cash-on-Cash Return
4.1%
Cap rate
0.5%
Rent to Value Ratio

Active
$625,000
6
bds
|
2
ba
|
0
sqft
|
built
1895
2020 W Superior St, Chicago, IL 60612
$-1,882
Cash flow
-15.7%
Cash-on-Cash Return
2.1%
Cap rate
0.5%
Rent to Value Ratio

Active
$175,000
1
bds
|
1
ba
|
700
sqft
|
built
1972
1060 W Hollywood Ave, Chicago, IL 60660
$-285
Cash flow
-8.5%
Cash-on-Cash Return
3.7%
Cap rate
0.8%
Rent to Value Ratio
Active
$550,000
3
bds
|
3
ba
|
1,600
sqft
|
built
1973
1430 N Astor St, Chicago, IL 60610
$-2,143
Cash flow
-20.3%
Cash-on-Cash Return
1.0%
Cap rate
0.9%
Rent to Value Ratio
Active
$299,000
1
bds
|
1
ba
|
950
sqft
|
built
1912
1200 N Lake Shore Dr, Chicago, IL 60610
$-2,226
Cash flow
-38.8%
Cash-on-Cash Return
-2.7%
Cap rate
0.7%
Rent to Value Ratio
Active
$209,000
4
bds
|
2
ba
|
1,914
sqft
|
built
1918
7808 S Morgan St, Chicago, IL 60620
$604
Cash flow
15.1%
Cash-on-Cash Return
9.1%
Cap rate
1.2%
Rent to Value Ratio

Active
$899,000
9
bds
|
7
ba
|
0
sqft
|
built
1894
6406 S Ingleside Ave, Chicago, IL 60637
$-3,635
Cash flow
-21.1%
Cash-on-Cash Return
0.8%
Cap rate
0.2%
Rent to Value Ratio
Active
$845,000
2
bds
|
2
ba
|
1,425
sqft
|
built
1974
1300 N Lake Shore Dr, Chicago, IL 60610
$-2,789
Cash flow
-17.2%
Cash-on-Cash Return
1.7%
Cap rate
0.7%
Rent to Value Ratio
Active
$120,000
2
bds
|
1
ba
|
873
sqft
|
built
1966
2348 W 111th St, Chicago, IL 60643
$120
Cash flow
5.2%
Cash-on-Cash Return
6.9%
Cap rate
1.4%
Rent to Value Ratio
Active
$300,000
1
bds
|
1
ba
|
0
sqft
|
built
1980
30 E Huron St, Chicago, IL 60611
$-908
Cash flow
-15.8%
Cash-on-Cash Return
2.0%
Cap rate
0.9%
Rent to Value Ratio
Active
$279,900
2
bds
|
3
ba
|
1,473
sqft
|
built
1909
7356 S Kenwood Ave, Chicago, IL 60619
$52
Cash flow
1.0%
Cash-on-Cash Return
5.9%
Cap rate
0.8%
Rent to Value Ratio
Active
$628,900
4
bds
|
4
ba
|
3,800
sqft
|
built
1920
7237 S Luella Ave, Chicago, IL 60649
$-886
Cash flow
-7.4%
Cash-on-Cash Return
4.0%
Cap rate
0.6%
Rent to Value Ratio
Active
$429,900
2
bds
|
2
ba
|
1,401
sqft
|
built
2007
2305 S Wabash Ave, Chicago, IL 60616
$-623
Cash flow
-7.6%
Cash-on-Cash Return
3.9%
Cap rate
0.7%
Rent to Value Ratio
Active
$749,000
7
bds
|
3
ba
|
0
sqft
|
built
1880
944 W 18th St, Chicago, IL 60608
$-3,069
Cash flow
-21.4%
Cash-on-Cash Return
0.8%
Cap rate
0.3%
Rent to Value Ratio

Active
$217,500
1
bds
|
1
ba
|
0
sqft
|
built
1989
200 N Dearborn St, Chicago, IL 60601
$-230
Cash flow
-5.5%
Cash-on-Cash Return
4.4%
Cap rate
1.0%
Rent to Value Ratio
Active
$439,900
2
bds
|
2
ba
|
1,600
sqft
|
built
1902
3909 N Sheridan Rd, Chicago, IL 60613
$-808
Cash flow
-9.6%
Cash-on-Cash Return
3.5%
Cap rate
0.7%
Rent to Value Ratio
Active
$780,000
2
bds
|
2
ba
|
1,244
sqft
|
built
2020
1400 W Monroe St, Chicago, IL 60607
$-2,342
Cash flow
-15.7%
Cash-on-Cash Return
2.1%
Cap rate
0.6%
Rent to Value Ratio
Active
$1,550,000
3
bds
|
4
ba
|
2,170
sqft
|
built
2010
10 E Delaware Pl, Chicago, IL 60611
$-6,081
Cash flow
-20.5%
Cash-on-Cash Return
1.0%
Cap rate
0.6%
Rent to Value Ratio
Active
$960,000
2
bds
|
3
ba
|
1,449
sqft
|
built
2007
450 E Waterside Dr, Chicago, IL 60601
$-3,109
Cash flow
-16.9%
Cash-on-Cash Return
1.8%
Cap rate
0.6%
Rent to Value Ratio
Active
$59,000
6
bds
|
2
ba
|
0
sqft
|
built
1888
8412 S Exchange Ave, Chicago, IL 60617
$946
Cash flow
18.7%
Cash-on-Cash Return
19.2%
Cap rate
2.7%
Rent to Value Ratio

Active
$218,000
4
bds
|
2
ba
|
1,689
sqft
|
built
1921
7949 S Colfax Ave, Chicago, IL 60617
$-233
Cash flow
-5.6%
Cash-on-Cash Return
4.4%
Cap rate
0.6%
Rent to Value Ratio
Active
$344,000
1
bds
|
1
ba
|
850
sqft
|
built
2005
233 E 13th St, Chicago, IL 60605
$-933
Cash flow
-14.2%
Cash-on-Cash Return
2.4%
Cap rate
0.7%
Rent to Value Ratio
Active
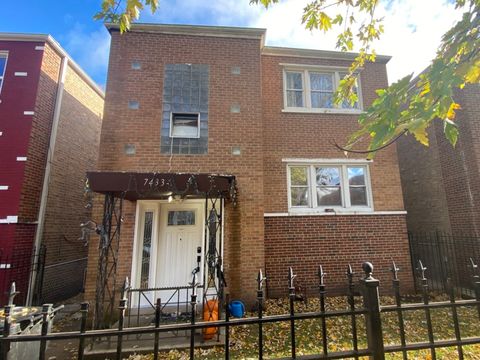
$570,000
4
bds
|
2
ba
|
0
sqft
|
built
1955
7433 N Damen Ave, Chicago, IL 60645
$-1,736
Cash flow
-15.9%
Cash-on-Cash Return
2.0%
Cap rate
0.4%
Rent to Value Ratio
Active
$599,900
3
bds
|
2
ba
|
1,700
sqft
|
built
1926
680 N Lake Shore Dr, Chicago, IL 60611
$-1,829
Cash flow
-15.9%
Cash-on-Cash Return
2.0%
Cap rate
0.8%
Rent to Value Ratio
Active
$143,520
4
bds
|
2
ba
|
1,149
sqft
|
built
1925
5840 S Artesian Ave, Chicago, IL 60629
$346
Cash flow
12.6%
Cash-on-Cash Return
8.6%
Cap rate
1.3%
Rent to Value Ratio