Chicago, IL Investment Properties for Sale
Browse homes for sale and investment properties in Chicago, IL. Refine your search by price, property type, or more.
Best cash flowing properties in Chicago, IL
Active
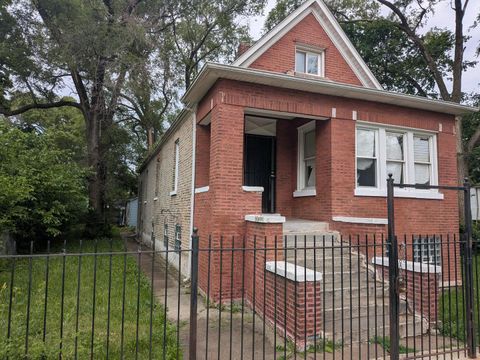
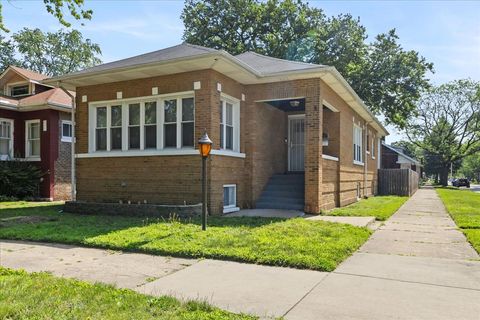
$149,999
5
bds
|
2
ba
|
1,148
sqft
|
built
1896
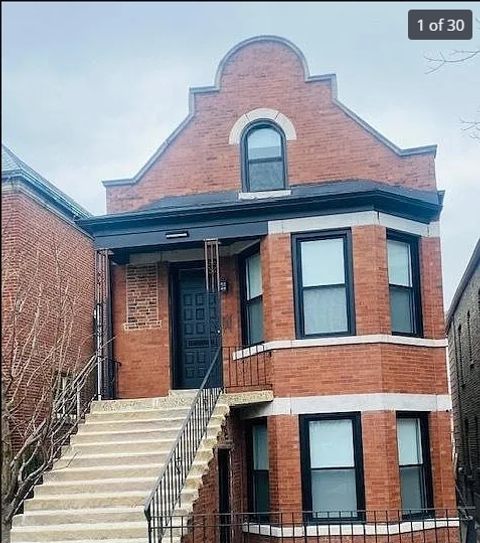
7017 S Hermitage Ave, Chicago, IL 60636
$641
Cash flow
22.3%
Cash-on-Cash Return
11.4%
Cap rate
1.5%
Rent to Value Ratio
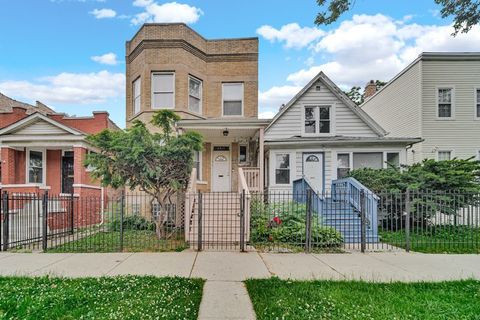
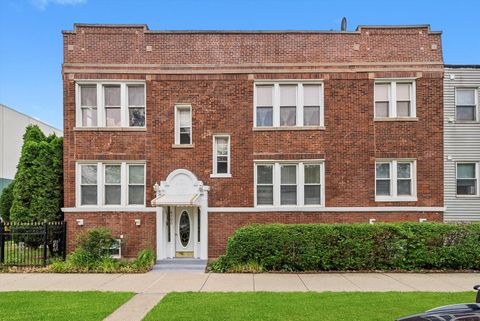
Active
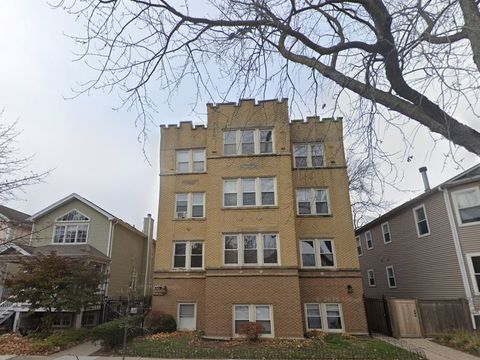
$175,000
5
bds
|
2
ba
|
0
sqft
|
built
1898
4910 W Gladys Ave, Chicago, IL 60644
$375
Cash flow
11.2%
Cash-on-Cash Return
8.8%
Cap rate
1.3%
Rent to Value Ratio
3,965 out of 4,608 properties for sale in Chicago, IL
Limited Results Shown
Create a free account, or log in to reveal all property listings and enjoy the complete experience.
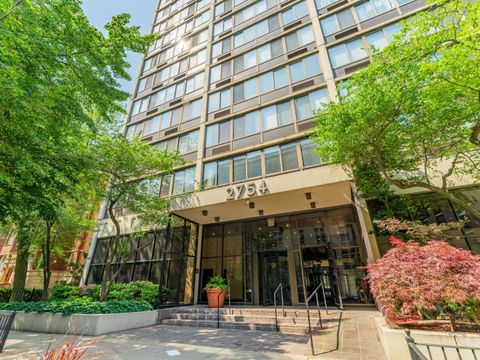
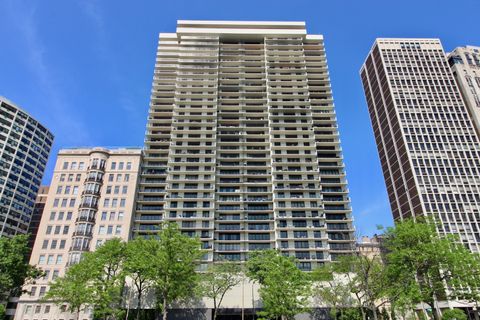
Active
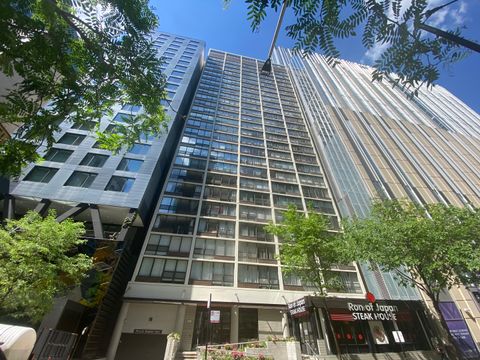
$305,000
1
bds
|
1
ba
|
800
sqft
|
built
1972
2754 N Hampden Ct, Chicago, IL 60614
$-793
Cash flow
-13.6%
Cash-on-Cash Return
3.1%
Cap rate
0.7%
Rent to Value Ratio
Active
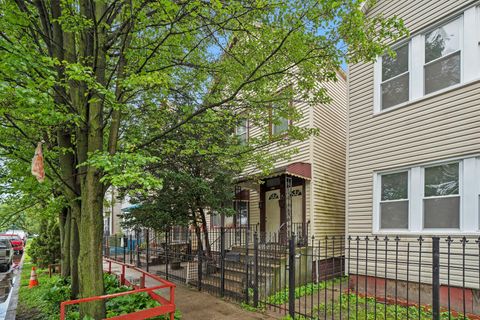
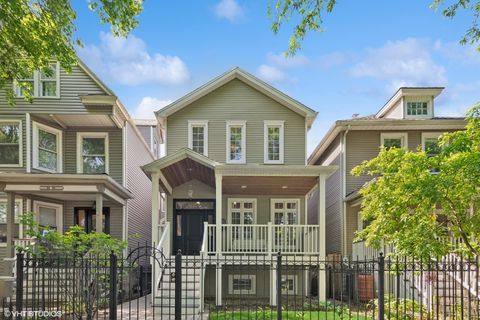
$925,000
3
bds
|
4
ba
|
2,884
sqft
|
built
2003
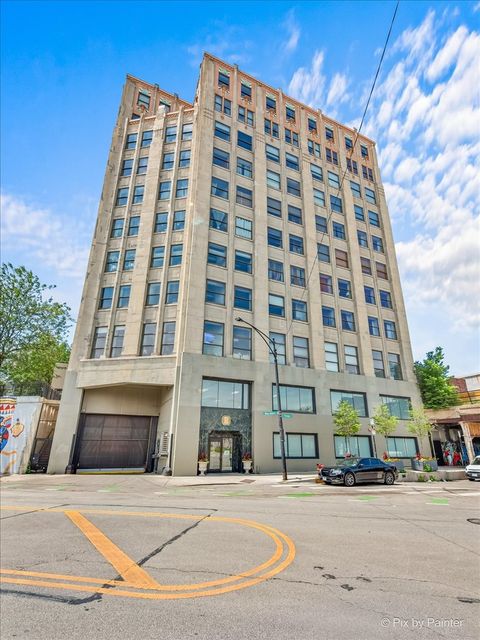
909 W Village Ct, Chicago, IL 60608
$-3,143
Cash flow
-17.7%
Cash-on-Cash Return
2.2%
Cap rate
0.6%
Rent to Value Ratio
Active
$310,000
2
bds
|
2
ba
|
1,160
sqft
|
built
2007
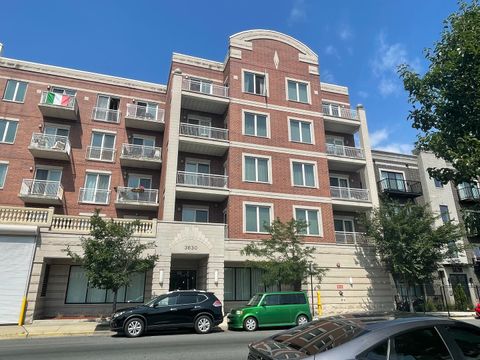
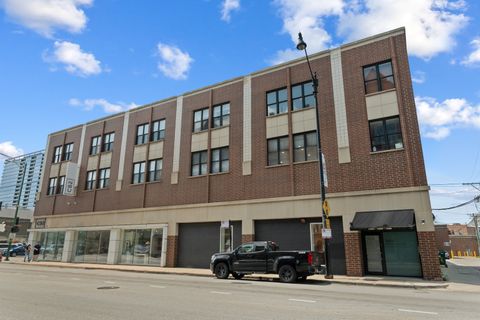
3630 N Harlem Ave, Chicago, IL 60634
$-742
Cash flow
-12.5%
Cash-on-Cash Return
3.4%
Cap rate
0.7%
Rent to Value Ratio

Active
$485,000
2
bds
|
2
ba
|
1,450
sqft
|
built
2001
1212 N Wells St, Chicago, IL 60610
$-1,060
Cash flow
-11.4%
Cash-on-Cash Return
3.1%
Cap rate
0.8%
Rent to Value Ratio
Active
$299,000
2
bds
|
2
ba
|
1,500
sqft
|
built
1967
7033 N Kedzie Ave, Chicago, IL 60645
$-1,287
Cash flow
-22.5%
Cash-on-Cash Return
1.1%
Cap rate
0.7%
Rent to Value Ratio
Active
$299,000
1
bds
|
1
ba
|
0
sqft
|
built
1989
1600 N Halsted St, Chicago, IL 60614
$-644
Cash flow
-11.2%
Cash-on-Cash Return
3.7%
Cap rate
0.8%
Rent to Value Ratio
Active
$585,000
4
bds
|
2
ba
|
0
sqft
|
built
1913
5028 W Lawrence Ave, Chicago, IL 60630
$-2,159
Cash flow
-19.3%
Cash-on-Cash Return
1.8%
Cap rate
0.3%
Rent to Value Ratio
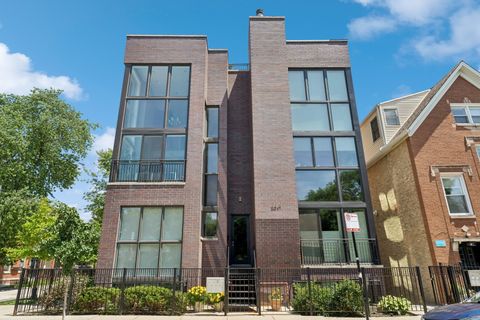
Active
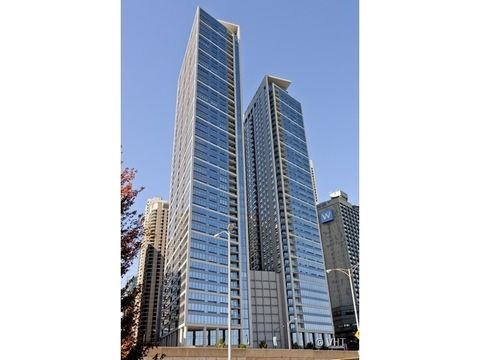
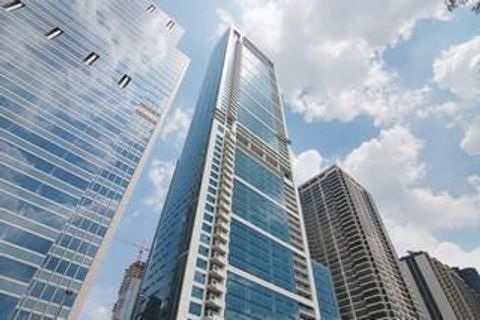
$1,475,000
3
bds
|
4
ba
|
2,540
sqft
|
built
2009
600 N Lake Shore Dr, Chicago, IL 60611
$-5,393
Cash flow
-19.1%
Cash-on-Cash Return
1.9%
Cap rate
0.6%
Rent to Value Ratio
Active
$179,000
1
bds
|
1
ba
|
0
sqft
|
built
1920
5058 N Claremont Ave, Chicago, IL 60625
$-414
Cash flow
-12.1%
Cash-on-Cash Return
3.5%
Cap rate
0.9%
Rent to Value Ratio
Active
$185,000
1
bds
|
1
ba
|
675
sqft
|
built
1969
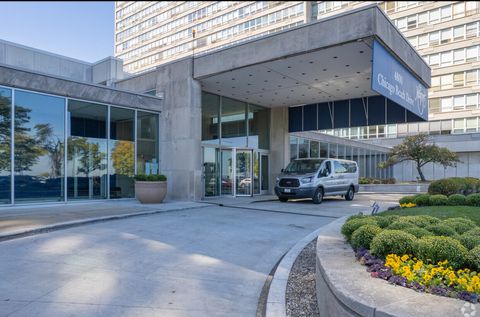
230 E Ontario St, Chicago, IL 60611
$-605
Cash flow
-17.1%
Cash-on-Cash Return
2.3%
Cap rate
1.1%
Rent to Value Ratio
Active
$299,999
15
bds
|
8
ba
|
0
sqft
|
built
1894
5016 S Paulina St, Chicago, IL 60609
$-184
Cash flow
-3.2%
Cash-on-Cash Return
5.5%
Cap rate
0.7%
Rent to Value Ratio
Active
$670,000
1
bds
|
2
ba
|
1,071
sqft
|
built
2008
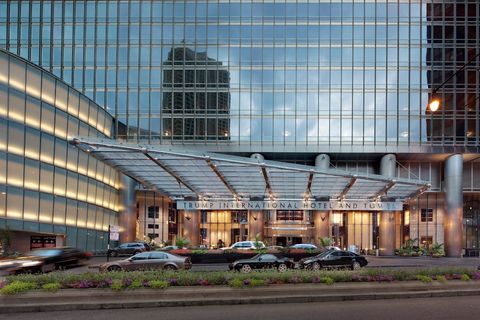
401 N Wabash Ave, Chicago, IL 60611
$-2,762
Cash flow
-21.5%
Cash-on-Cash Return
1.3%
Cap rate
0.6%
Rent to Value Ratio
Active
$229,900
1
bds
|
1
ba
|
0
sqft
|
built
1913
1550 S Blue Island Ave, Chicago, IL 60608
$-701
Cash flow
-15.9%
Cash-on-Cash Return
2.6%
Cap rate
1.0%
Rent to Value Ratio
Active
$500,000
7
bds
|
3
ba
|
2,250
sqft
|
built
1889
1634 W 38th St, Chicago, IL 60609
$-1,162
Cash flow
-12.1%
Cash-on-Cash Return
2.9%
Cap rate
0.5%
Rent to Value Ratio
Active
$1,045,000
1
bds
|
3
ba
|
2,230
sqft
|
built
1964
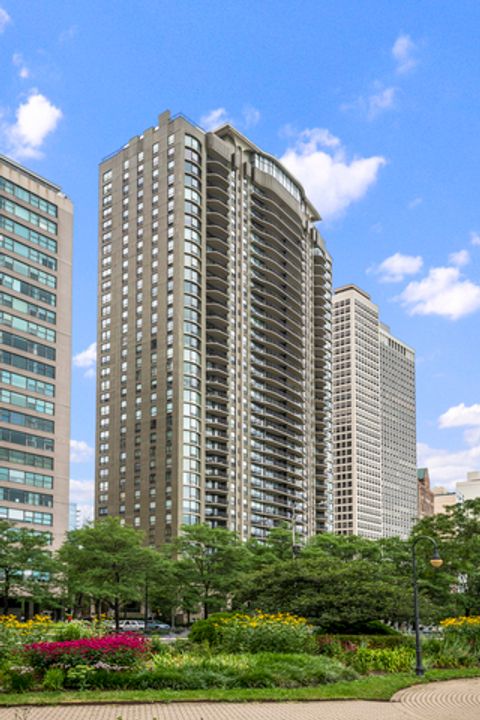
1040 N Lake Shore Dr, Chicago, IL 60611
$-5,093
Cash flow
-25.4%
Cash-on-Cash Return
-0.2%
Cap rate
0.5%
Rent to Value Ratio
Active
$245,000
2
bds
|
2
ba
|
1,100
sqft
|
built
1962
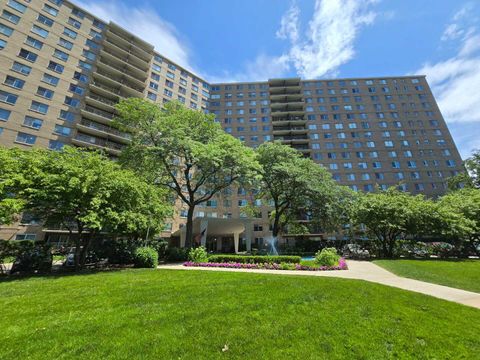
4800 S Chicago Beach Dr, Chicago, IL 60615
$-1,062
Cash flow
-22.6%
Cash-on-Cash Return
0.5%
Cap rate
0.9%
Rent to Value Ratio
Active
$134,000
8
bds
|
4
ba
|
0
sqft
|
built
1885
2900 E 87th St, Chicago, IL 60617
$208
Cash flow
8.1%
Cash-on-Cash Return
7.5%
Cap rate
1.1%
Rent to Value Ratio
Active
$499,900
2
bds
|
2
ba
|
1,250
sqft
|
built
1988
1250 N Dearborn St, Chicago, IL 60610
$-1,628
Cash flow
-17.0%
Cash-on-Cash Return
1.8%
Cap rate
0.8%
Rent to Value Ratio
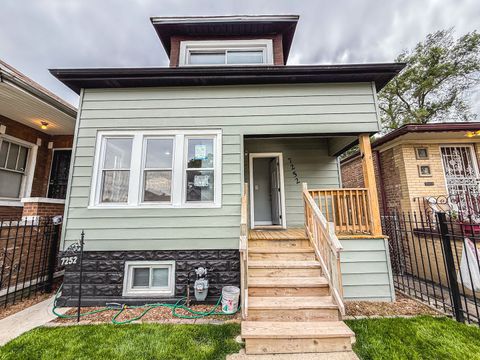
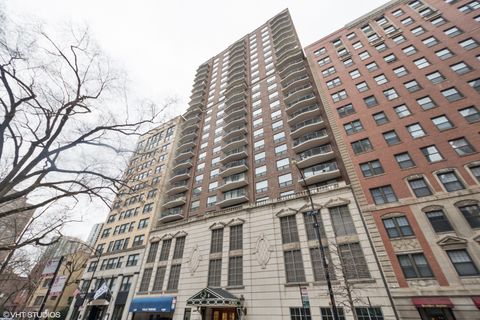
Active
$275,000
4
bds
|
2
ba
|
1,500
sqft
|
built
1924
7252 S Wood St, Chicago, IL 60636
$-332
Cash flow
-6.3%
Cash-on-Cash Return
4.8%
Cap rate
0.6%
Rent to Value Ratio
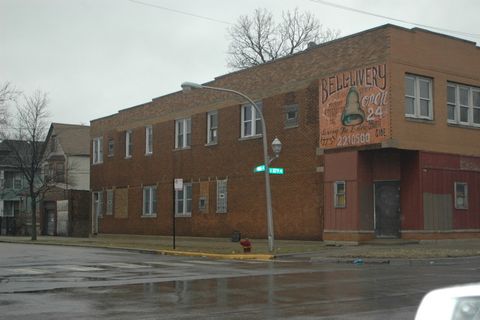
Active
$175,000
5
bds
|
2
ba
|
0
sqft
|
built
1898
4910 W Gladys Ave, Chicago, IL 60644
$375
Cash flow
11.2%
Cash-on-Cash Return
8.8%
Cap rate
1.3%
Rent to Value Ratio
Active
$1,125,000
2
bds
|
2
ba
|
1,567
sqft
|
built
2007
340 E Randolph St, Chicago, IL 60601
$-4,938
Cash flow
-22.9%
Cash-on-Cash Return
1.0%
Cap rate
0.5%
Rent to Value Ratio
Active
$1,250,000
4
bds
|
4
ba
|
4,080
sqft
|
built
2006
1959 W Berwyn Ave, Chicago, IL 60640
$-3,290
Cash flow
-13.7%
Cash-on-Cash Return
3.1%
Cap rate
0.6%
Rent to Value Ratio
Active
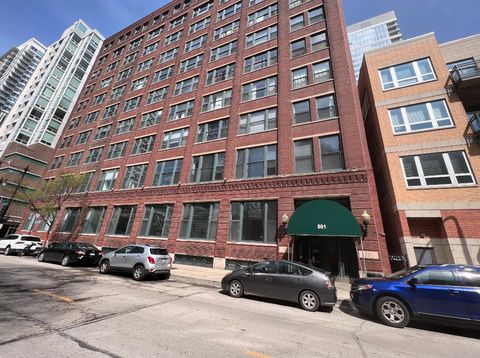
$325,000
2
bds
|
1
ba
|
1,350
sqft
|
built
1912
801 S Wells St, Chicago, IL 60607
$-671
Cash flow
-10.8%
Cash-on-Cash Return
3.8%
Cap rate
0.9%
Rent to Value Ratio
Active
$149,999
5
bds
|
2
ba
|
1,148
sqft
|
built
1896
7017 S Hermitage Ave, Chicago, IL 60636
$641
Cash flow
22.3%
Cash-on-Cash Return
11.4%
Cap rate
1.5%
Rent to Value Ratio
Active
$149,900
1
bds
|
1
ba
|
0
sqft
|
built
1972
1060 W Hollywood Ave, Chicago, IL 60660
$-106
Cash flow
-3.7%
Cash-on-Cash Return
5.4%
Cap rate
1.1%
Rent to Value Ratio
Active
$250,000
3
bds
|
2
ba
|
2,600
sqft
|
built
1918
7959 S Constance Ave, Chicago, IL 60617
$53
Cash flow
1.1%
Cash-on-Cash Return
6.5%
Cap rate
0.9%
Rent to Value Ratio

Active
$219,900
4
bds
|
2
ba
|
966
sqft
|
built
1895
10141 S Wallace St, Chicago, IL 60628
$147
Cash flow
3.5%
Cash-on-Cash Return
6.5%
Cap rate
0.9%
Rent to Value Ratio

Active
$690,000
2
bds
|
2
ba
|
1,520
sqft
|
built
2000
1122 N Dearborn St, Chicago, IL 60610
$-4,227
Cash flow
-32.0%
Cash-on-Cash Return
-1.7%
Cap rate
0.4%
Rent to Value Ratio
Active
$980,000
3
bds
|
2
ba
|
2,150
sqft
|
built
1970
1212 N Lake Shore Dr, Chicago, IL 60610
$-3,347
Cash flow
-17.8%
Cash-on-Cash Return
1.6%
Cap rate
0.7%
Rent to Value Ratio

Active
$360,000
4
bds
|
2
ba
|
2,040
sqft
|
built
1908
7225 S Yates Blvd, Chicago, IL 60649
$286
Cash flow
4.1%
Cash-on-Cash Return
6.6%
Cap rate
0.9%
Rent to Value Ratio
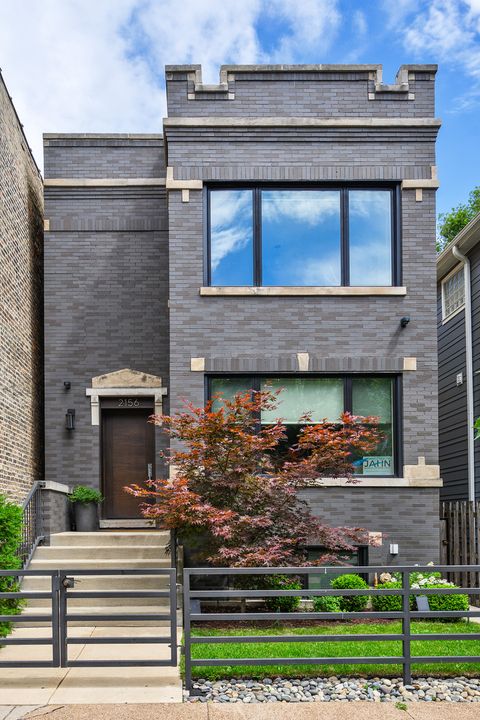
Active
$1,599,000
4
bds
|
4
ba
|
0
sqft
|
built
1928
2156 W Barry Ave, Chicago, IL 60618
$-5,333
Cash flow
-17.4%
Cash-on-Cash Return
1.7%
Cap rate
0.4%
Rent to Value Ratio

Active
$400,000
2
bds
|
2
ba
|
1,107
sqft
|
built
1923
3708 N Oketo Ave, Chicago, IL 60634
$-123
Cash flow
-1.6%
Cash-on-Cash Return
5.3%
Cap rate
0.8%
Rent to Value Ratio
Active
$799,900
8
bds
|
3
ba
|
0
sqft
|
built
1922
4100 W George St, Chicago, IL 60641
$-3,208
Cash flow
-20.9%
Cash-on-Cash Return
1.5%
Cap rate
0.3%
Rent to Value Ratio
Active
$949,500
3
bds
|
3
ba
|
2,200
sqft
|
built
2007
2047 N Leavitt St, Chicago, IL 60647
$-3,012
Cash flow
-16.6%
Cash-on-Cash Return
2.5%
Cap rate
0.5%
Rent to Value Ratio
Active
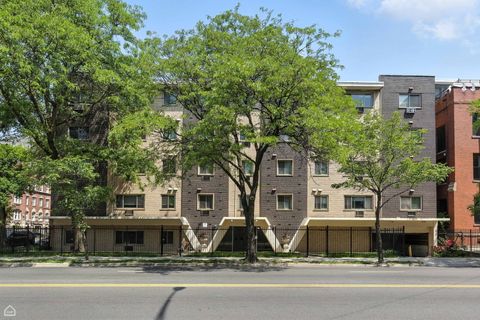
$395,000
3
bds
|
2
ba
|
1,700
sqft
|
built
1958
5801 N Sheridan Rd, Chicago, IL 60660
$-1,904
Cash flow
-25.1%
Cash-on-Cash Return
0.5%
Cap rate
0.6%
Rent to Value Ratio
Active
$250,000
2
bds
|
1
ba
|
1,150
sqft
|
built
1964
6060 N Ridge Ave, Chicago, IL 60660
$-569
Cash flow
-11.9%
Cash-on-Cash Return
3.5%
Cap rate
0.8%
Rent to Value Ratio
Active
$525,000
3
bds
|
4
ba
|
2,400
sqft
|
built
2006
6825 W 64th Pl, Chicago, IL 60638
$-782
Cash flow
-7.8%
Cash-on-Cash Return
4.5%
Cap rate
0.7%
Rent to Value Ratio
Active
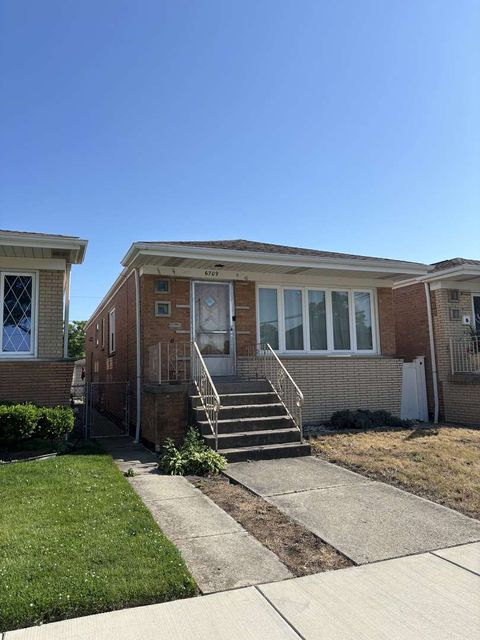
$285,000
3
bds
|
1
ba
|
1,040
sqft
|
built
1962
6709 W 59th St, Chicago, IL 60638
$5
Cash flow
0.1%
Cash-on-Cash Return
6.3%
Cap rate
0.9%
Rent to Value Ratio
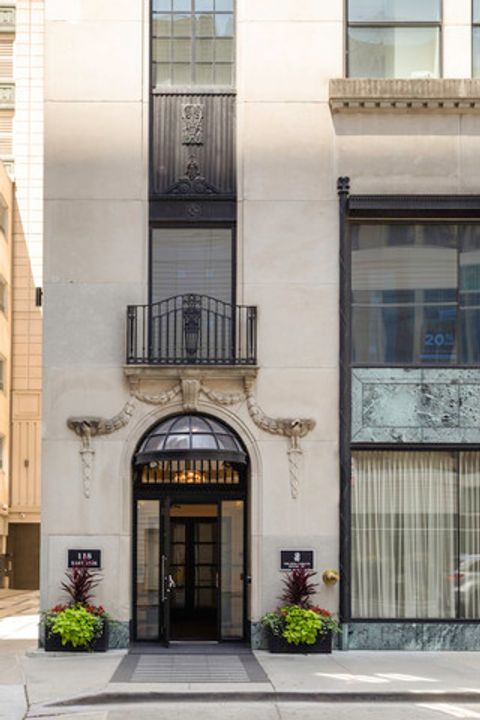
Active
$1,160,000
2
bds
|
3
ba
|
1,912
sqft
|
built
2012
118 E Erie St, Chicago, IL 60611
$-6,773
Cash flow
-30.5%
Cash-on-Cash Return
-0.7%
Cap rate
0.5%
Rent to Value Ratio
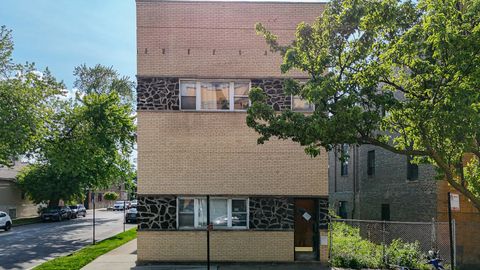
Active
$720,000
9
bds
|
4
ba
|
0
sqft
|
built
1889
2958 S Lowe Ave, Chicago, IL 60616
$-3,311
Cash flow
-24.0%
Cash-on-Cash Return
0.7%
Cap rate
0.3%
Rent to Value Ratio