Cicero, IL Investment Properties for Sale
Browse homes for sale and investment properties in Cicero, IL. Refine your search by price, property type, or more.
Best cash flowing properties in Cicero, IL

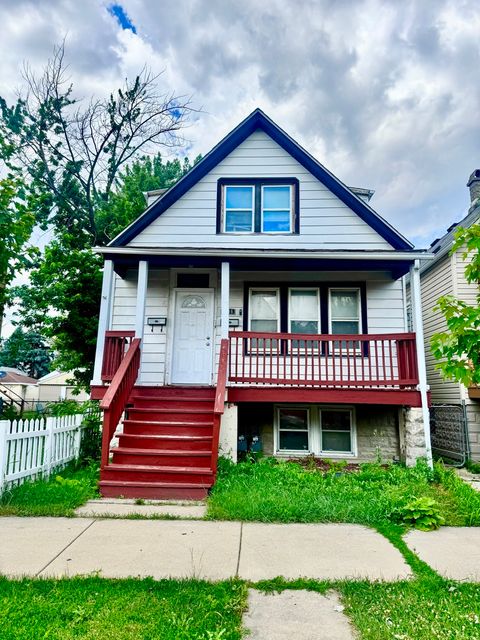
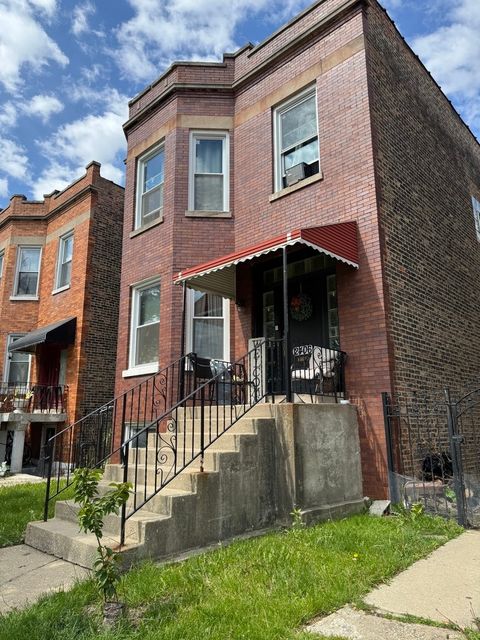
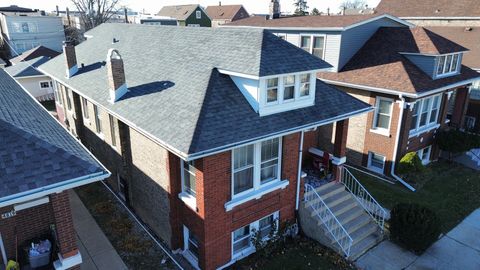
Active
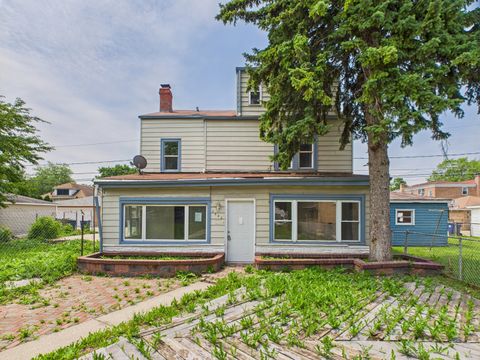
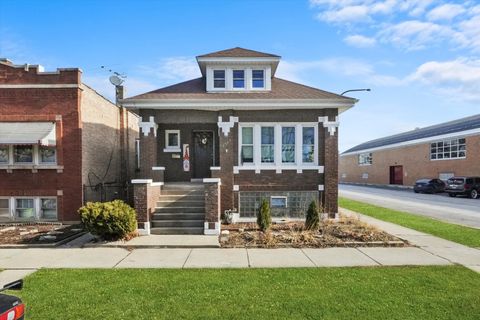
$259,000
4
bds
|
2
ba
|
1,737
sqft
|
built
1922
1912 S 60th Ct, Cicero, IL 60804
$455
Cash flow
9.2%
Cash-on-Cash Return
7.8%
Cap rate
1.0%
Rent to Value Ratio
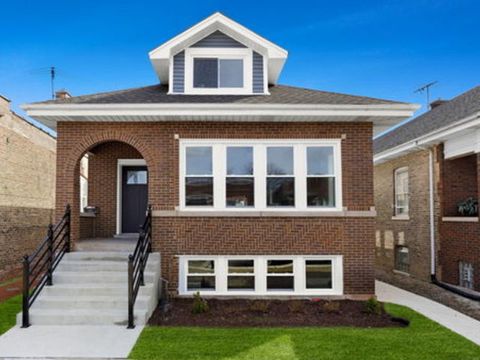
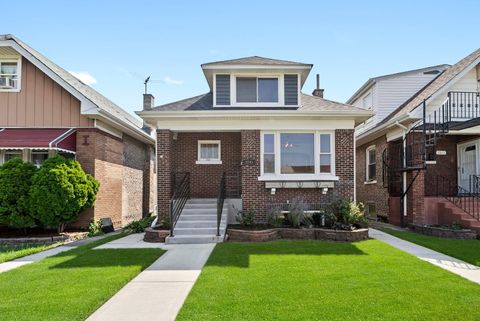
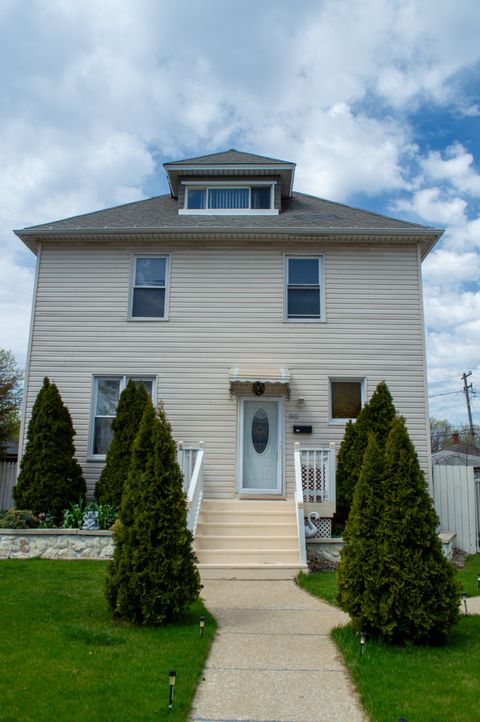
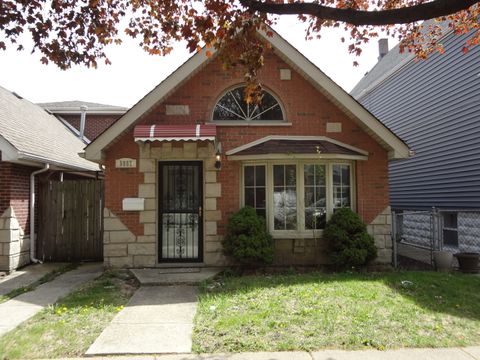
Active
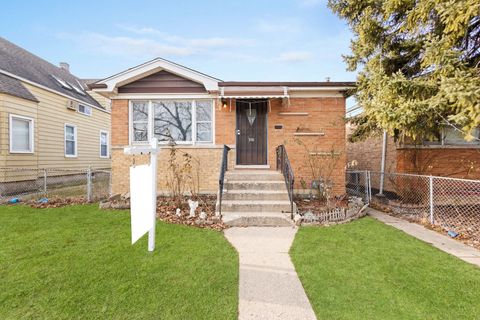
$179,000
4
bds
|
2
ba
|
1,687
sqft
|
built
1927
3632 S 52nd Ct, Cicero, IL 60804
$314
Cash flow
9.2%
Cash-on-Cash Return
7.8%
Cap rate
1.4%
Rent to Value Ratio
37 out of 44 properties for sale in Cicero, IL
Limited Results Shown
Create a free account, or log in to reveal all property listings and enjoy the complete experience.
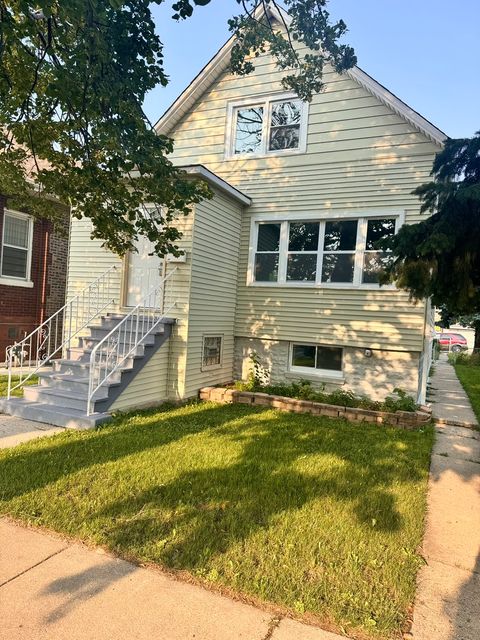
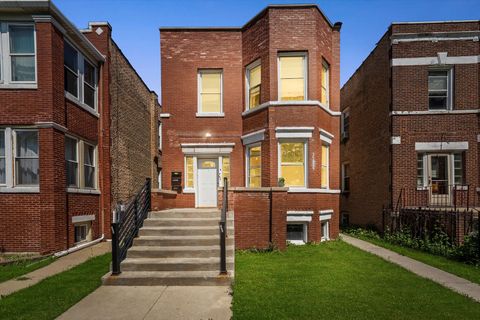
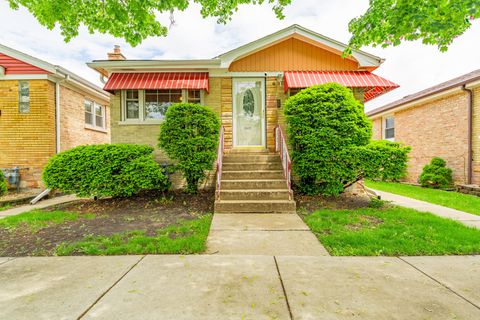
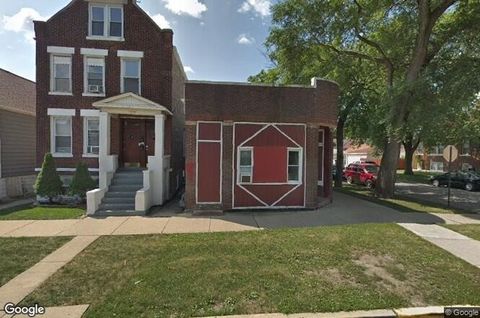
Active
$449,000
3
bds
|
2
ba
|
3,600
sqft
|
built
1918
2407 S 60th Ct, Cicero, IL 60804
$-603
Cash flow
-7.0%
Cash-on-Cash Return
4.1%
Cap rate
0.5%
Rent to Value Ratio
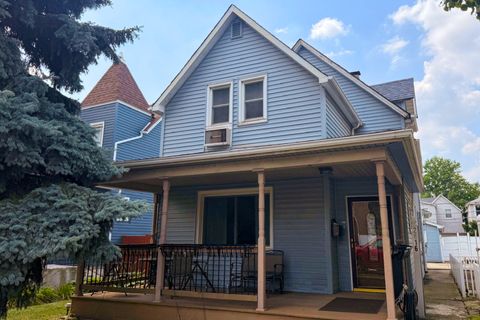
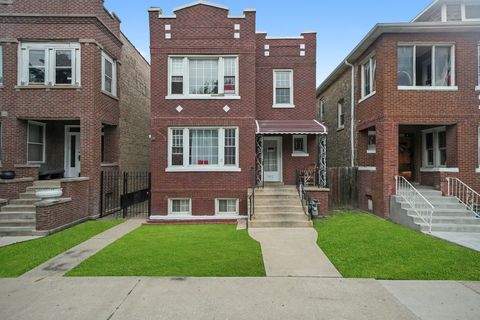
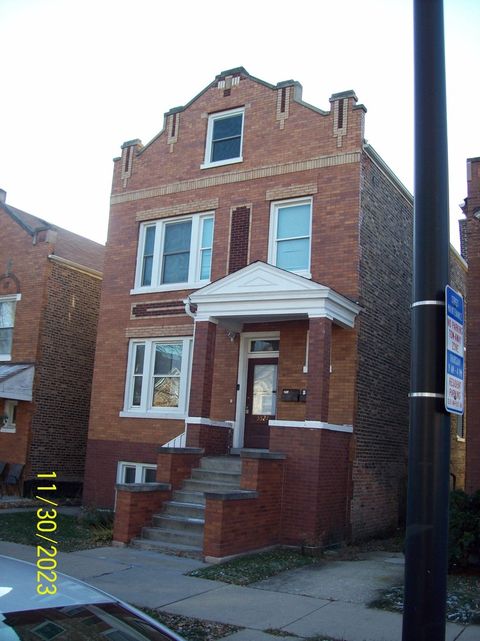
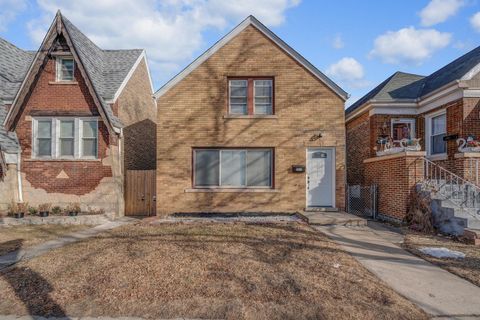
Active
$349,900
3
bds
|
3
ba
|
1,782
sqft
|
built
1906
3215 S 54th Ct, Cicero, IL 60804
$-896
Cash flow
-13.4%
Cash-on-Cash Return
2.6%
Cap rate
0.6%
Rent to Value Ratio

Active
$250,000
2
bds
|
2
ba
|
1,100
sqft
|
built
1946
3524 S Central Ave, Cicero, IL 60804
$-217
Cash flow
-4.5%
Cash-on-Cash Return
4.6%
Cap rate
0.8%
Rent to Value Ratio

Active
$220,000
3
bds
|
1
ba
|
1,151
sqft
|
built
1920
2419 S Lombard Ave, Cicero, IL 60804
$110
Cash flow
2.6%
Cash-on-Cash Return
6.3%
Cap rate
1.0%
Rent to Value Ratio
Active
$275,000
4
bds
|
2
ba
|
1,571
sqft
|
built
1888
2816 S Austin Blvd, Cicero, IL 60804
$-166
Cash flow
-3.1%
Cash-on-Cash Return
5.0%
Cap rate
0.8%
Rent to Value Ratio

Active
$615,000
8
bds
|
4
ba
|
0
sqft
|
built
1926
5501 W 24th St, Cicero, IL 60804
$-2,292
Cash flow
-19.4%
Cash-on-Cash Return
1.2%
Cap rate
0.3%
Rent to Value Ratio

Active
$199,832
2
bds
|
2
ba
|
1,031
sqft
|
built
1908
1832 S Central Ave, Cicero, IL 60804
$-17
Cash flow
-0.4%
Cash-on-Cash Return
5.6%
Cap rate
1.0%
Rent to Value Ratio

Active
$399,000
6
bds
|
2
ba
|
0
sqft
|
built
1931
1438 S 50th Ave, Cicero, IL 60804
$-1,314
Cash flow
-17.2%
Cash-on-Cash Return
1.7%
Cap rate
0.5%
Rent to Value Ratio
Active
$330,000
5
bds
|
2
ba
|
0
sqft
|
built
1908
4916 W 29th St, Cicero, IL 60804
$-914
Cash flow
-14.5%
Cash-on-Cash Return
2.4%
Cap rate
0.5%
Rent to Value Ratio

Active
$285,000
2
bds
|
2
ba
|
966
sqft
|
built
1948
3719 S Austin Blvd, Cicero, IL 60804
$-490
Cash flow
-9.0%
Cash-on-Cash Return
3.6%
Cap rate
0.7%
Rent to Value Ratio

Active
$240,000
3
bds
|
1
ba
|
1,903
sqft
|
built
1908
2936 S 48th Ct, Cicero, IL 60804
$-339
Cash flow
-7.4%
Cash-on-Cash Return
4.0%
Cap rate
0.8%
Rent to Value Ratio

Active
$399,999
5
bds
|
3
ba
|
0
sqft
|
built
1908
1333 S 57th Ave, Cicero, IL 60804
$-957
Cash flow
-12.5%
Cash-on-Cash Return
2.8%
Cap rate
0.6%
Rent to Value Ratio

Active
$430,000
6
bds
|
2
ba
|
0
sqft
|
built
1917
1342 S 57th Ave, Cicero, IL 60804
$-1,473
Cash flow
-17.9%
Cash-on-Cash Return
1.6%
Cap rate
0.5%
Rent to Value Ratio

Active
$539,900
4
bds
|
5
ba
|
3,100
sqft
|
built
1925
3116 S 55th Ave, Cicero, IL 60804
$-1,930
Cash flow
-18.7%
Cash-on-Cash Return
1.4%
Cap rate
0.3%
Rent to Value Ratio
Active
$379,900
3
bds
|
2
ba
|
1,614
sqft
|
built
1923
3141 S 54th Ct, Cicero, IL 60804
$-681
Cash flow
-9.4%
Cash-on-Cash Return
3.5%
Cap rate
0.6%
Rent to Value Ratio

Active
$199,900
2
bds
|
1
ba
|
1,358
sqft
|
built
1943
3736 S 58th Ave, Cicero, IL 60804
$67
Cash flow
1.7%
Cash-on-Cash Return
6.1%
Cap rate
1.0%
Rent to Value Ratio

Active
$449,999
5
bds
|
3
ba
|
1,328
sqft
|
built
1931
1215 S 58th Ct, Cicero, IL 60804
$-1,098
Cash flow
-12.7%
Cash-on-Cash Return
2.8%
Cap rate
0.5%
Rent to Value Ratio

Active
$305,000
4
bds
|
3
ba
|
1,745
sqft
|
built
1947
3615 S 59th Ct, Cicero, IL 60804
$-329
Cash flow
-5.6%
Cash-on-Cash Return
4.4%
Cap rate
0.8%
Rent to Value Ratio
Active
$399,500
4
bds
|
3
ba
|
0
sqft
|
built
1915
1911 S 49th Ave, Cicero, IL 60804
$-1,523
Cash flow
-19.9%
Cash-on-Cash Return
1.1%
Cap rate
0.5%
Rent to Value Ratio

Active
$369,000
5
bds
|
2
ba
|
0
sqft
|
built
1916
1304 S 50th Ave, Cicero, IL 60804
$-1,375
Cash flow
-19.4%
Cash-on-Cash Return
1.2%
Cap rate
0.4%
Rent to Value Ratio
Active
$420,000
4
bds
|
3
ba
|
0
sqft
|
built
1922
1802 S 50th Ave, Cicero, IL 60804
$-1,081
Cash flow
-13.4%
Cash-on-Cash Return
2.6%
Cap rate
0.6%
Rent to Value Ratio

Active
$334,900
3
bds
|
2
ba
|
1,625
sqft
|
built
1903
4817 W 28th St, Cicero, IL 60804
$-469
Cash flow
-7.3%
Cash-on-Cash Return
4.0%
Cap rate
0.6%
Rent to Value Ratio
Active
$345,000
6
bds
|
2
ba
|
0
sqft
|
built
1912
2406 S 50th Ave, Cicero, IL 60804
$-808
Cash flow
-12.2%
Cash-on-Cash Return
2.9%
Cap rate
0.6%
Rent to Value Ratio
Active
$310,000
5
bds
|
2
ba
|
2,550
sqft
|
built
1898
2632 S Austin Blvd, Cicero, IL 60804
$-231
Cash flow
-3.9%
Cash-on-Cash Return
4.8%
Cap rate
0.9%
Rent to Value Ratio
Active
$324,900
3
bds
|
2
ba
|
1,956
sqft
|
built
1958
3631 S 54th Ave, Cicero, IL 60804
$-336
Cash flow
-5.4%
Cash-on-Cash Return
4.4%
Cap rate
0.8%
Rent to Value Ratio
Active
$349,900
2
bds
|
2
ba
|
0
sqft
|
built
1913
5527 W 24th Pl, Cicero, IL 60804
$-1,479
Cash flow
-22.1%
Cash-on-Cash Return
0.6%
Cap rate
0.4%
Rent to Value Ratio
Active
$275,000
3
bds
|
2
ba
|
1,667
sqft
|
built
1919
4821 W 24th St, Cicero, IL 60804
$-310
Cash flow
-5.9%
Cash-on-Cash Return
4.3%
Cap rate
0.8%
Rent to Value Ratio
Active
$349,900
3
bds
|
3
ba
|
1,653
sqft
|
built
2007
5057 W 32nd Pl, Cicero, IL 60804
$-530
Cash flow
-7.9%
Cash-on-Cash Return
3.9%
Cap rate
0.7%
Rent to Value Ratio

Active
$360,000
5
bds
|
3
ba
|
0
sqft
|
built
1928
1622 S 48th Ct, Cicero, IL 60804
$-973
Cash flow
-14.1%
Cash-on-Cash Return
2.4%
Cap rate
0.6%
Rent to Value Ratio
Active
$379,900
6
bds
|
3
ba
|
0
sqft
|
built
1927
5241 W 30th St, Cicero, IL 60804
$-1,430
Cash flow
-19.6%
Cash-on-Cash Return
1.2%
Cap rate
0.5%
Rent to Value Ratio
Active
$384,000
5
bds
|
2
ba
|
2,236
sqft
|
built
1952
1615 S Central Ave, Cicero, IL 60804
$304
Cash flow
4.1%
Cash-on-Cash Return
6.6%
Cap rate
0.8%
Rent to Value Ratio
Active
$325,000
3
bds
|
2
ba
|
1,456
sqft
|
built
1923
2345 S 59th Ct, Cicero, IL 60804
$-198
Cash flow
-3.2%
Cash-on-Cash Return
4.9%
Cap rate
0.9%
Rent to Value Ratio
Active
$300,000
3
bds
|
1
ba
|
1,008
sqft
|
built
1960
3606 S 53rd Ct, Cicero, IL 60804
$-309
Cash flow
-5.4%
Cash-on-Cash Return
4.4%
Cap rate
0.8%
Rent to Value Ratio
Active
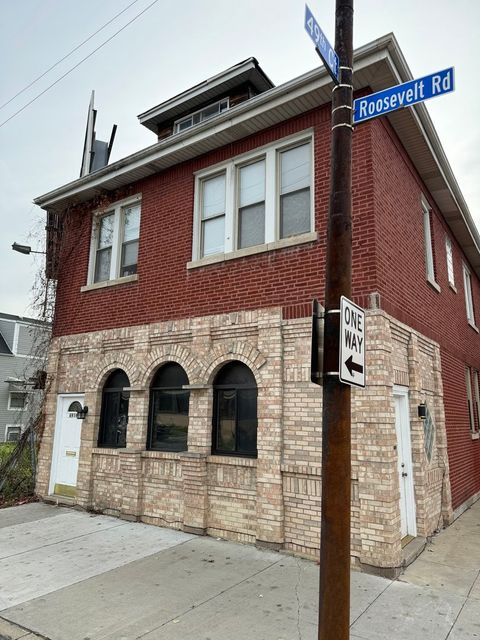
$490,000
9
bds
|
3
ba
|
0
sqft
|
built
1928
4919 W Roosevelt Rd, Cicero, IL 60804
$-1,515
Cash flow
-16.1%
Cash-on-Cash Return
2.0%
Cap rate
0.4%
Rent to Value Ratio
Active
$294,900
4
bds
|
2
ba
|
0
sqft
|
built
1911
1900 S 57th Ct, Cicero, IL 60804
$-666
Cash flow
-11.8%
Cash-on-Cash Return
3.0%
Cap rate
0.6%
Rent to Value Ratio