Boulder County Investment Properties for Sale
Browse homes for sale and investment properties in Boulder County. Refine your search by price, property type, or more.
Best cash flowing properties in Boulder County
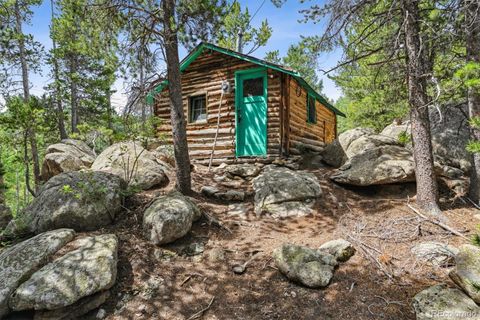
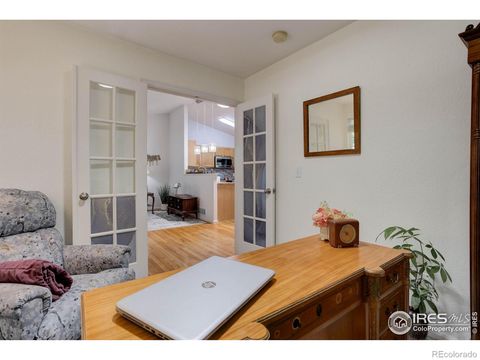
Active
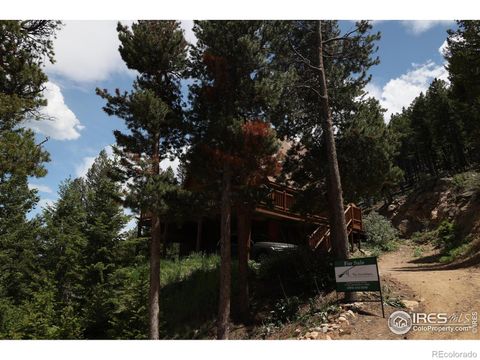
$200,000
1
bds
|
0
ba
|
252
sqft
|
built
1930
306 Olde Carter Lake Rd, Golden, CO 80403
$265
Cash flow
6.9%
Cash-on-Cash Return
7.3%
Cap rate
0.9%
Rent to Value Ratio
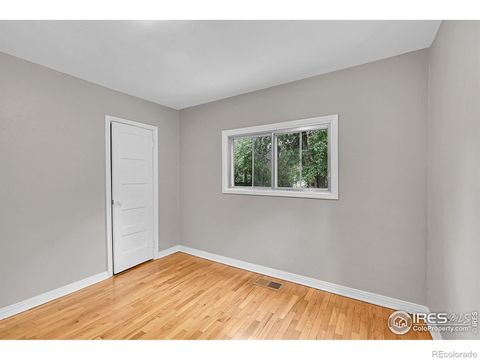
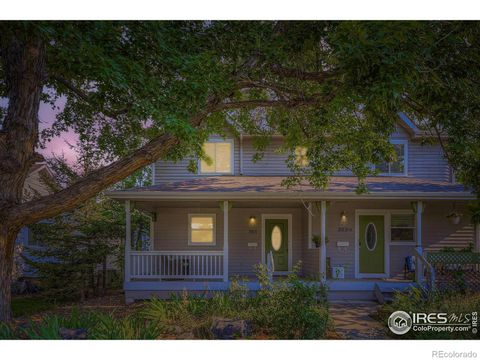
Active
$430,000
2
bds
|
1
ba
|
1,152
sqft
|
built
1949
746 Sumner St, Longmont, CO 80501
$-511
Cash flow
-6.2%
Cash-on-Cash Return
4.3%
Cap rate
0.6%
Rent to Value Ratio
961 out of 1,051 properties for sale in Boulder County
Limited Results Shown
Create a free account, or log in to reveal all property listings and enjoy the complete experience.
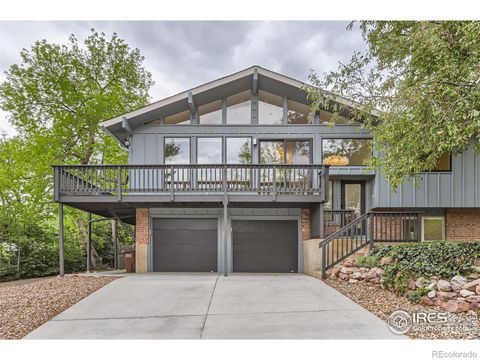
Active
$1,650,000
4
bds
|
3
ba
|
2,224
sqft
|
built
1967
3410 Heidelberg Dr, Boulder, CO 80305
$-5,750
Cash flow
-18.2%
Cash-on-Cash Return
1.5%
Cap rate
0.2%
Rent to Value Ratio

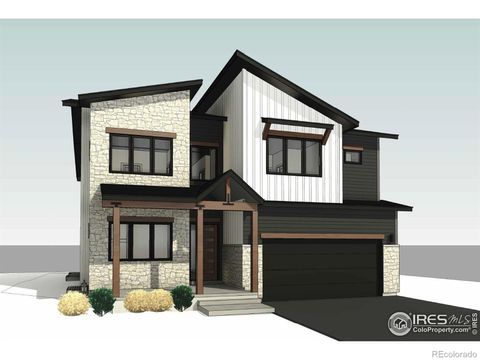
Active
$438,000
3
bds
|
4
ba
|
1,605
sqft
|
built
2019
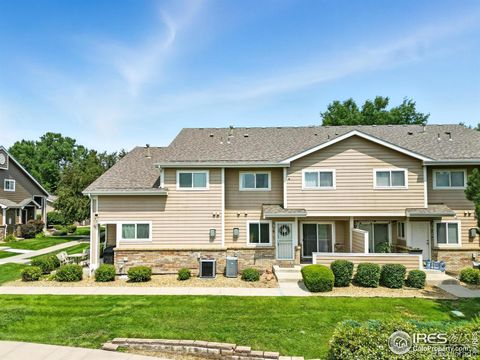
1240 Wren Ct, Longmont, CO 80501
$-1,015
Cash flow
-12.1%
Cash-on-Cash Return
2.9%
Cap rate
0.5%
Rent to Value Ratio
Active
$1,925,000
4
bds
|
5
ba
|
4,233
sqft
|
built
2026
1039 Turnberry Cir, Louisville, CO 80027
$-6,573
Cash flow
-17.8%
Cash-on-Cash Return
1.6%
Cap rate
0.2%
Rent to Value Ratio

Active
$650,000
4
bds
|
3
ba
|
2,657
sqft
|
built
1983
1506 Fisk Ct, Longmont, CO 80503
$-1,239
Cash flow
-9.9%
Cash-on-Cash Return
3.4%
Cap rate
0.5%
Rent to Value Ratio

Active
$2,195,000
4
bds
|
4
ba
|
4,759
sqft
|
built
1992
5302 Pinehurst Dr, Boulder, CO 80301
$-7,635
Cash flow
-18.1%
Cash-on-Cash Return
1.5%
Cap rate
0.2%
Rent to Value Ratio

Active
$1,650,000
4
bds
|
3
ba
|
3,267
sqft
|
built
1910
1717 Iris Ave, Boulder, CO 80304
$-4,351
Cash flow
-13.8%
Cash-on-Cash Return
2.5%
Cap rate
0.4%
Rent to Value Ratio

Active
$2,750,000
5
bds
|
5
ba
|
5,390
sqft
|
built
2010
820 Peakview Rd, Boulder, CO 80302
$-8,183
Cash flow
-15.5%
Cash-on-Cash Return
2.1%
Cap rate
0.3%
Rent to Value Ratio

Active
$345,000
3
bds
|
2
ba
|
1,320
sqft
|
built
2017
804 Summer Hawk Dr, Longmont, CO 80504
$-616
Cash flow
-9.3%
Cash-on-Cash Return
3.5%
Cap rate
0.7%
Rent to Value Ratio
Active
$2,250,000
3
bds
|
2
ba
|
2,532
sqft
|
built
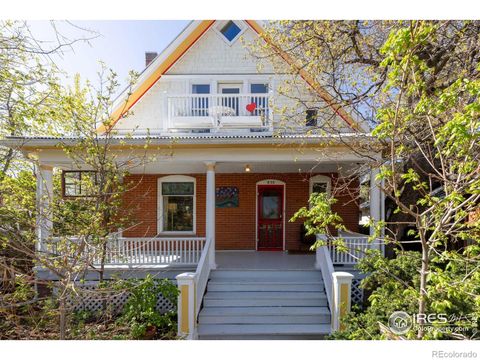
1904
838 University Ave, Boulder, CO 80302
$-8,050
Cash flow
-18.7%
Cash-on-Cash Return
1.4%
Cap rate
0.2%
Rent to Value Ratio
Active
$580,000
1
bds
|
1
ba
|
717
sqft
|
built
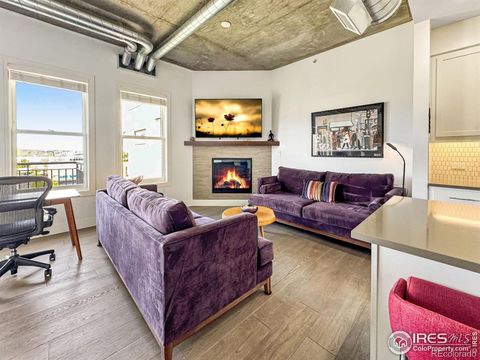
2006
3401 Arapahoe Ave, Boulder, CO 80303
$-1,632
Cash flow
-14.7%
Cash-on-Cash Return
2.3%
Cap rate
0.4%
Rent to Value Ratio
Active
$1,199,900
5
bds
|
4
ba
|
3,661
sqft
|
built
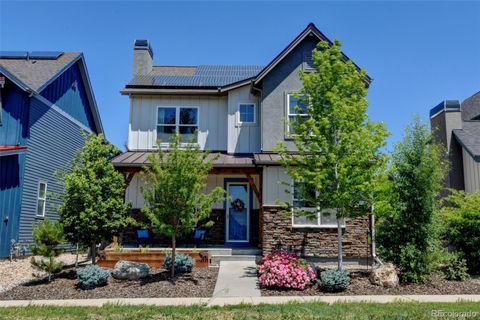
2009
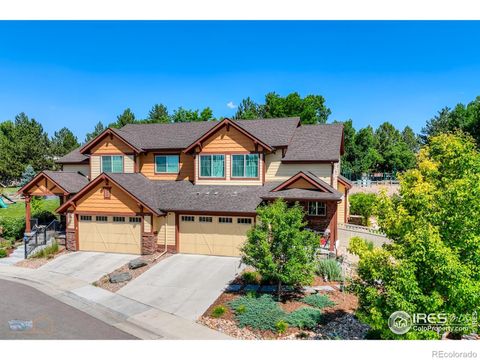
1362 Golden Eagle Way, Louisville, CO 80027
$-2,901
Cash flow
-12.6%
Cash-on-Cash Return
2.8%
Cap rate
0.4%
Rent to Value Ratio
Active
$1,224,000
3
bds
|
2
ba
|
1,800
sqft
|
built
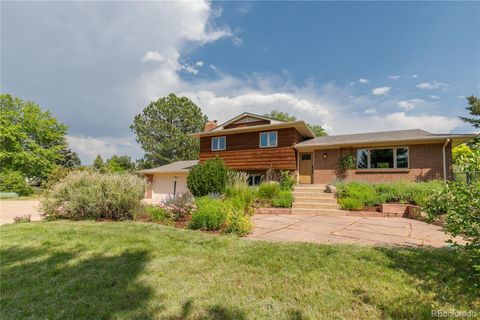
1967
8836 Marathon Rd, Niwot, CO 80503
$-3,680
Cash flow
-15.7%
Cash-on-Cash Return
2.1%
Cap rate
0.3%
Rent to Value Ratio

Active
$1,395,000
5
bds
|
4
ba
|
4,478
sqft
|
built
2019
885 Delechant Dr, Erie, CO 80516
$-4,623
Cash flow
-17.3%
Cash-on-Cash Return
1.7%
Cap rate
0.3%
Rent to Value Ratio
Active
$612,900
3
bds
|
2
ba
|
1,936
sqft
|
built
2001
1673 Bain Dr, Erie, CO 80516
$-1,520
Cash flow
-12.9%
Cash-on-Cash Return
2.7%
Cap rate
0.4%
Rent to Value Ratio
Active
$550,000
3
bds
|
1
ba
|
1,752
sqft
|
built
1915
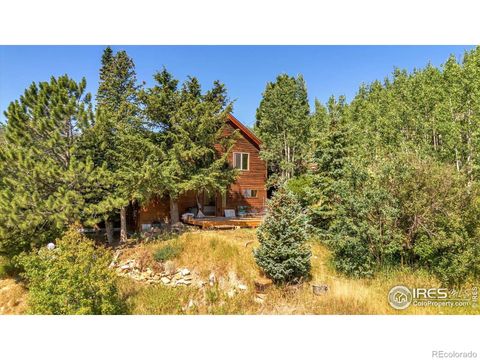
57 Nelson St, Ward, CO 80481
$-585
Cash flow
-5.5%
Cash-on-Cash Return
4.4%
Cap rate
0.6%
Rent to Value Ratio
Active
$625,000
3
bds
|
3
ba
|
1,302
sqft
|
built
2003
303 E Geneseo St, Lafayette, CO 80026
$-1,336
Cash flow
-11.2%
Cash-on-Cash Return
3.1%
Cap rate
0.4%
Rent to Value Ratio
Active
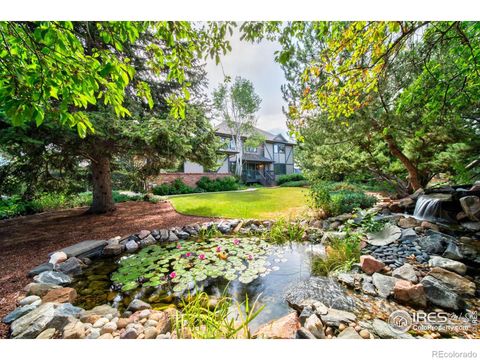
$895,000
4
bds
|
3
ba
|
2,508
sqft
|
built
2017
2005 Aster Ln, Lafayette, CO 80026
$-2,210
Cash flow
-12.9%
Cash-on-Cash Return
2.7%
Cap rate
0.4%
Rent to Value Ratio

Active
$940,000
5
bds
|
4
ba
|
3,715
sqft
|
built
1995
375 Pika Pt, Lafayette, CO 80026
$-2,203
Cash flow
-12.2%
Cash-on-Cash Return
2.9%
Cap rate
0.4%
Rent to Value Ratio

Active
$680,000
4
bds
|
3
ba
|
2,456
sqft
|
built
2002
687 S Beshear Ct, Erie, CO 80516
$-1,659
Cash flow
-12.7%
Cash-on-Cash Return
2.8%
Cap rate
0.4%
Rent to Value Ratio

Active
$2,750,000
4
bds
|
2
ba
|
1,380
sqft
|
built
1920
1580 Redwood Ave, Boulder, CO 80304
$-10,777
Cash flow
-20.4%
Cash-on-Cash Return
1.0%
Cap rate
0.1%
Rent to Value Ratio
Active
$875,000
4
bds
|
3
ba
|
1,782
sqft
|
built
1975
1620 Bradley Ct, Boulder, CO 80305
$-2,716
Cash flow
-16.2%
Cash-on-Cash Return
2.0%
Cap rate
0.4%
Rent to Value Ratio
Active
$989,000
4
bds
|
4
ba
|
2,024
sqft
|
built
2001
611 Tantra Dr, Boulder, CO 80305
$-3,150
Cash flow
-16.6%
Cash-on-Cash Return
1.9%
Cap rate
0.4%
Rent to Value Ratio
Active
$2,950,000
3
bds
|
3
ba
|
2,450
sqft
|
built
1969
1006 6th St, Boulder, CO 80302
$-10,449
Cash flow
-18.5%
Cash-on-Cash Return
1.4%
Cap rate
0.2%
Rent to Value Ratio

Active
$749,900
2
bds
|
2
ba
|
1,704
sqft
|
built
1985
2938 Kalmia Ave, Boulder, CO 80301
$-2,248
Cash flow
-15.6%
Cash-on-Cash Return
2.1%
Cap rate
0.5%
Rent to Value Ratio
Active
$2,695,000
3
bds
|
3
ba
|
2,655
sqft
|
built
1950
580 Pleasant St, Boulder, CO 80302
$-8,220
Cash flow
-15.9%
Cash-on-Cash Return
2.0%
Cap rate
0.3%
Rent to Value Ratio
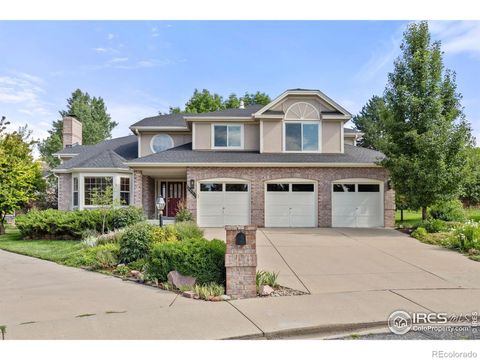
Active
$1,349,000
4
bds
|
3
ba
|
3,383
sqft
|
built
1989
4521 Northfield Ct, Boulder, CO 80301
$-3,999
Cash flow
-15.5%
Cash-on-Cash Return
2.1%
Cap rate
0.3%
Rent to Value Ratio
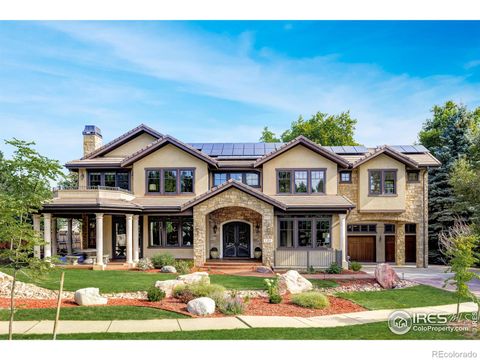
Active
$5,850,000
5
bds
|
6
ba
|
8,222
sqft
|
built
2008
1285 Meadow Pl, Boulder, CO 80304
$-26,169
Cash flow
-23.3%
Cash-on-Cash Return
0.3%
Cap rate
0.1%
Rent to Value Ratio
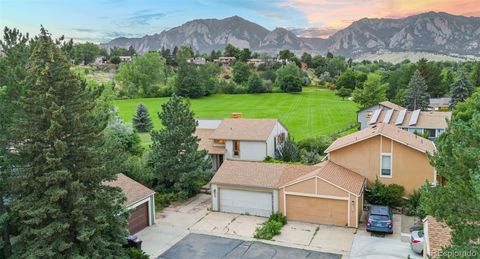
Active
$1,100,000
4
bds
|
2
ba
|
1,820
sqft
|
built
1978
4814 W Moorhead Cir, Boulder, CO 80305
$-3,330
Cash flow
-15.8%
Cash-on-Cash Return
2.0%
Cap rate
0.3%
Rent to Value Ratio
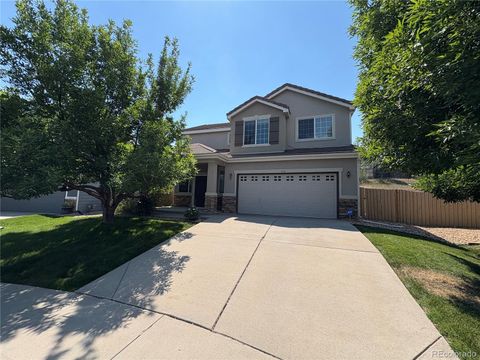
Active
$759,900
3
bds
|
3
ba
|
1,898
sqft
|
built
2003
910 Humboldt Way, Superior, CO 80027
$-2,138
Cash flow
-14.7%
Cash-on-Cash Return
2.3%
Cap rate
0.4%
Rent to Value Ratio
Active
$3,950,000
4
bds
|
4
ba
|
4,131
sqft
|
built
1991
10077 N 75th St, Longmont, CO 80503
$-13,445
Cash flow
-17.8%
Cash-on-Cash Return
1.6%
Cap rate
0.2%
Rent to Value Ratio
Active
$455,000
2
bds
|
2
ba
|
966
sqft
|
built
1983
6233 Willow Ln, Boulder, CO 80301
$-1,263
Cash flow
-14.5%
Cash-on-Cash Return
2.3%
Cap rate
0.5%
Rent to Value Ratio
Active
$2,200,000
6
bds
|
6
ba
|
5,684
sqft
|
built
2006
13147 Woodridge Dr, Longmont, CO 80504
$-6,794
Cash flow
-16.1%
Cash-on-Cash Return
2.0%
Cap rate
0.3%
Rent to Value Ratio
Active
$600,000
4
bds
|
2
ba
|
1,366
sqft
|
built
1972
4466 Driftwood Pl, Boulder, CO 80301
$-1,014
Cash flow
-8.8%
Cash-on-Cash Return
3.7%
Cap rate
0.5%
Rent to Value Ratio
Active
$380,000
3
bds
|
4
ba
|
1,798
sqft
|
built
2000
1601 Great Western Dr, Longmont, CO 80501
$-859
Cash flow
-11.8%
Cash-on-Cash Return
3.0%
Cap rate
0.6%
Rent to Value Ratio
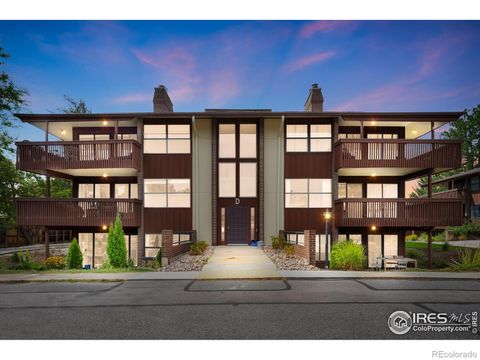
Active
$439,000
2
bds
|
2
ba
|
1,112
sqft
|
built
1969
500 Manhattan Dr, Boulder, CO 80303
$-1,420
Cash flow
-16.9%
Cash-on-Cash Return
1.8%
Cap rate
0.5%
Rent to Value Ratio
Active
$1,279,950
5
bds
|
4
ba
|
3,312
sqft
|
built
1989
9020 Rogers Rd, Longmont, CO 80503
$-3,877
Cash flow
-15.8%
Cash-on-Cash Return
2.0%
Cap rate
0.3%
Rent to Value Ratio
Active
$859,000
4
bds
|
2
ba
|
1,860
sqft
|
built
1988
254 Arrowood Dr, Lyons, CO 80540
$-2,243
Cash flow
-13.6%
Cash-on-Cash Return
2.5%
Cap rate
0.3%
Rent to Value Ratio
Active
$599,000
4
bds
|
3
ba
|
1,868
sqft
|
built
1971
1536 S Terry St, Longmont, CO 80501
$-1,330
Cash flow
-11.6%
Cash-on-Cash Return
3.0%
Cap rate
0.4%
Rent to Value Ratio