Boulder County Investment Properties for Sale
Browse homes for sale and investment properties in Boulder County. Refine your search by price, property type, or more.
Best cash flowing properties in Boulder County
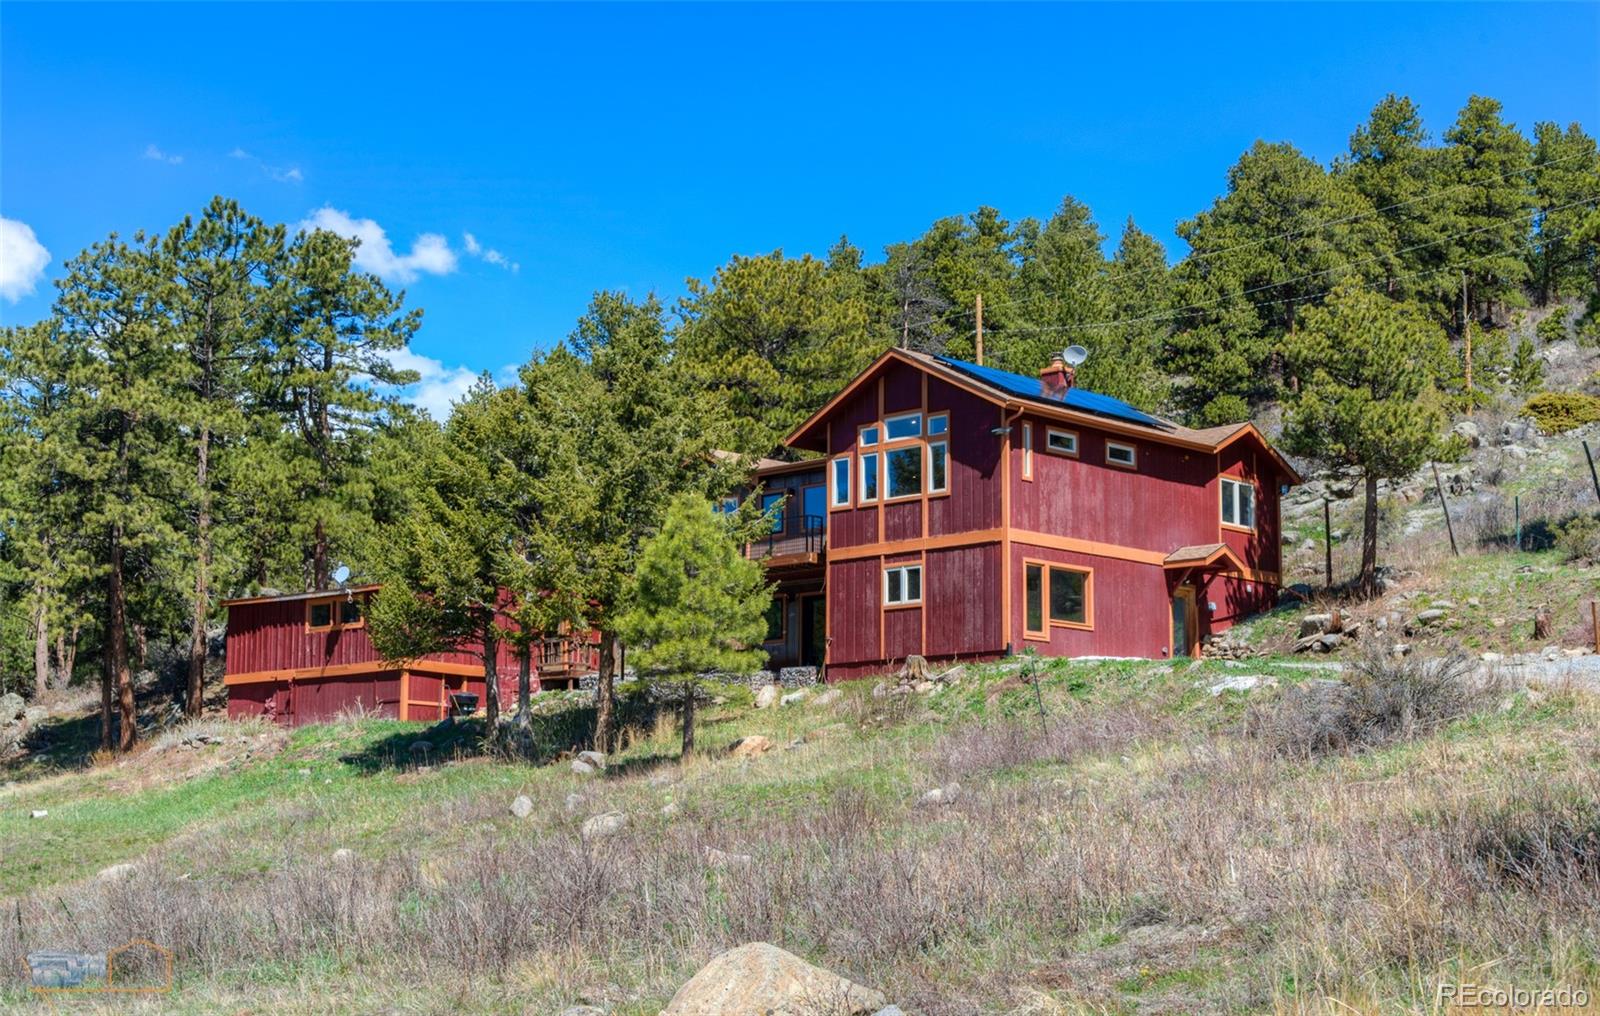
Active
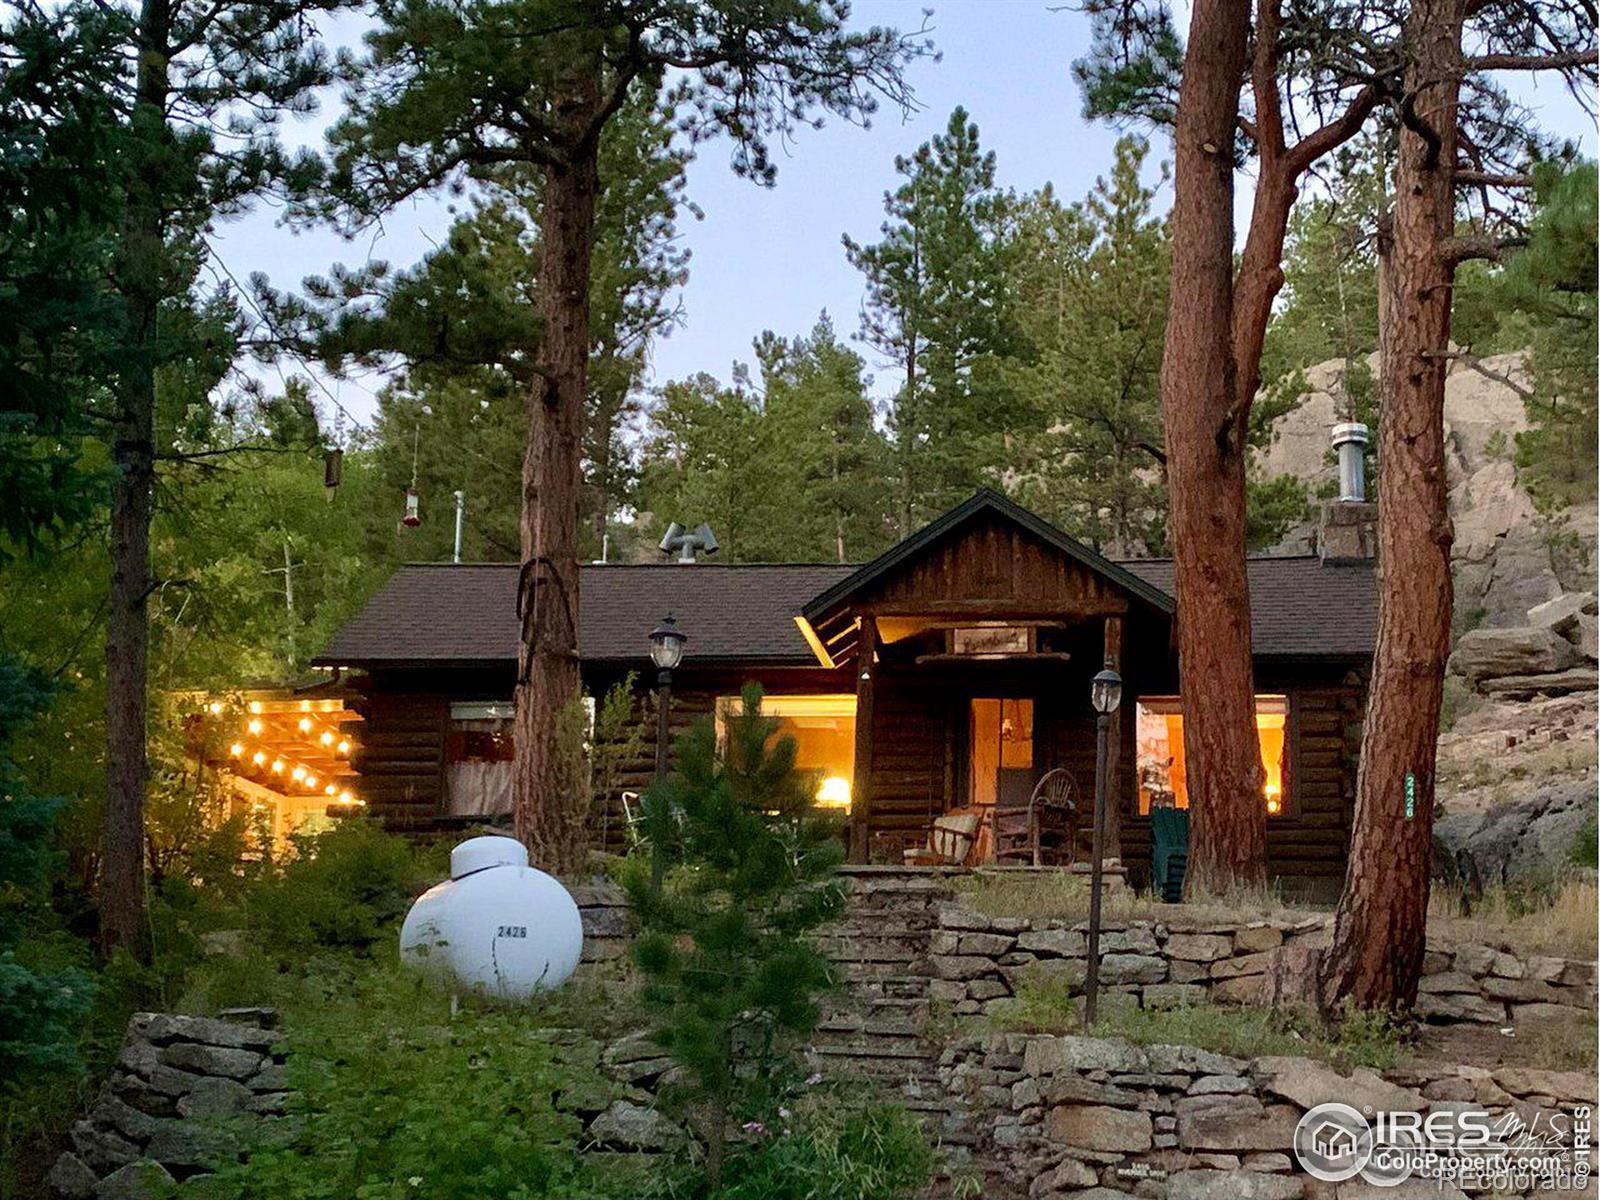
$399,000
2
bds
|
1
ba
|
800
sqft
|
built
1930
2426 Riverside Dr, Lyons, CO 80540
$-569
Cash flow
-7.4%
Cash-on-Cash Return
4.6%
Cap rate
0.6%
Rent to Value Ratio
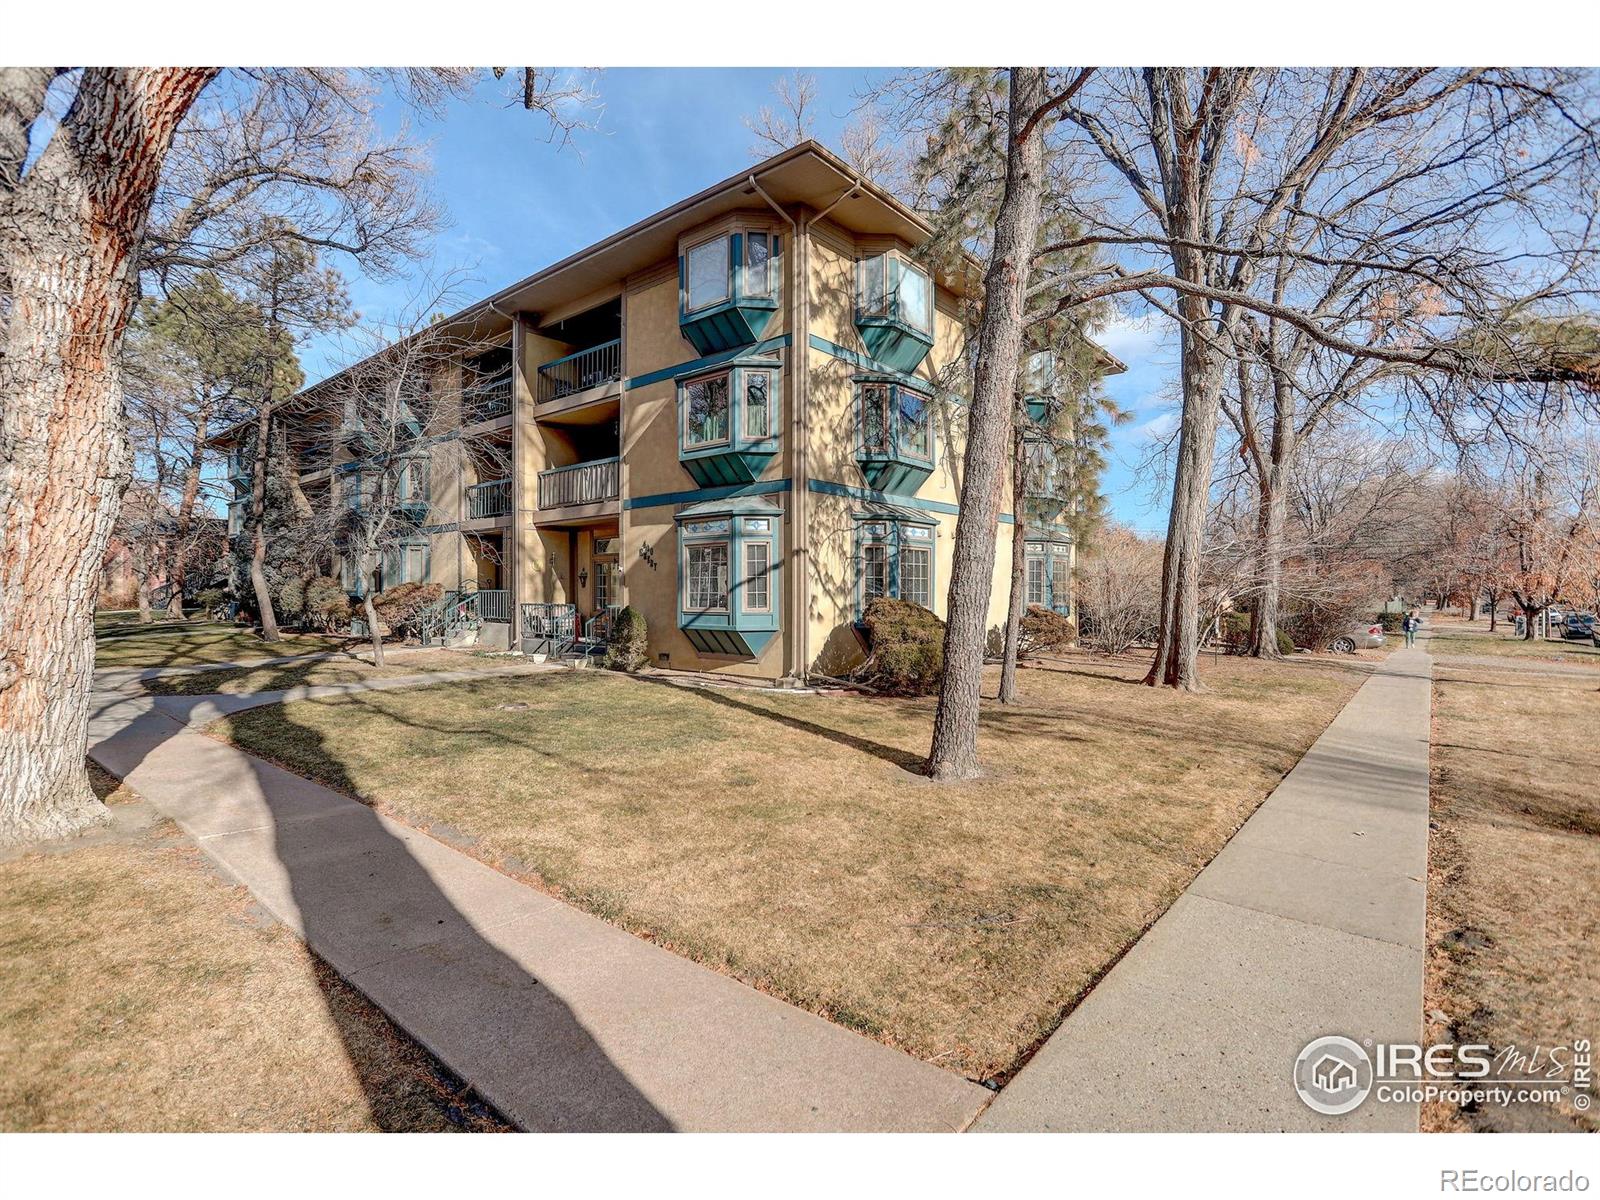
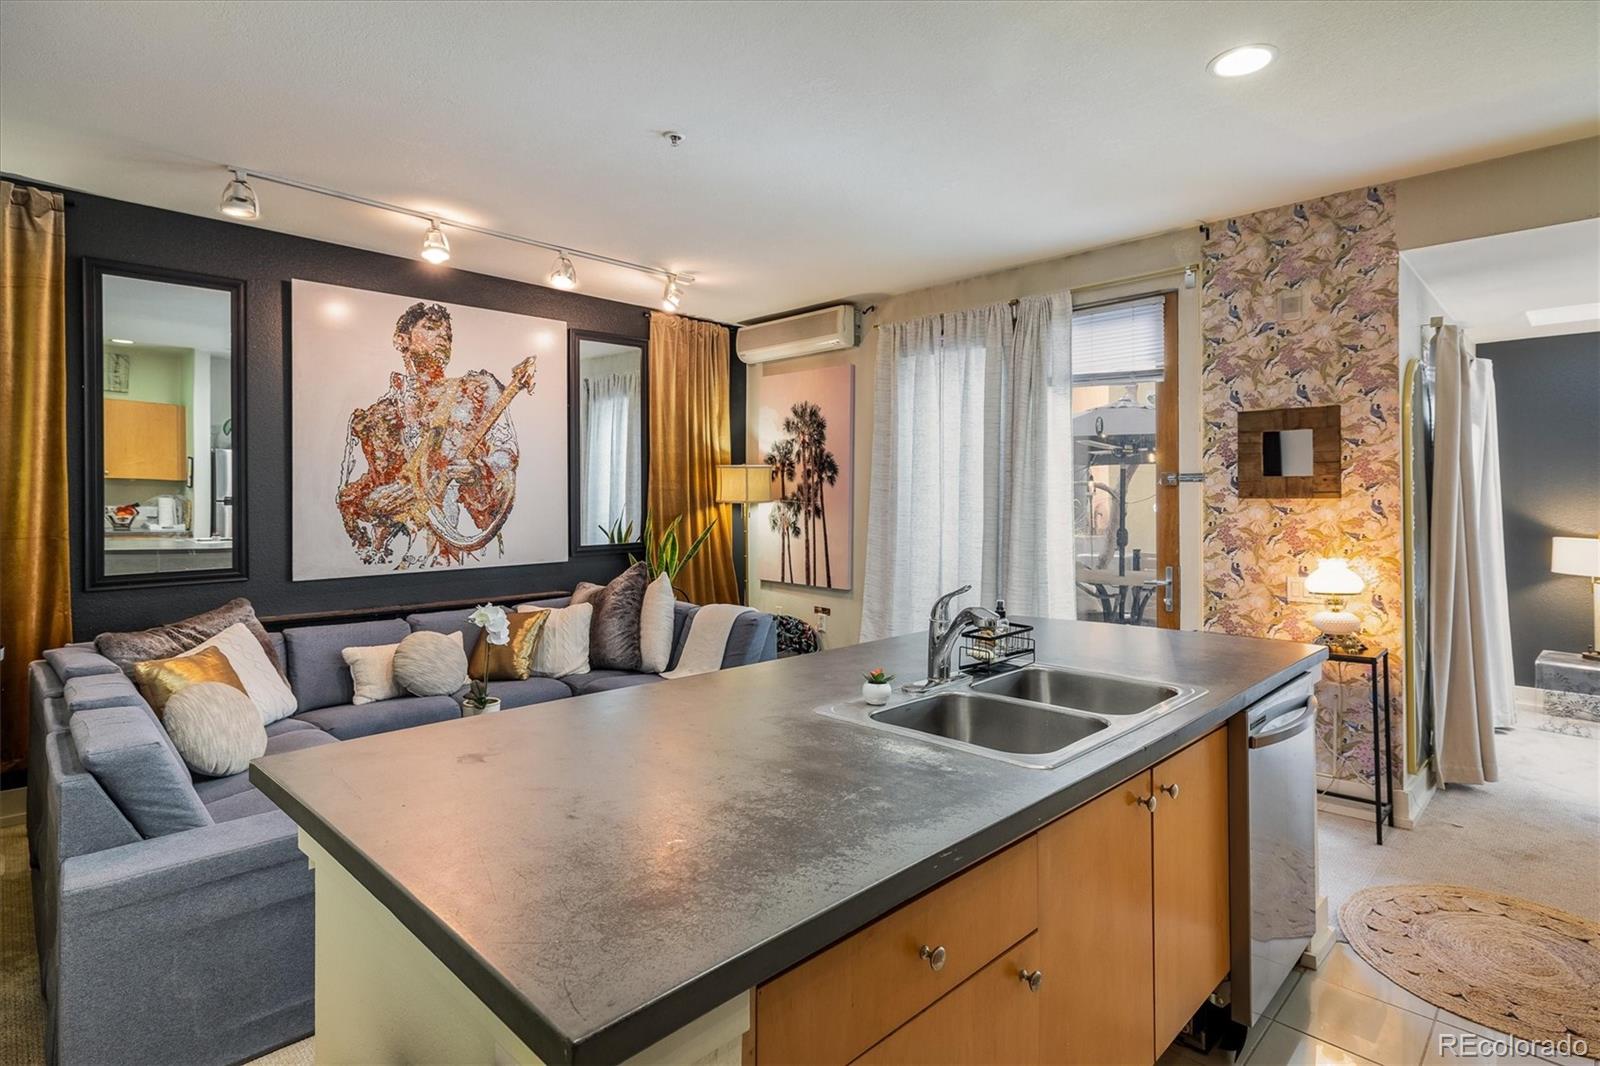
Active
$284,900
1
bds
|
1
ba
|
816
sqft
|
built
1981
400 Emery St, Longmont, CO 80501
$-746
Cash flow
-13.7%
Cash-on-Cash Return
3.1%
Cap rate
0.6%
Rent to Value Ratio
1,200 out of 1,340 properties for sale in Boulder County
Limited Results Shown
Create a free account, or log in to reveal all property listings and enjoy the complete experience.
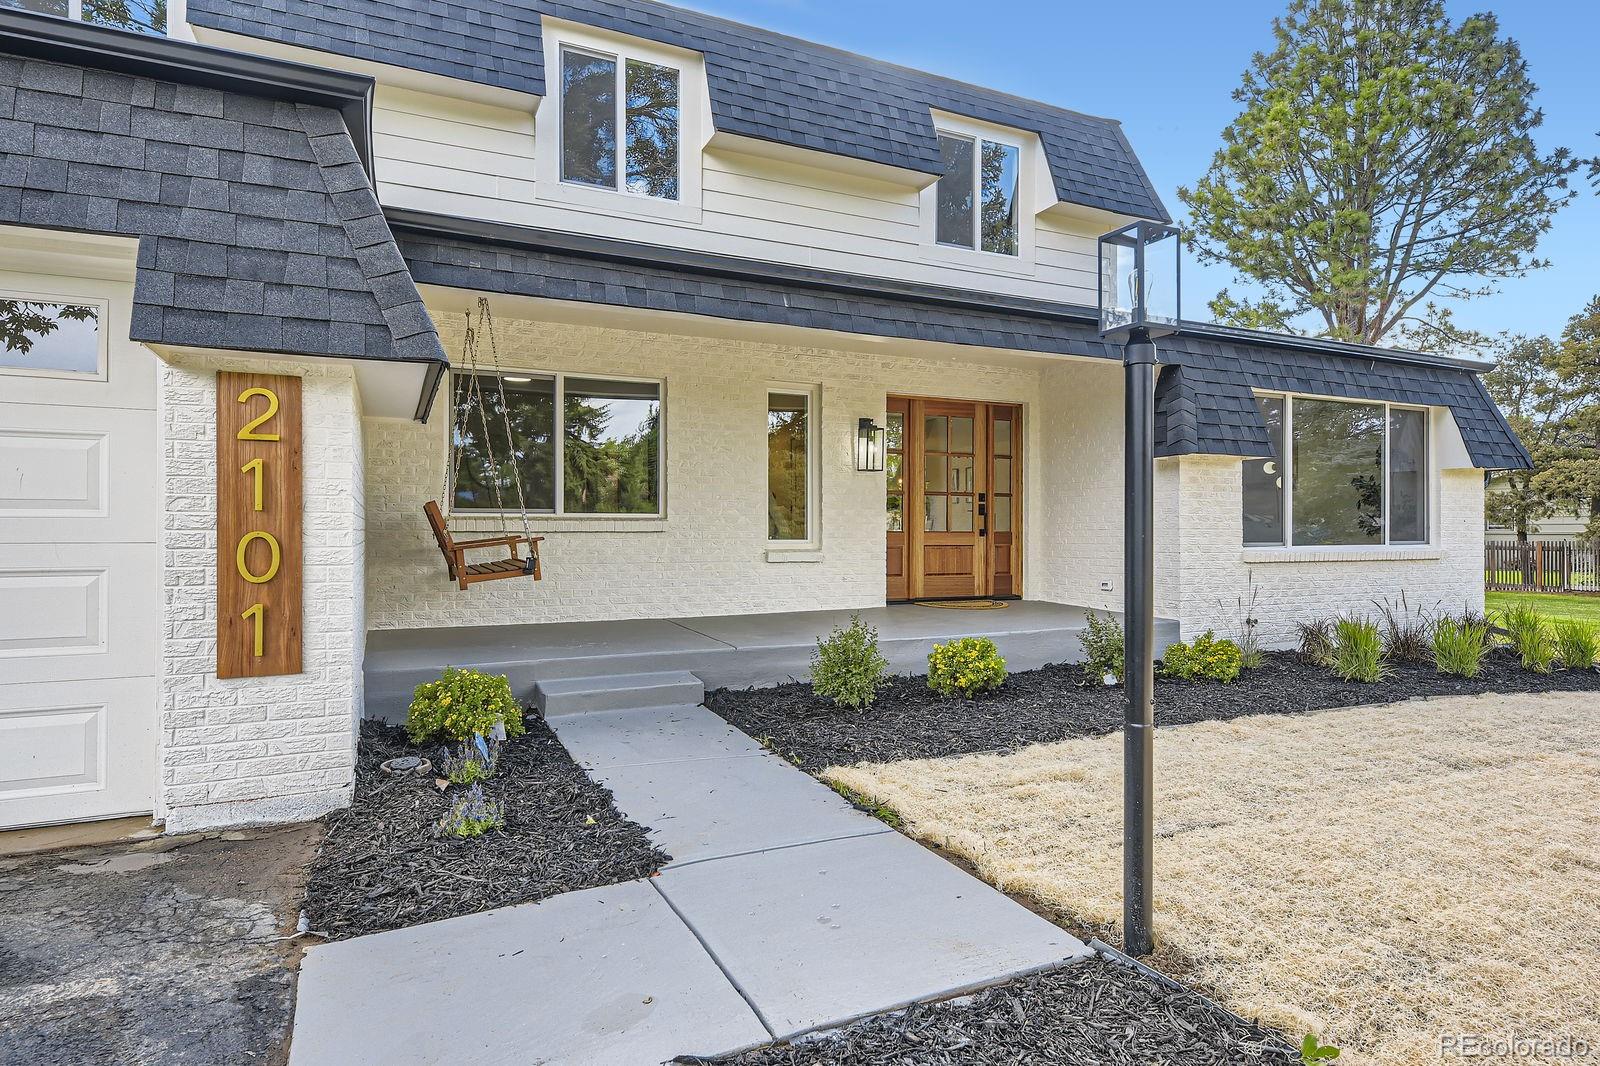
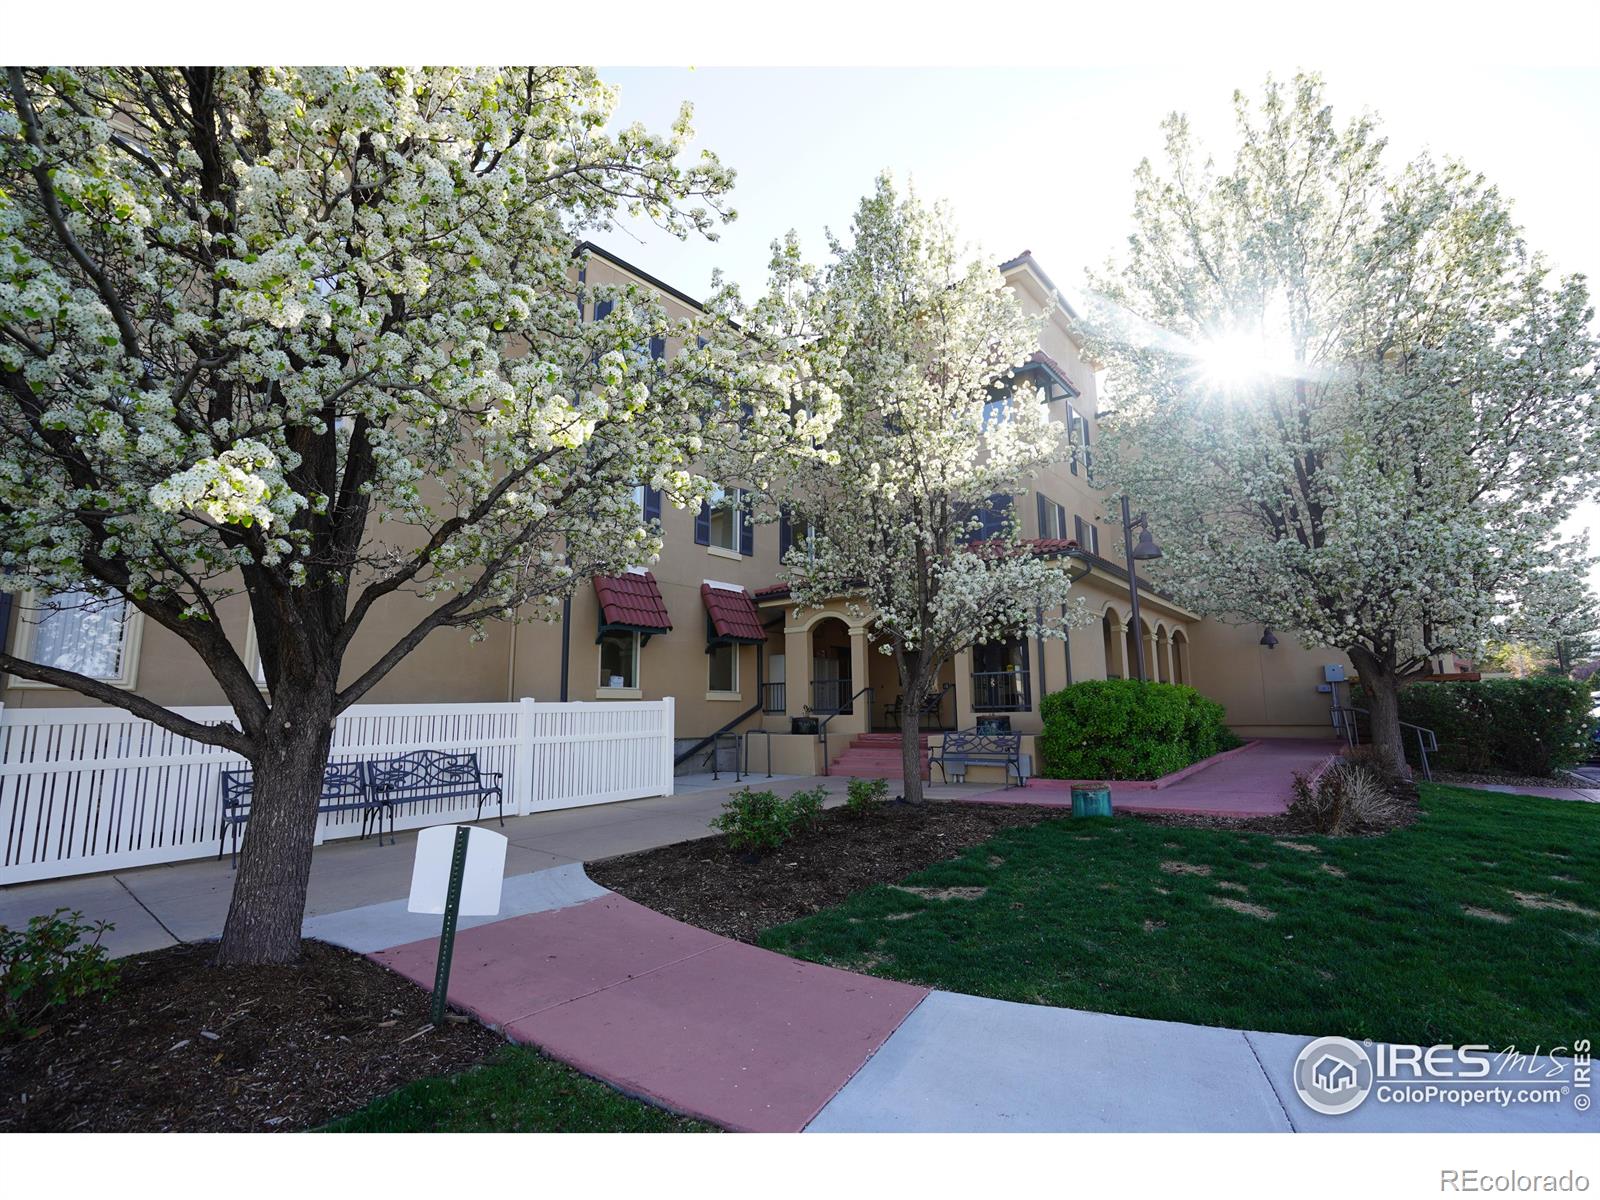
Active
$1,600,000
4
bds
|
4
ba
|
3,776
sqft
|
built
1971
2101 Champlain Dr, Boulder, CO 80301
$-6,284
Cash flow
-20.5%
Cash-on-Cash Return
1.6%
Cap rate
0.3%
Rent to Value Ratio
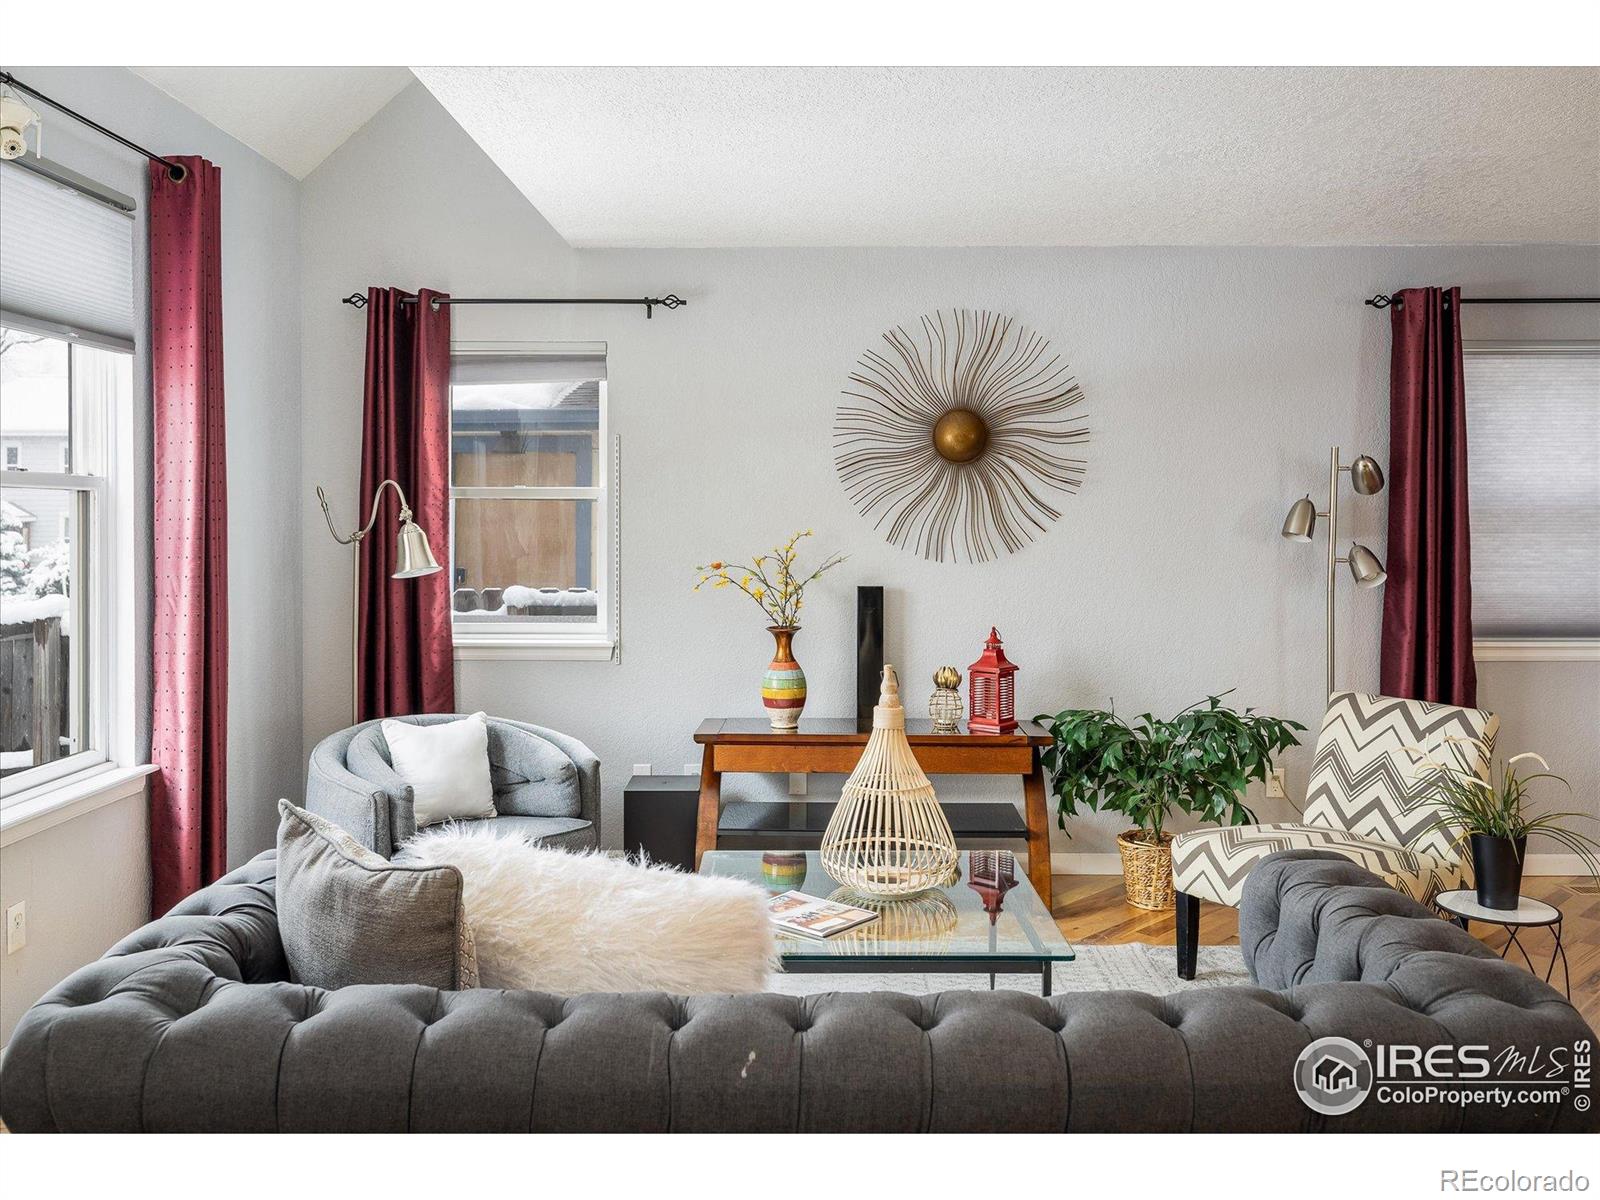
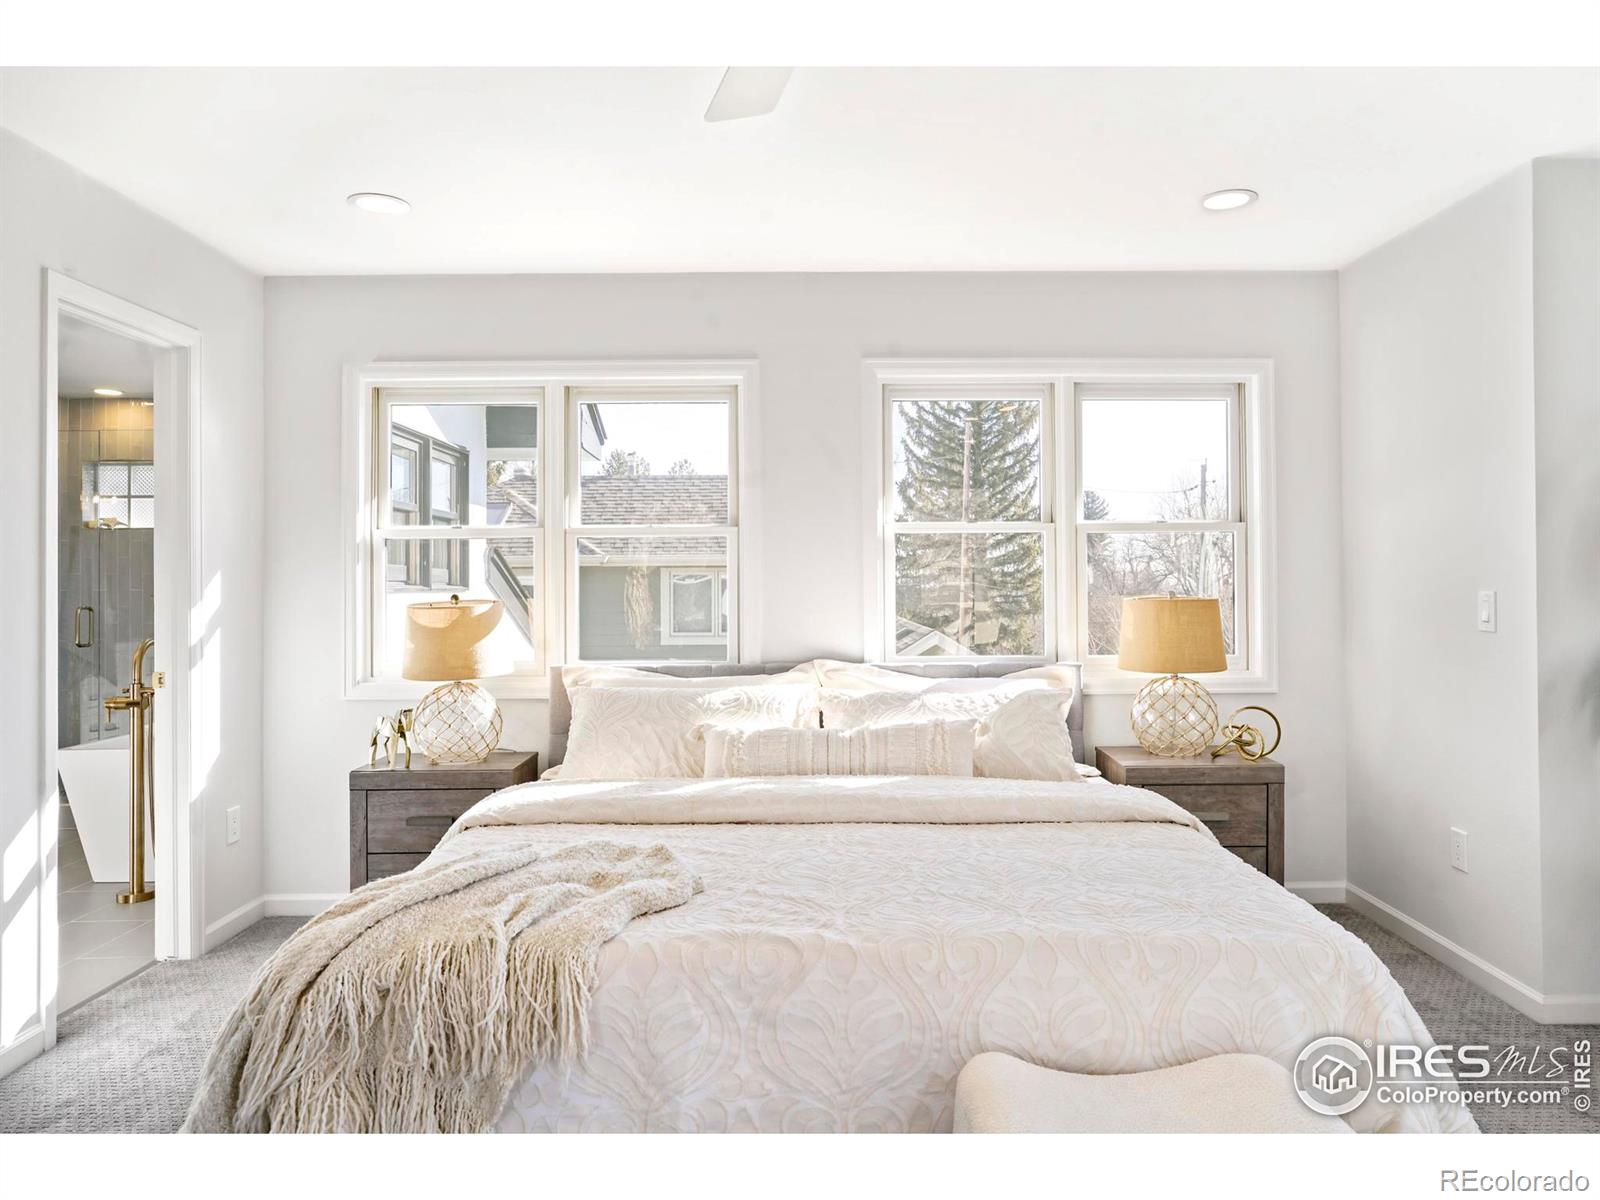
Active
$1,285,000
3
bds
|
3
ba
|
1,502
sqft
|
built
1990
1605 17th St, Boulder, CO 80302
$-4,546
Cash flow
-18.5%
Cash-on-Cash Return
2.0%
Cap rate
0.3%
Rent to Value Ratio
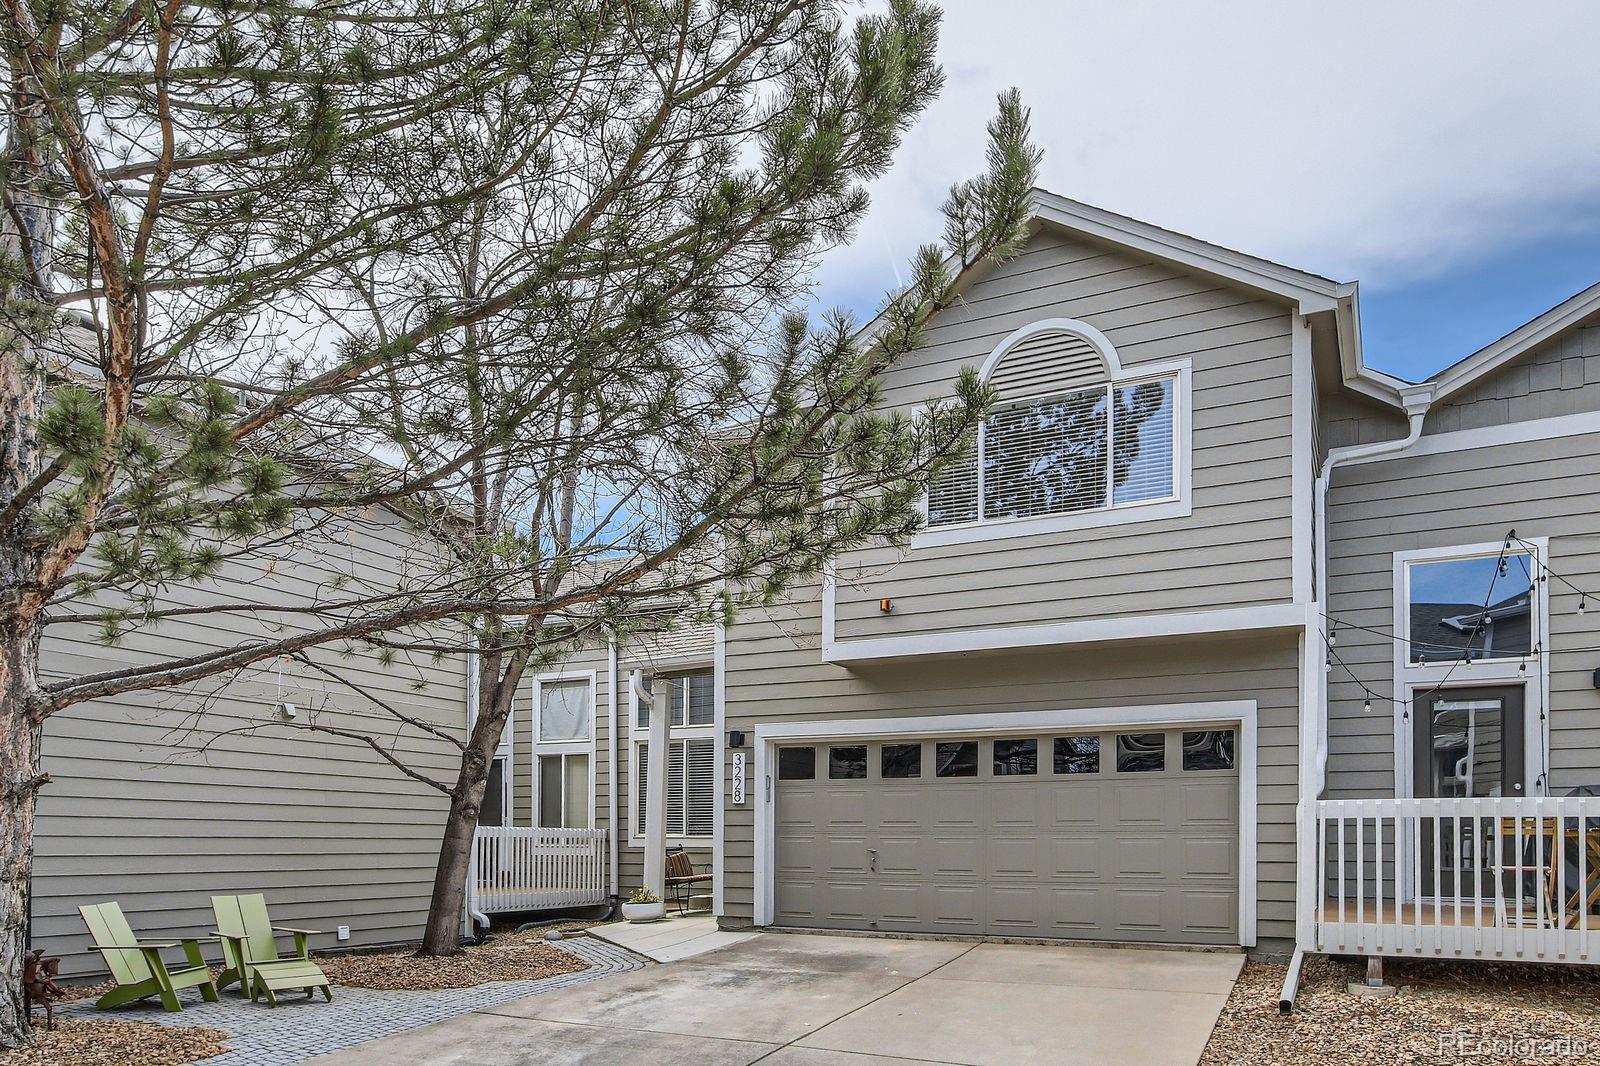
Active
$600,000
3
bds
|
4
ba
|
1,800
sqft
|
built
1997
3228 47th St, Boulder, CO 80301
$-1,745
Cash flow
-15.2%
Cash-on-Cash Return
2.8%
Cap rate
0.5%
Rent to Value Ratio

Active under contract
$1,450,000
6
bds
|
5
ba
|
4,918
sqft
|
built
1997
366 Blackhawk Ln, Lafayette, CO 80026
$-5,118
Cash flow
-18.4%
Cash-on-Cash Return
2.0%
Cap rate
0.3%
Rent to Value Ratio
Active
$995,000
3
bds
|
3
ba
|
1,816
sqft
|
built
1997
217 Park St, Lyons, CO 80540
$-2,782
Cash flow
-14.6%
Cash-on-Cash Return
2.9%
Cap rate
0.4%
Rent to Value Ratio
Active
$399,000
2
bds
|
1
ba
|
800
sqft
|
built
1930
2426 Riverside Dr, Lyons, CO 80540
$-569
Cash flow
-7.4%
Cash-on-Cash Return
4.6%
Cap rate
0.6%
Rent to Value Ratio
Active
$545,000
2
bds
|
3
ba
|
1,678
sqft
|
built
2000
2855 Rock Creek Cir, Superior, CO 80027
$-1,776
Cash flow
-17.0%
Cash-on-Cash Return
2.4%
Cap rate
0.5%
Rent to Value Ratio
Active
$1,050,000
5
bds
|
5
ba
|
3,450
sqft
|
built
2022
779 Kohlor Dr, Lafayette, CO 80026
$-2,553
Cash flow
-12.7%
Cash-on-Cash Return
3.4%
Cap rate
0.5%
Rent to Value Ratio
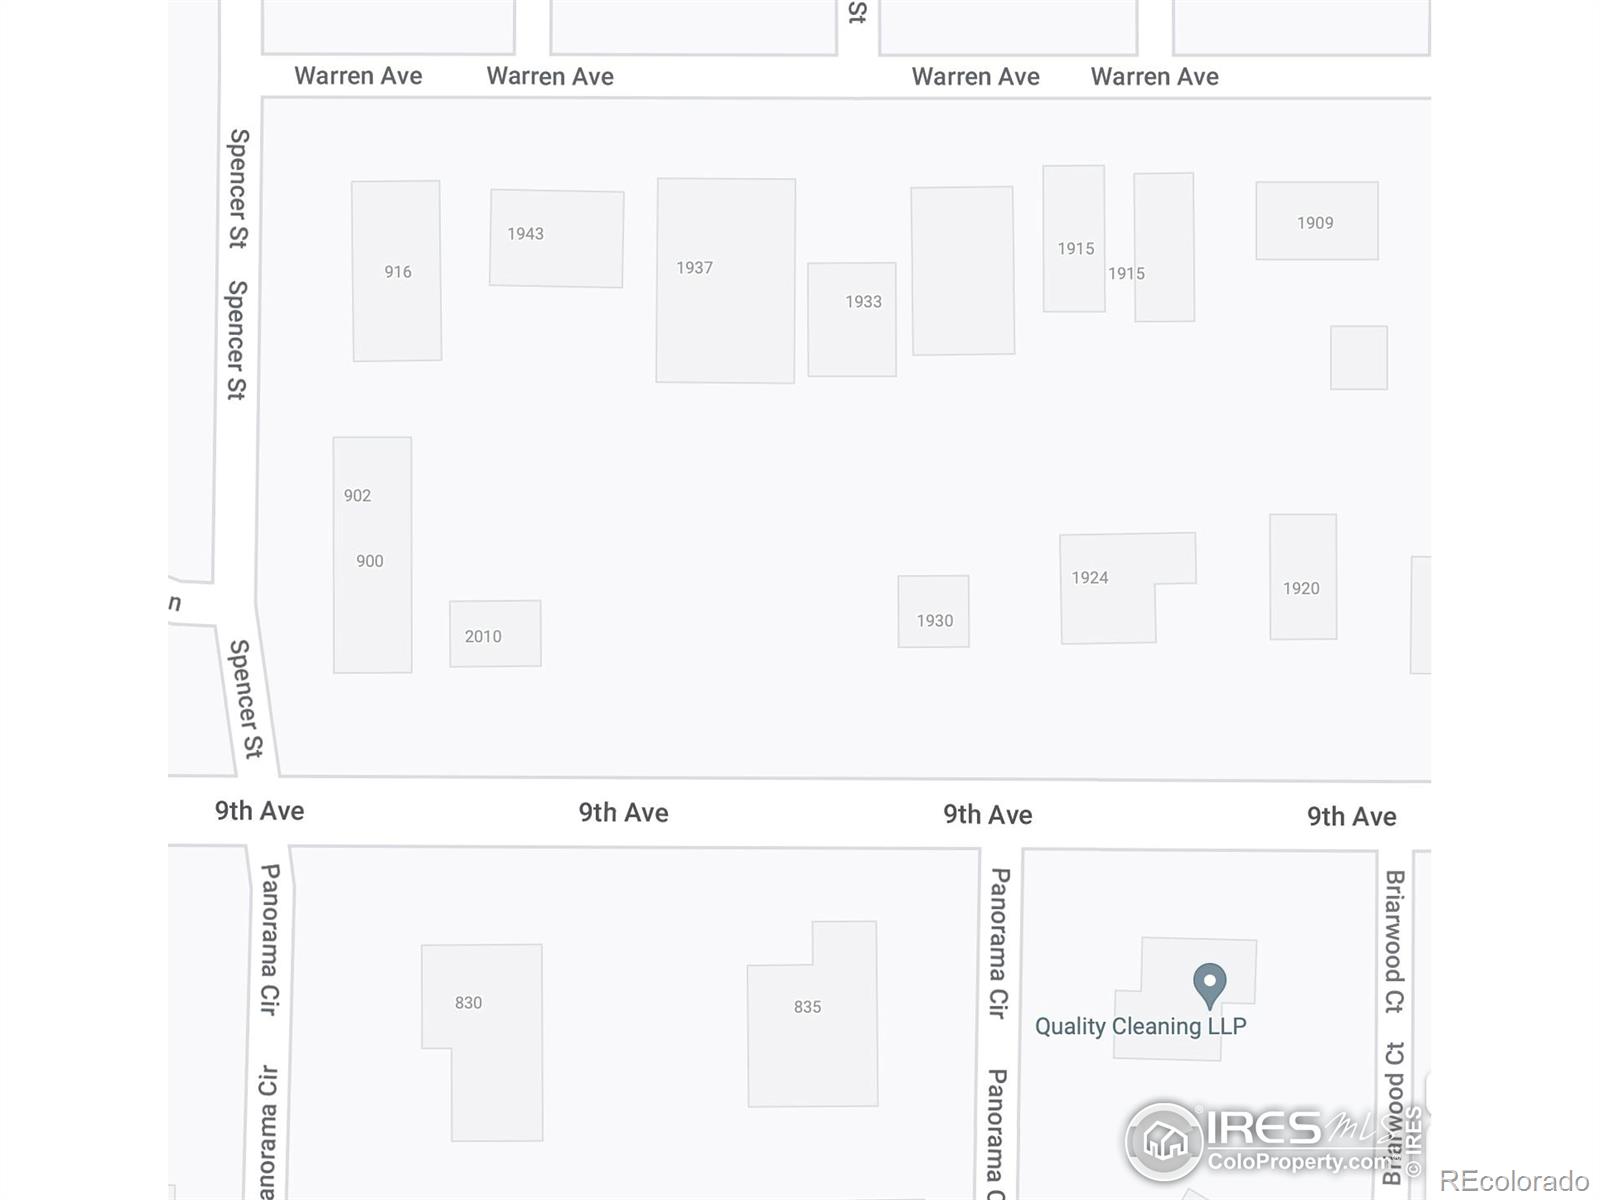
Active
$450,000
4
bds
|
2
ba
|
1,540
sqft
|
built
1900
2010 9th Ave, Longmont, CO 80501
$-839
Cash flow
-9.7%
Cash-on-Cash Return
4.0%
Cap rate
0.5%
Rent to Value Ratio
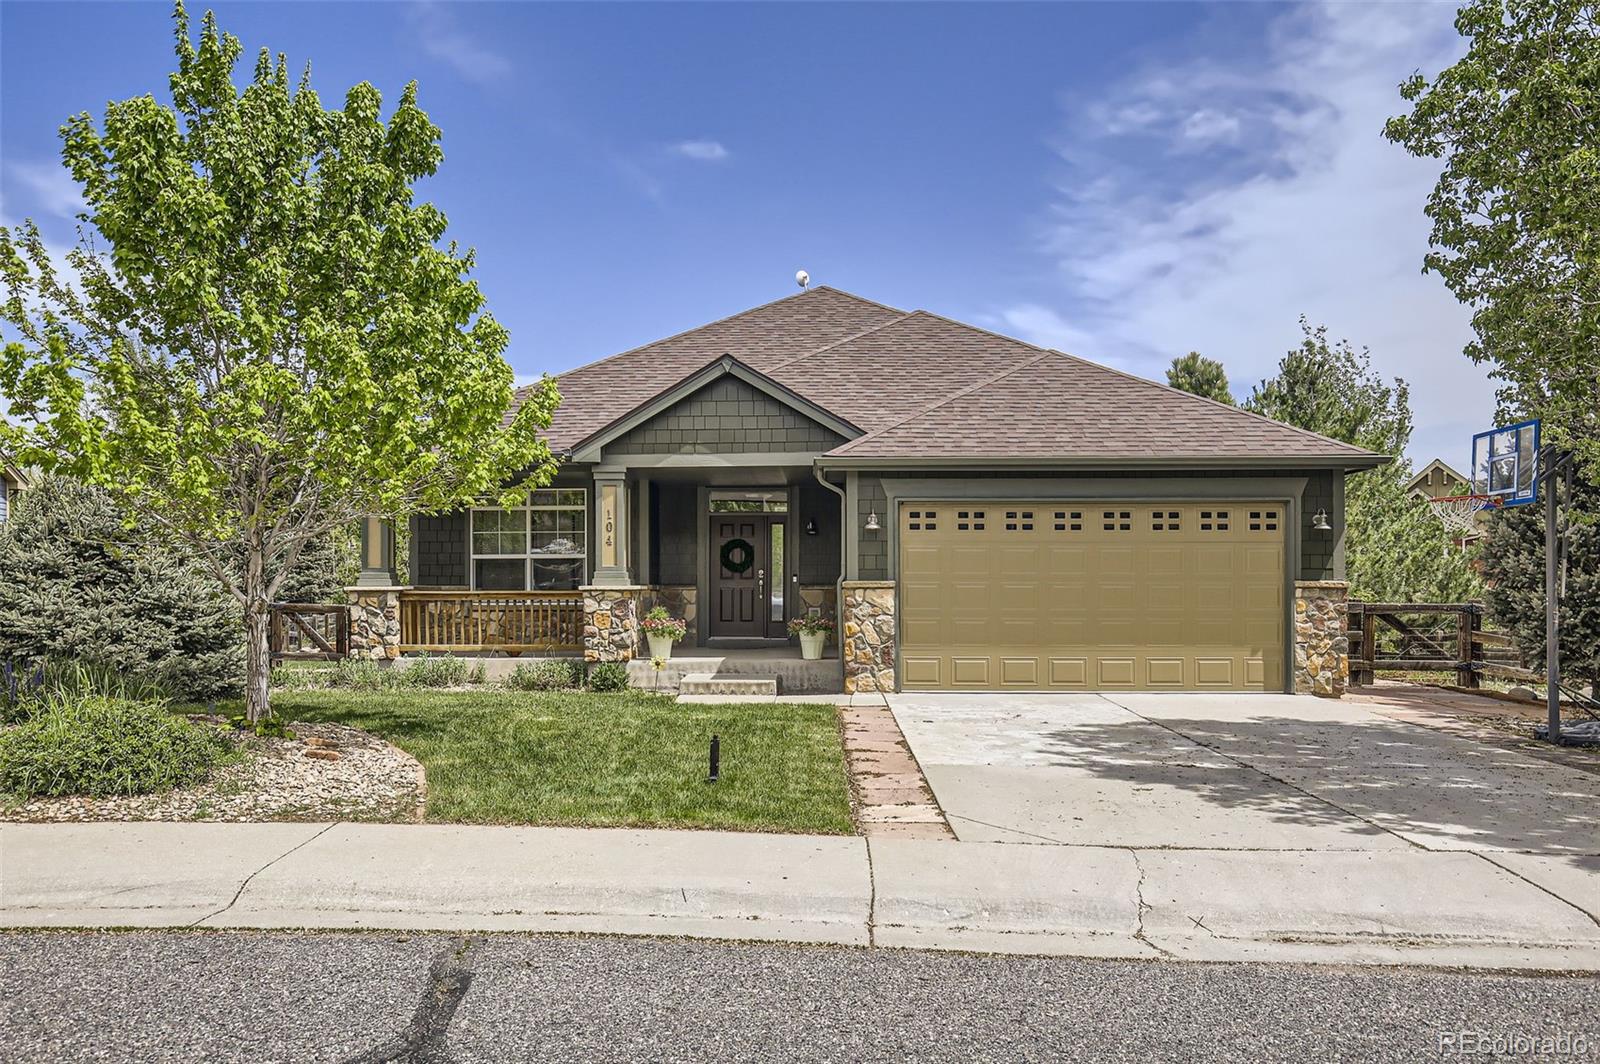
Active
$939,000
4
bds
|
3
ba
|
3,499
sqft
|
built
2005
104 Noland Ct, Lyons, CO 80540
$-2,871
Cash flow
-16.0%
Cash-on-Cash Return
2.6%
Cap rate
0.4%
Rent to Value Ratio
Active
$1,199,000
5
bds
|
5
ba
|
4,086
sqft
|
built
2017
1902 Pioneer Cir, Lafayette, CO 80026
$-3,366
Cash flow
-14.6%
Cash-on-Cash Return
2.9%
Cap rate
0.4%
Rent to Value Ratio

Active
$450,000
2
bds
|
2
ba
|
1,232
sqft
|
built
2005
1057 W Century Dr, Louisville, CO 80027
$-1,553
Cash flow
-18.0%
Cash-on-Cash Return
2.1%
Cap rate
0.6%
Rent to Value Ratio
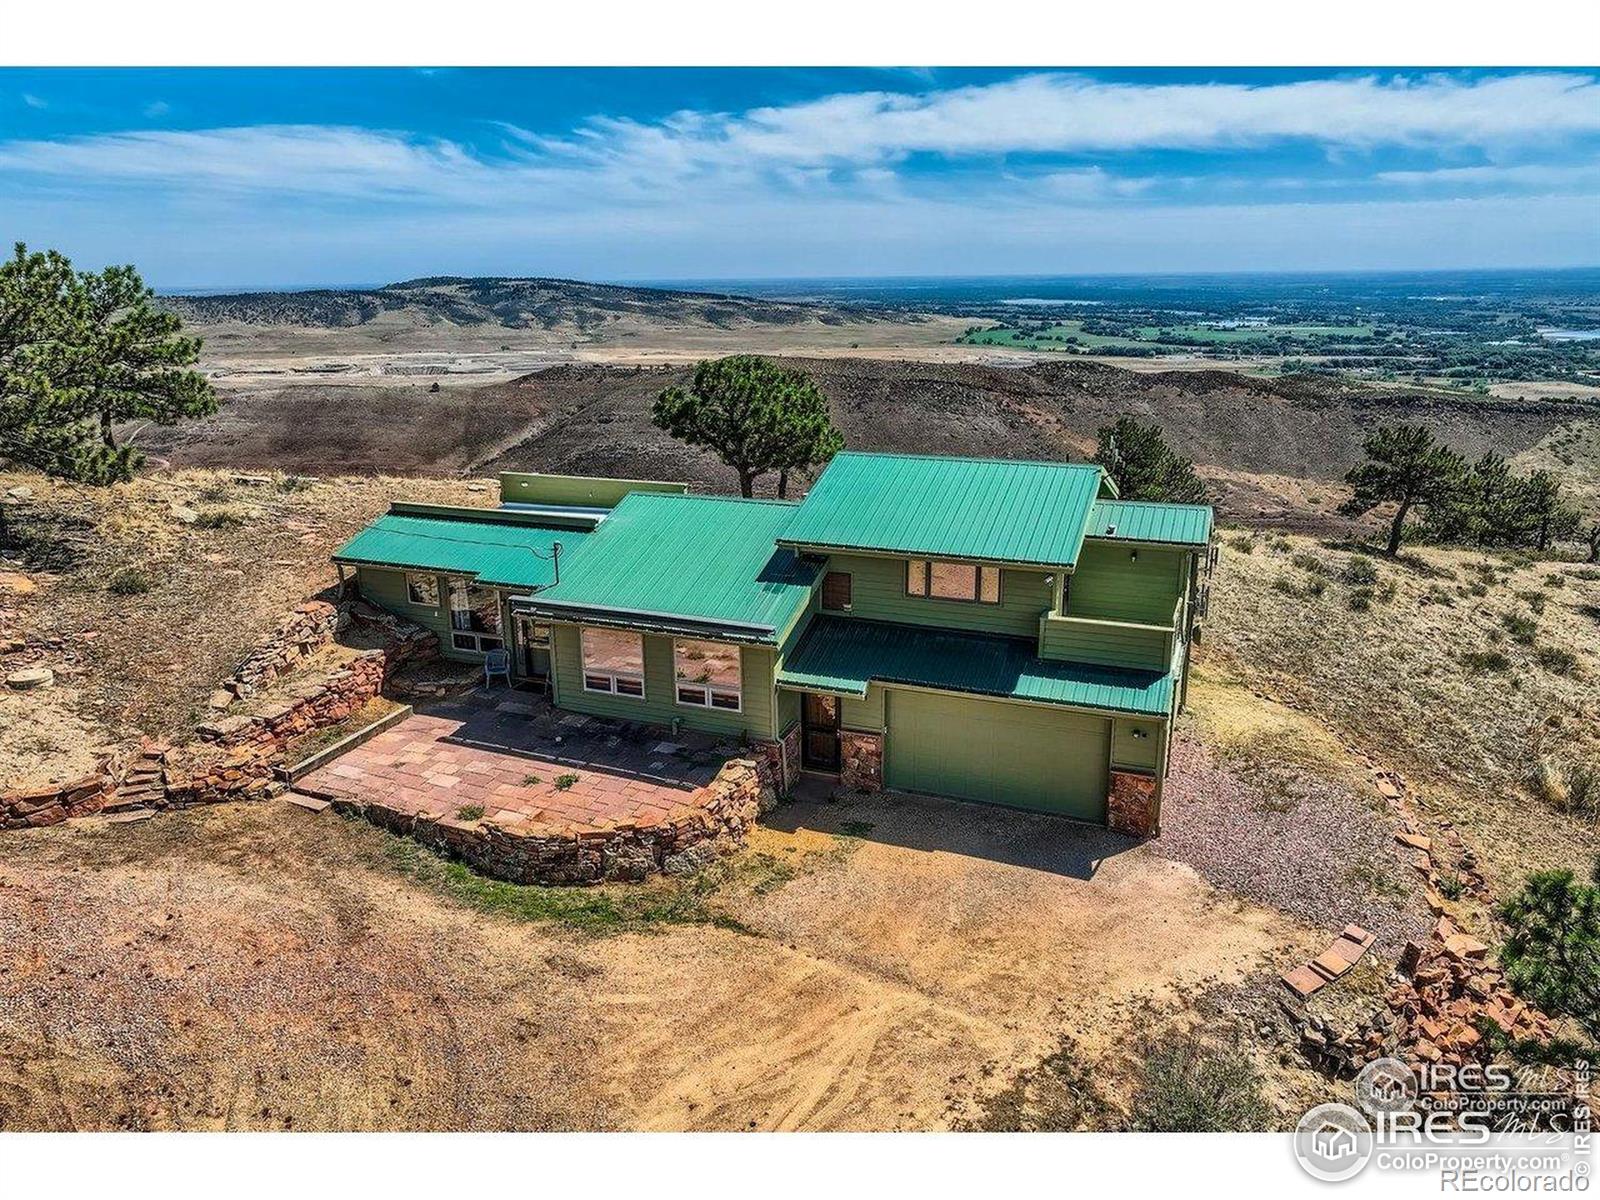
Active
$1,295,000
2
bds
|
2
ba
|
1,741
sqft
|
built
1995
2450 Eagle Ridge Rd, Lyons, CO 80540
$-3,582
Cash flow
-14.4%
Cash-on-Cash Return
3.0%
Cap rate
0.4%
Rent to Value Ratio
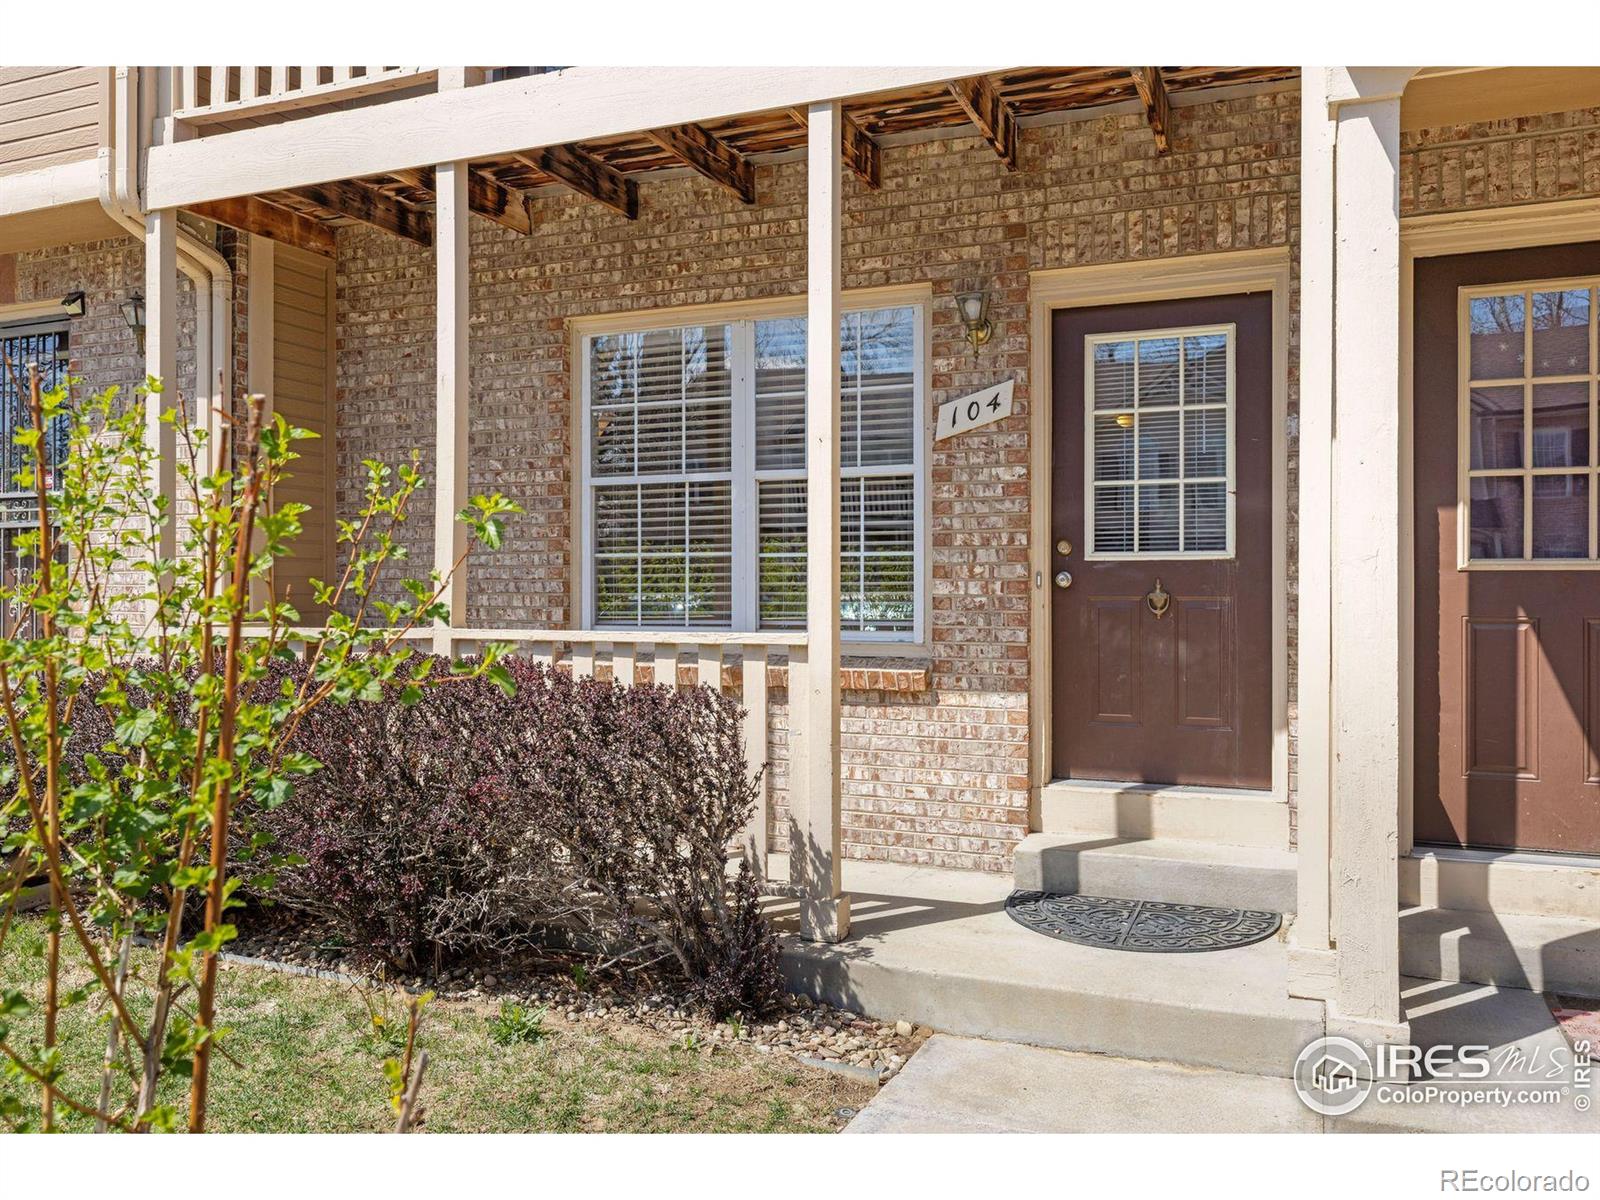
Active
$415,000
3
bds
|
3
ba
|
1,536
sqft
|
built
1985
104 Pheasant Run, Louisville, CO 80027
$-1,024
Cash flow
-12.9%
Cash-on-Cash Return
3.3%
Cap rate
0.6%
Rent to Value Ratio
Active
$1,125,000
5
bds
|
4
ba
|
3,782
sqft
|
built
1994
520 Campo Way, Superior, CO 80027
$-3,745
Cash flow
-17.4%
Cash-on-Cash Return
2.3%
Cap rate
0.4%
Rent to Value Ratio

Active
$495,000
2
bds
|
2
ba
|
1,071
sqft
|
built
1996
546 Ridgeview Dr, Louisville, CO 80027
$-1,471
Cash flow
-15.5%
Cash-on-Cash Return
2.7%
Cap rate
0.5%
Rent to Value Ratio
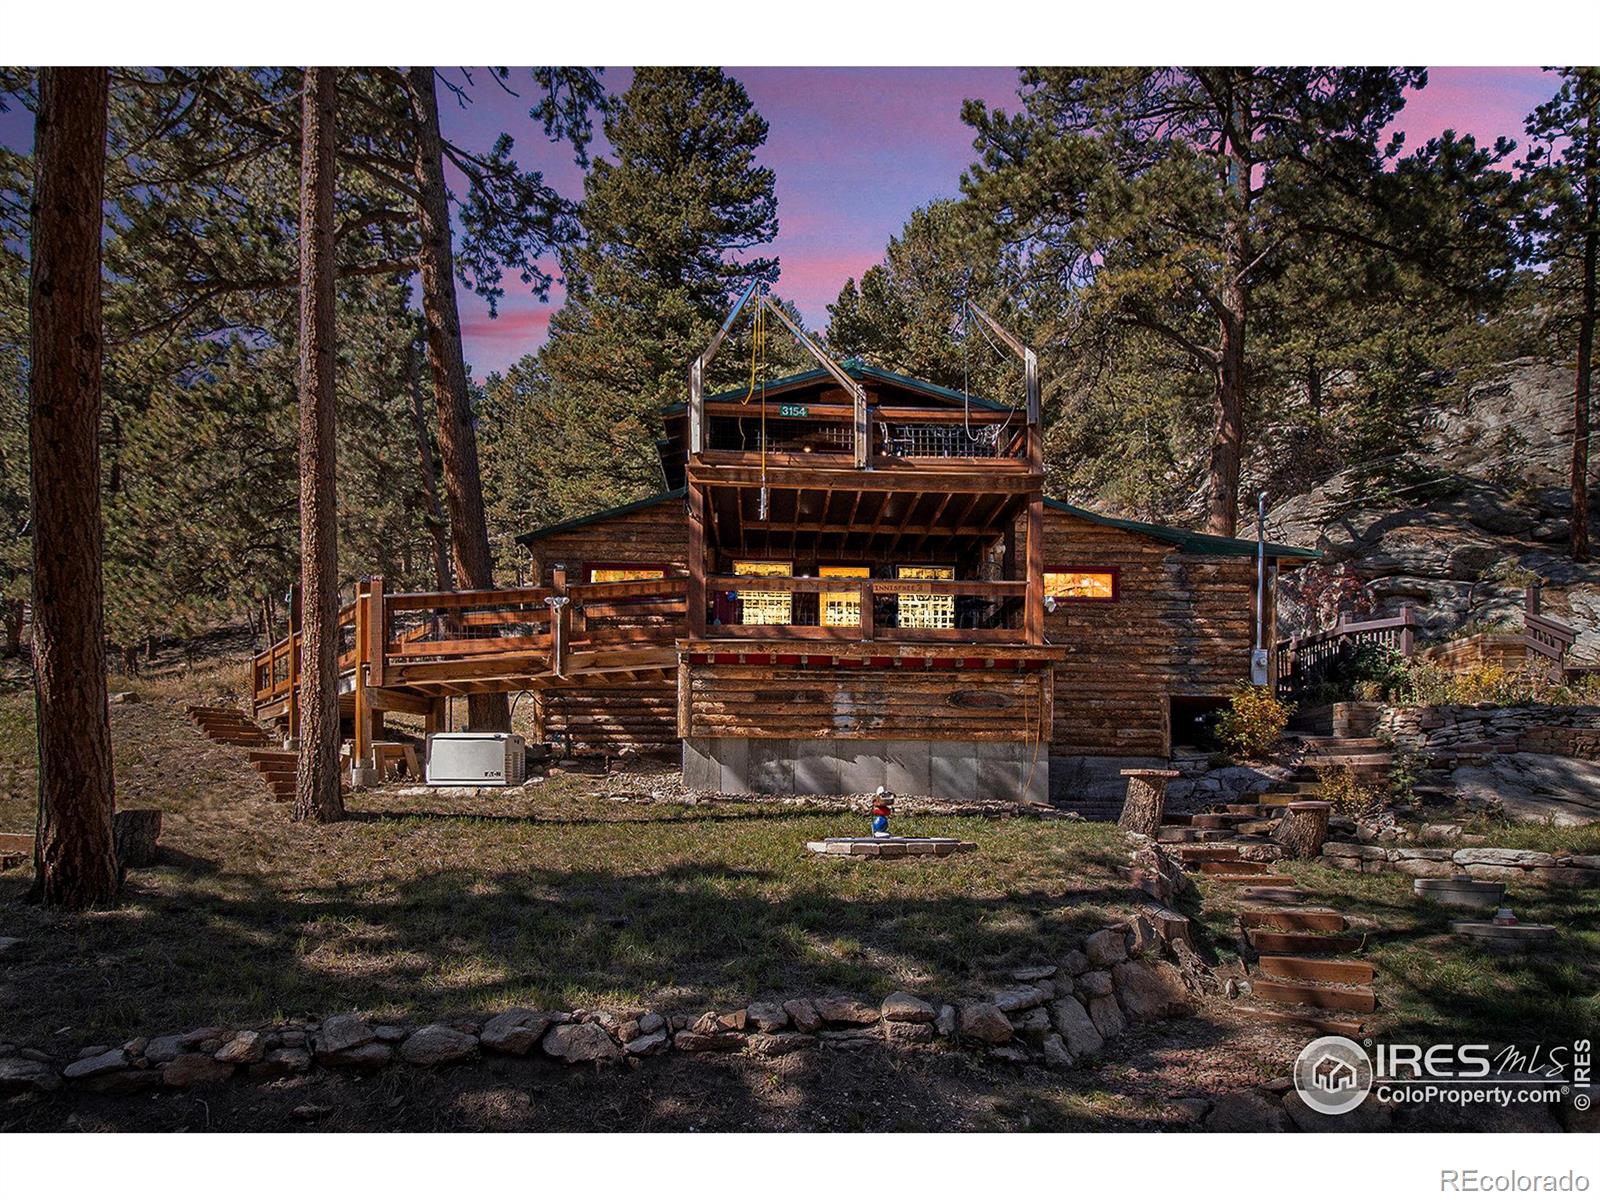
Active
$540,000
3
bds
|
1
ba
|
1,378
sqft
|
built
1930
3154 Riverside Dr, Lyons, CO 80540
$-896
Cash flow
-8.7%
Cash-on-Cash Return
4.3%
Cap rate
0.5%
Rent to Value Ratio
Pending
$785,000
3
bds
|
1
ba
|
1,508
sqft
|
built
1940
577 N 96th St, Louisville, CO 80027
$-2,217
Cash flow
-14.7%
Cash-on-Cash Return
2.9%
Cap rate
0.4%
Rent to Value Ratio
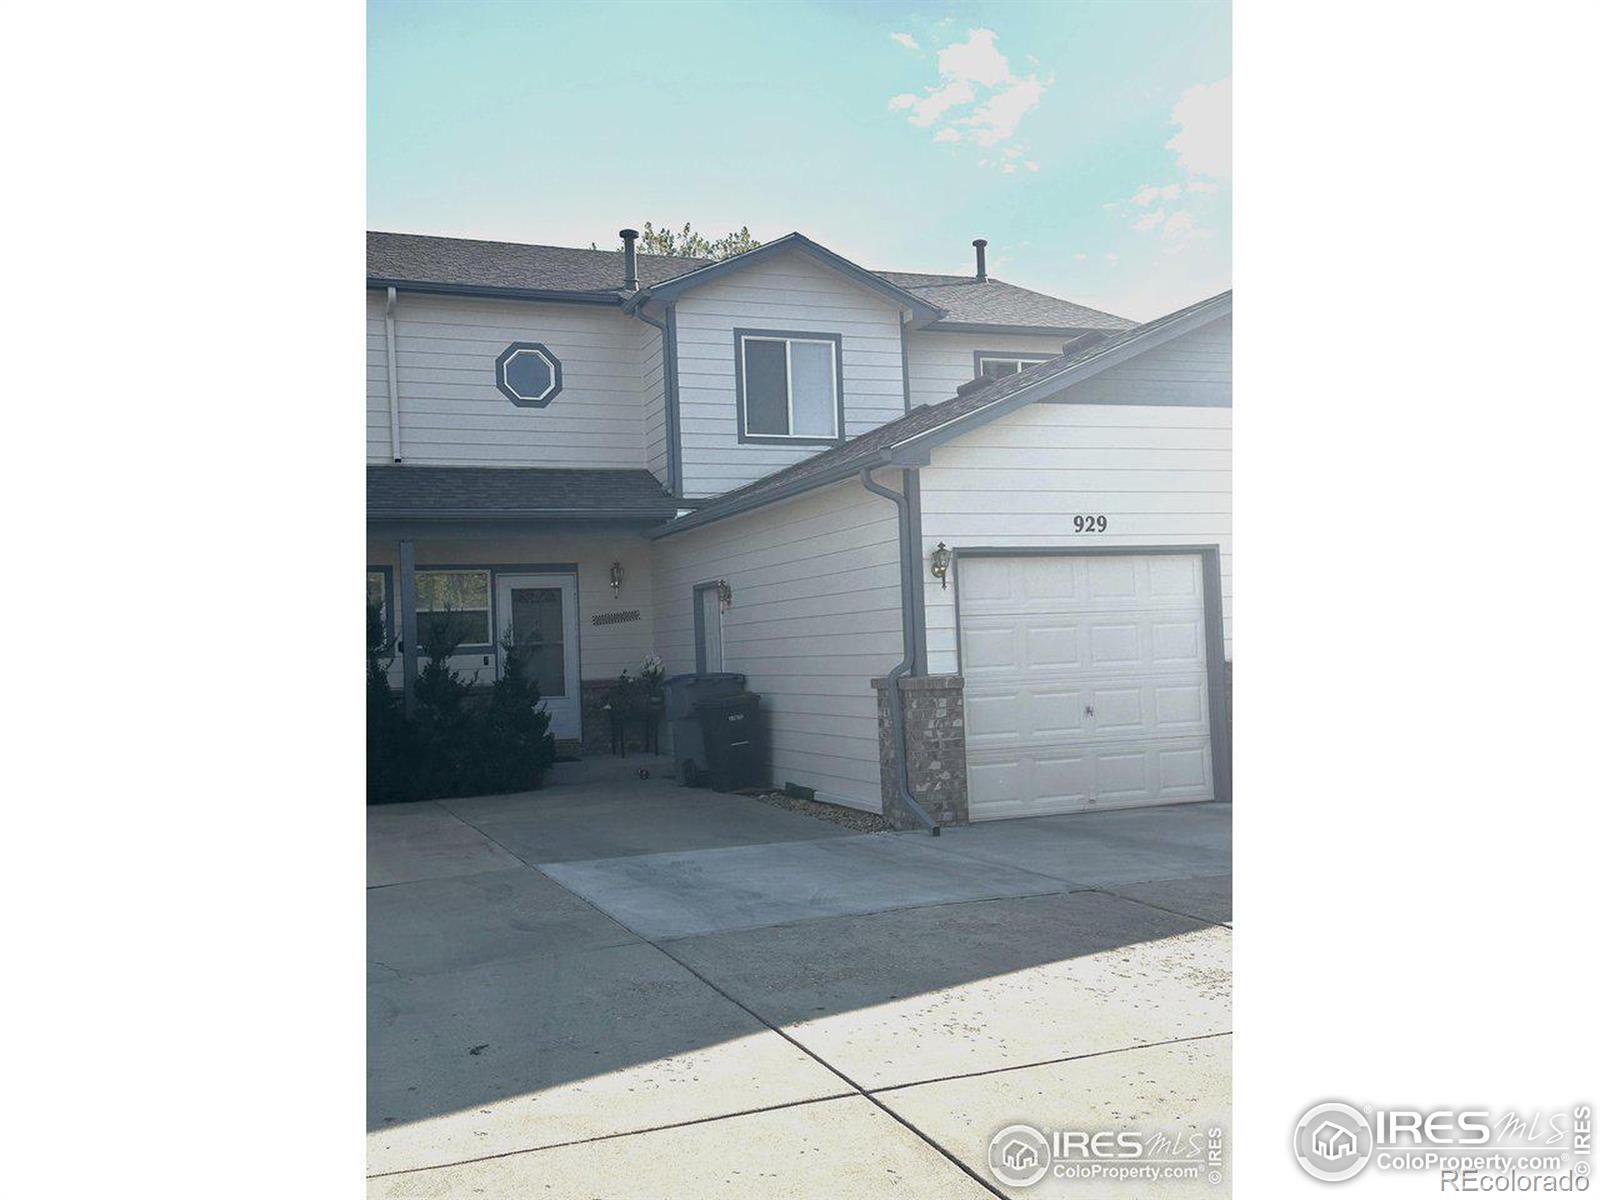
Active
$420,000
2
bds
|
3
ba
|
1,200
sqft
|
built
1996
929 Parker Dr, Longmont, CO 80501
$-1,444
Cash flow
-17.9%
Cash-on-Cash Return
2.2%
Cap rate
0.4%
Rent to Value Ratio
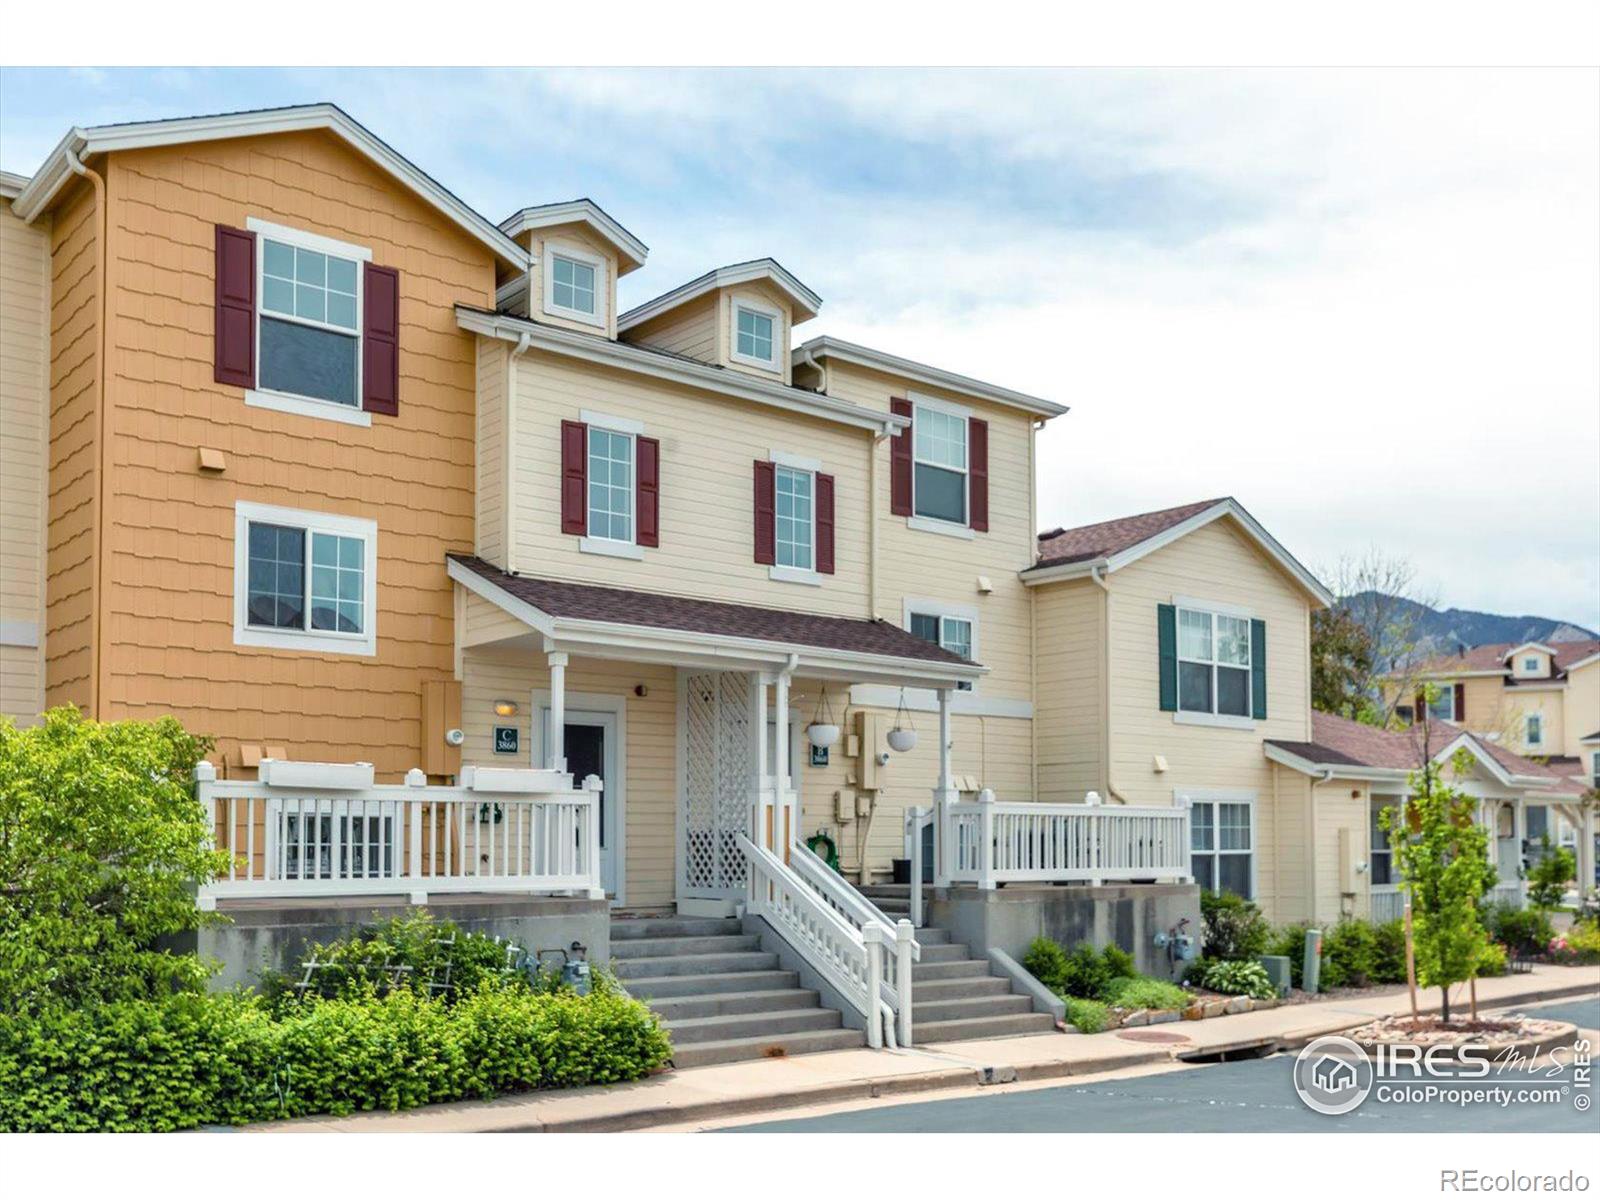
Active
$725,000
2
bds
|
2
ba
|
1,476
sqft
|
built
1997
3860 Colorado Ave, Boulder, CO 80303
$-2,401
Cash flow
-17.3%
Cash-on-Cash Return
2.3%
Cap rate
0.4%
Rent to Value Ratio
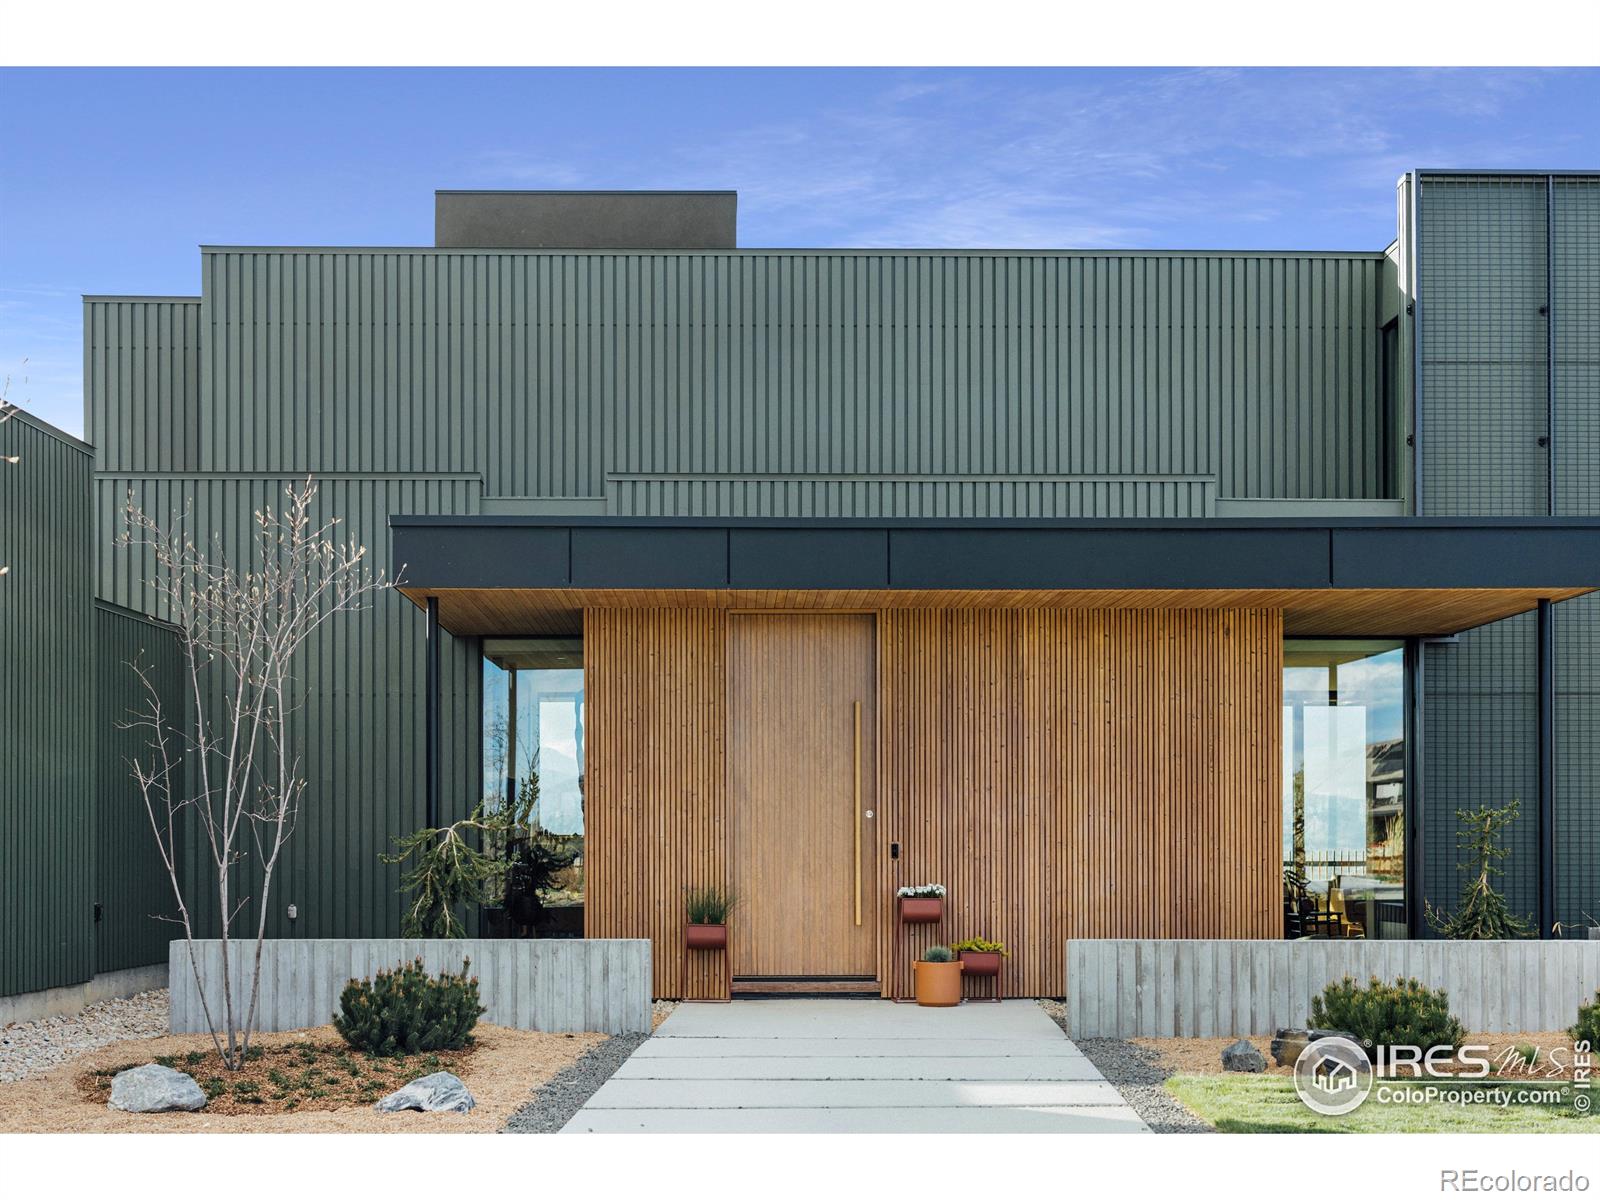
Active
$6,350,000
5
bds
|
7
ba
|
4,914
sqft
|
built
2023
7509 Panorama Dr, Boulder, CO 80303
$-30,245
Cash flow
-24.9%
Cash-on-Cash Return
0.6%
Cap rate
0.1%
Rent to Value Ratio
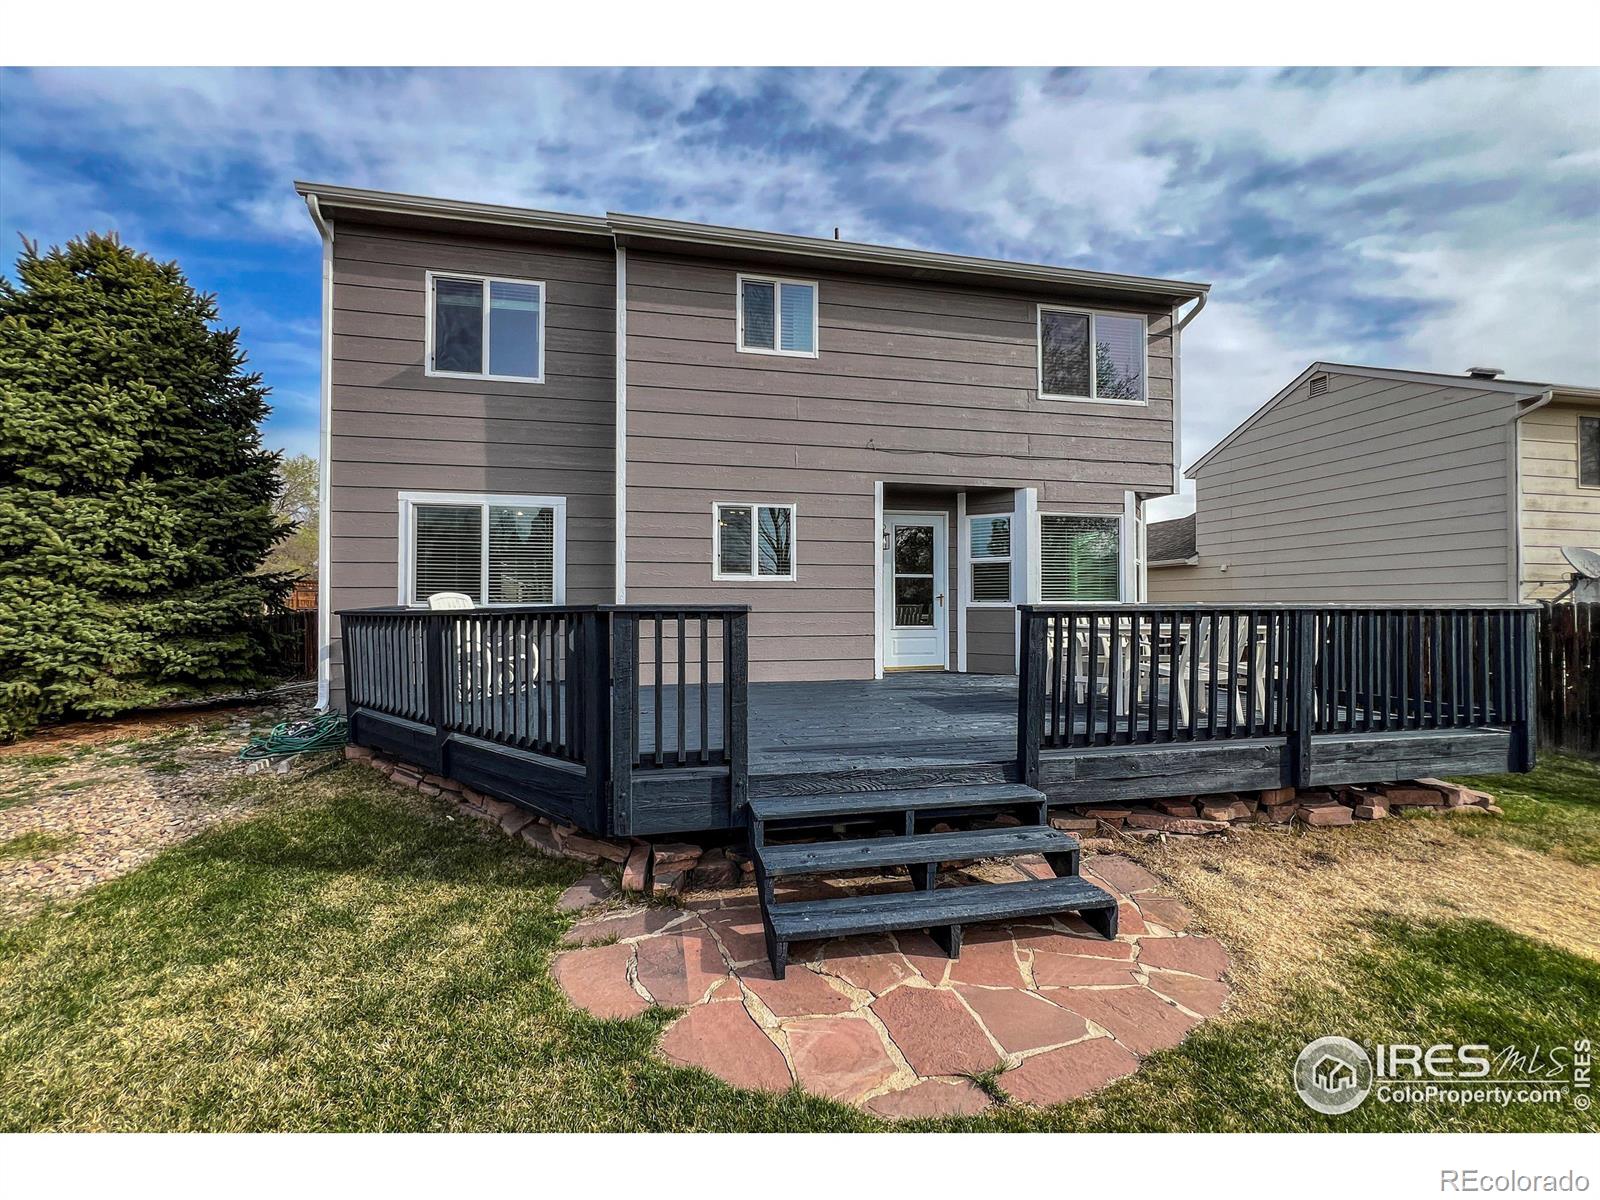
Active
$585,000
3
bds
|
3
ba
|
1,576
sqft
|
built
1997
1219 Cedarwood Dr, Longmont, CO 80504
$-1,471
Cash flow
-13.1%
Cash-on-Cash Return
3.3%
Cap rate
0.4%
Rent to Value Ratio
Active
$1,285,000
4
bds
|
3
ba
|
1,930
sqft
|
built
1940
3360 Broadway St, Boulder, CO 80304
$-4,038
Cash flow
-16.4%
Cash-on-Cash Return
2.5%
Cap rate
0.4%
Rent to Value Ratio
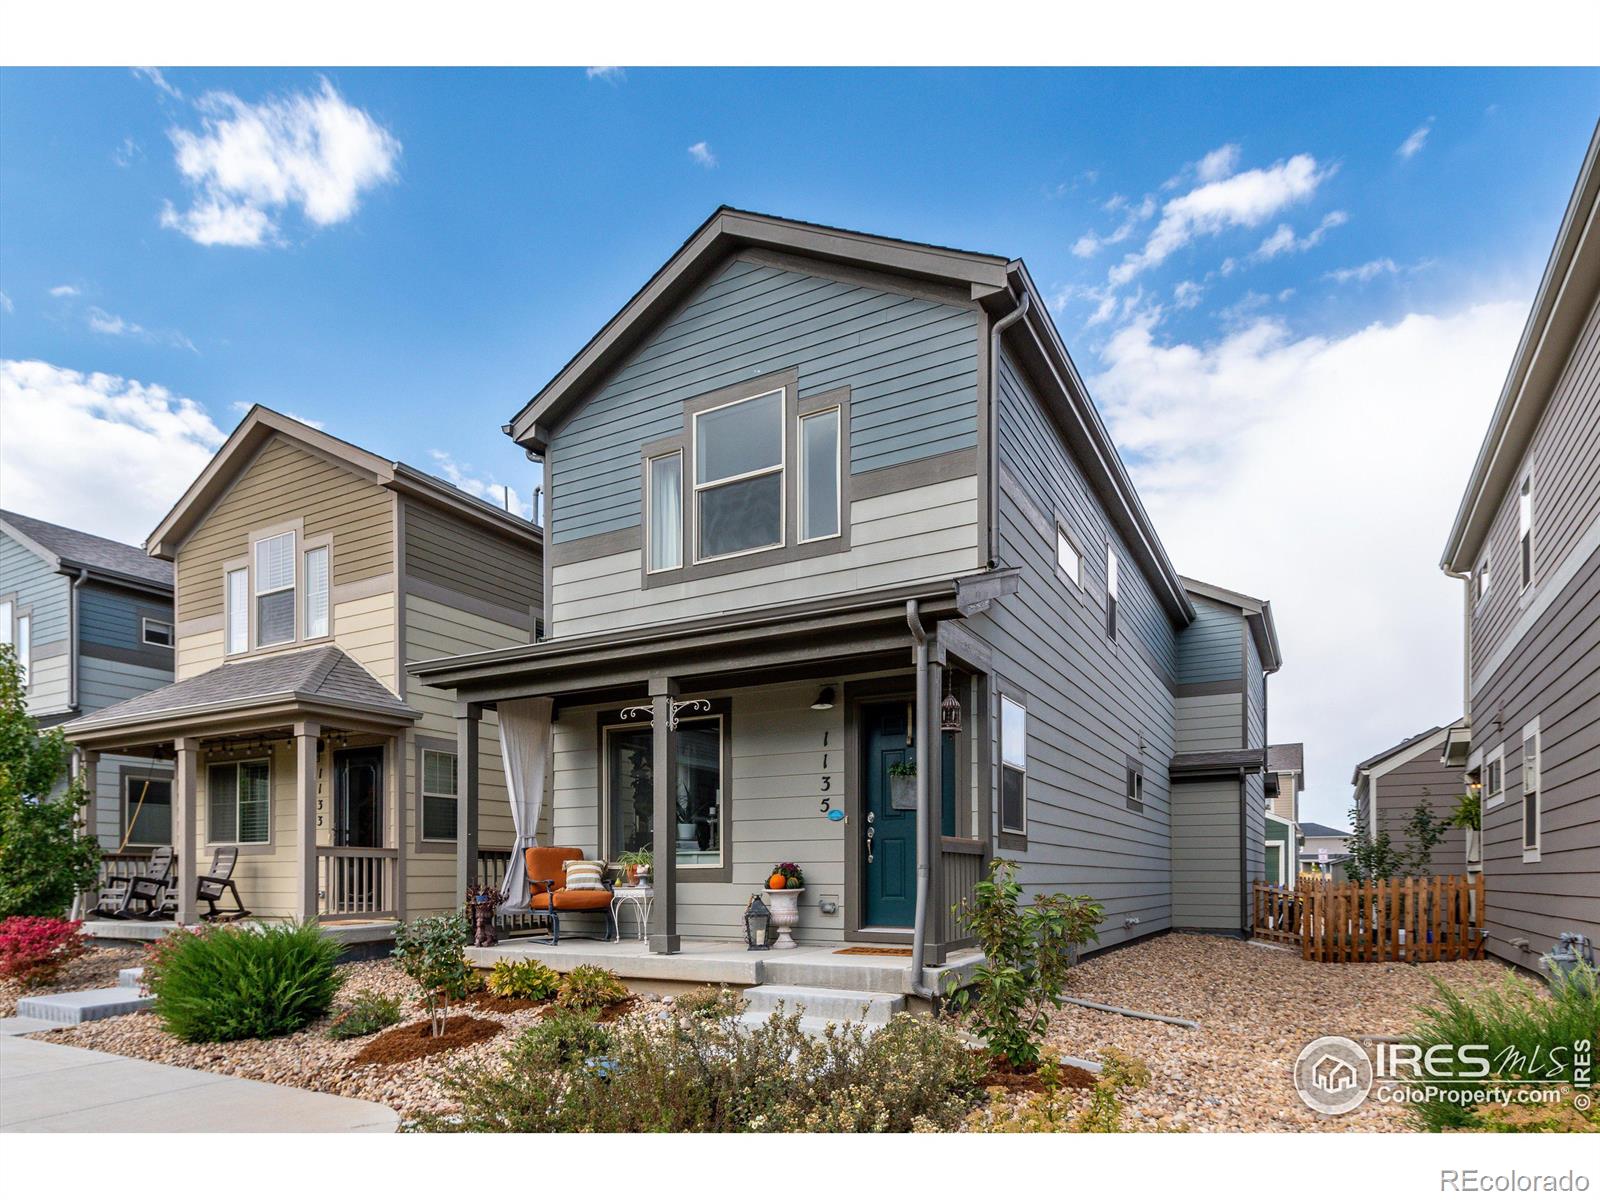
Pending
$475,000
3
bds
|
3
ba
|
1,370
sqft
|
built
2020
1135 Hummingbird Cir, Longmont, CO 80501
$-868
Cash flow
-9.5%
Cash-on-Cash Return
4.1%
Cap rate
0.5%
Rent to Value Ratio
Active
$1,349,999
4
bds
|
4
ba
|
2,776
sqft
|
built
1992
11730 Pointe View Dr, Longmont, CO 80503
$-5,012
Cash flow
-19.4%
Cash-on-Cash Return
1.8%
Cap rate
0.3%
Rent to Value Ratio
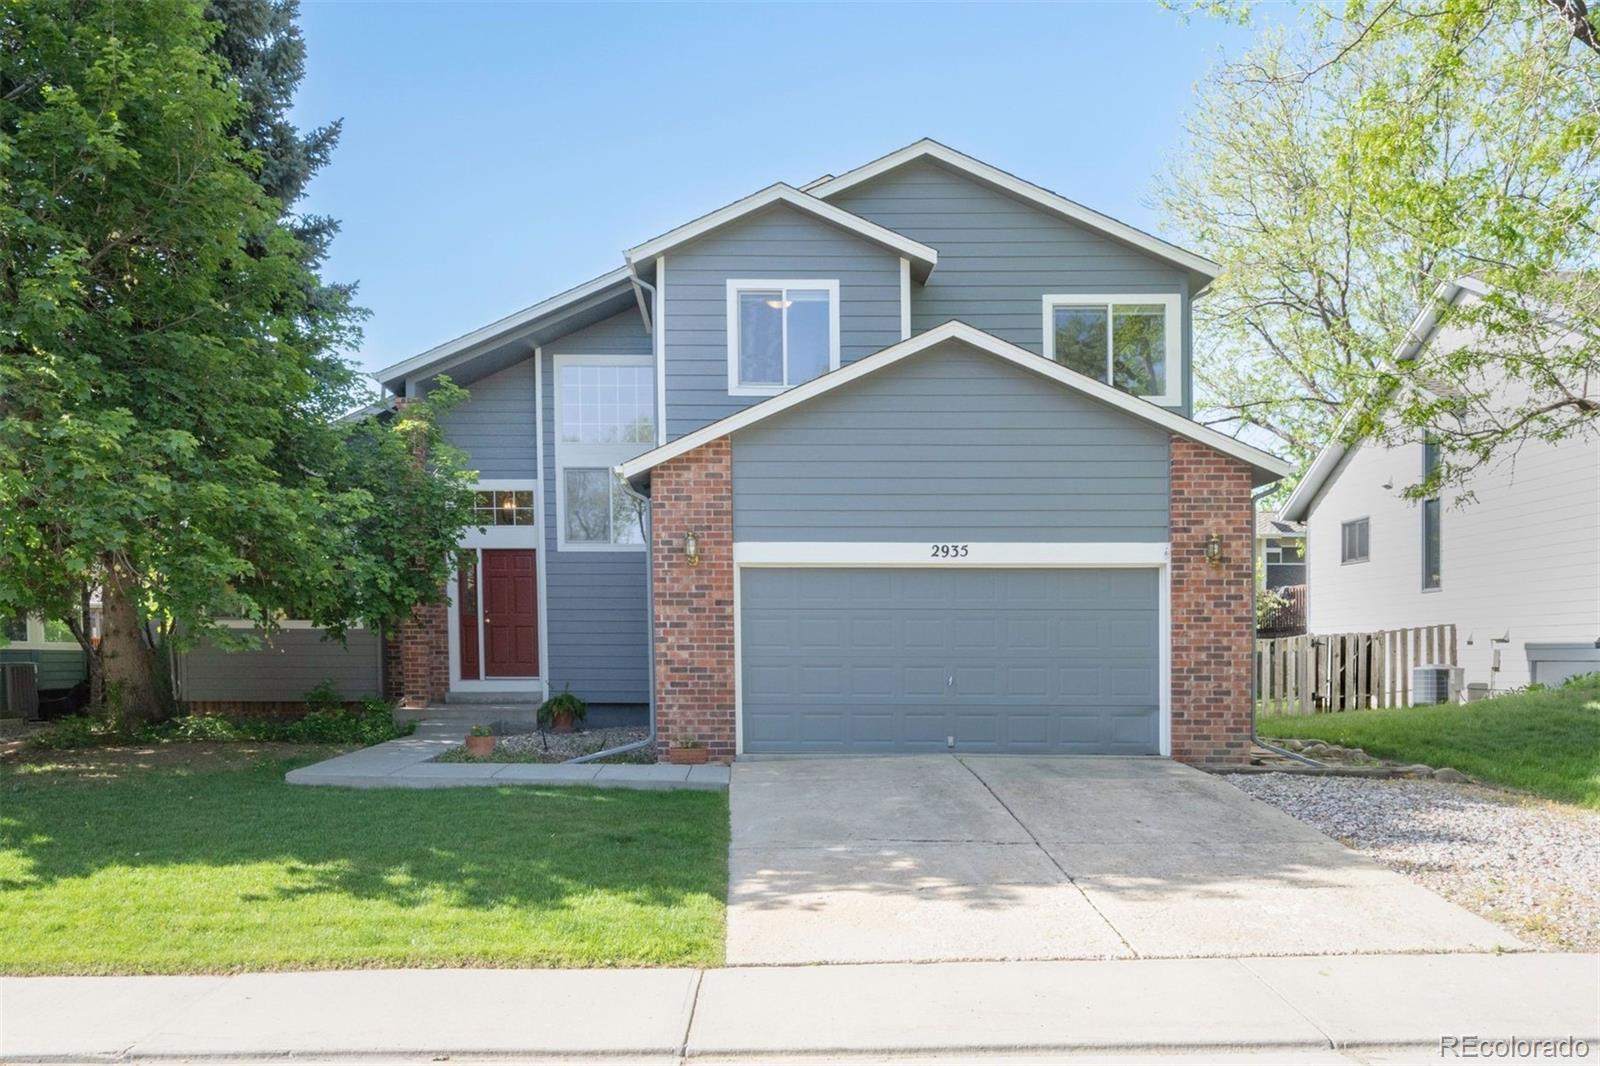
Active
$650,000
3
bds
|
4
ba
|
2,388
sqft
|
built
1992
2935 Bow Line Pl, Longmont, CO 80503
$-1,790
Cash flow
-14.4%
Cash-on-Cash Return
3.0%
Cap rate
0.4%
Rent to Value Ratio
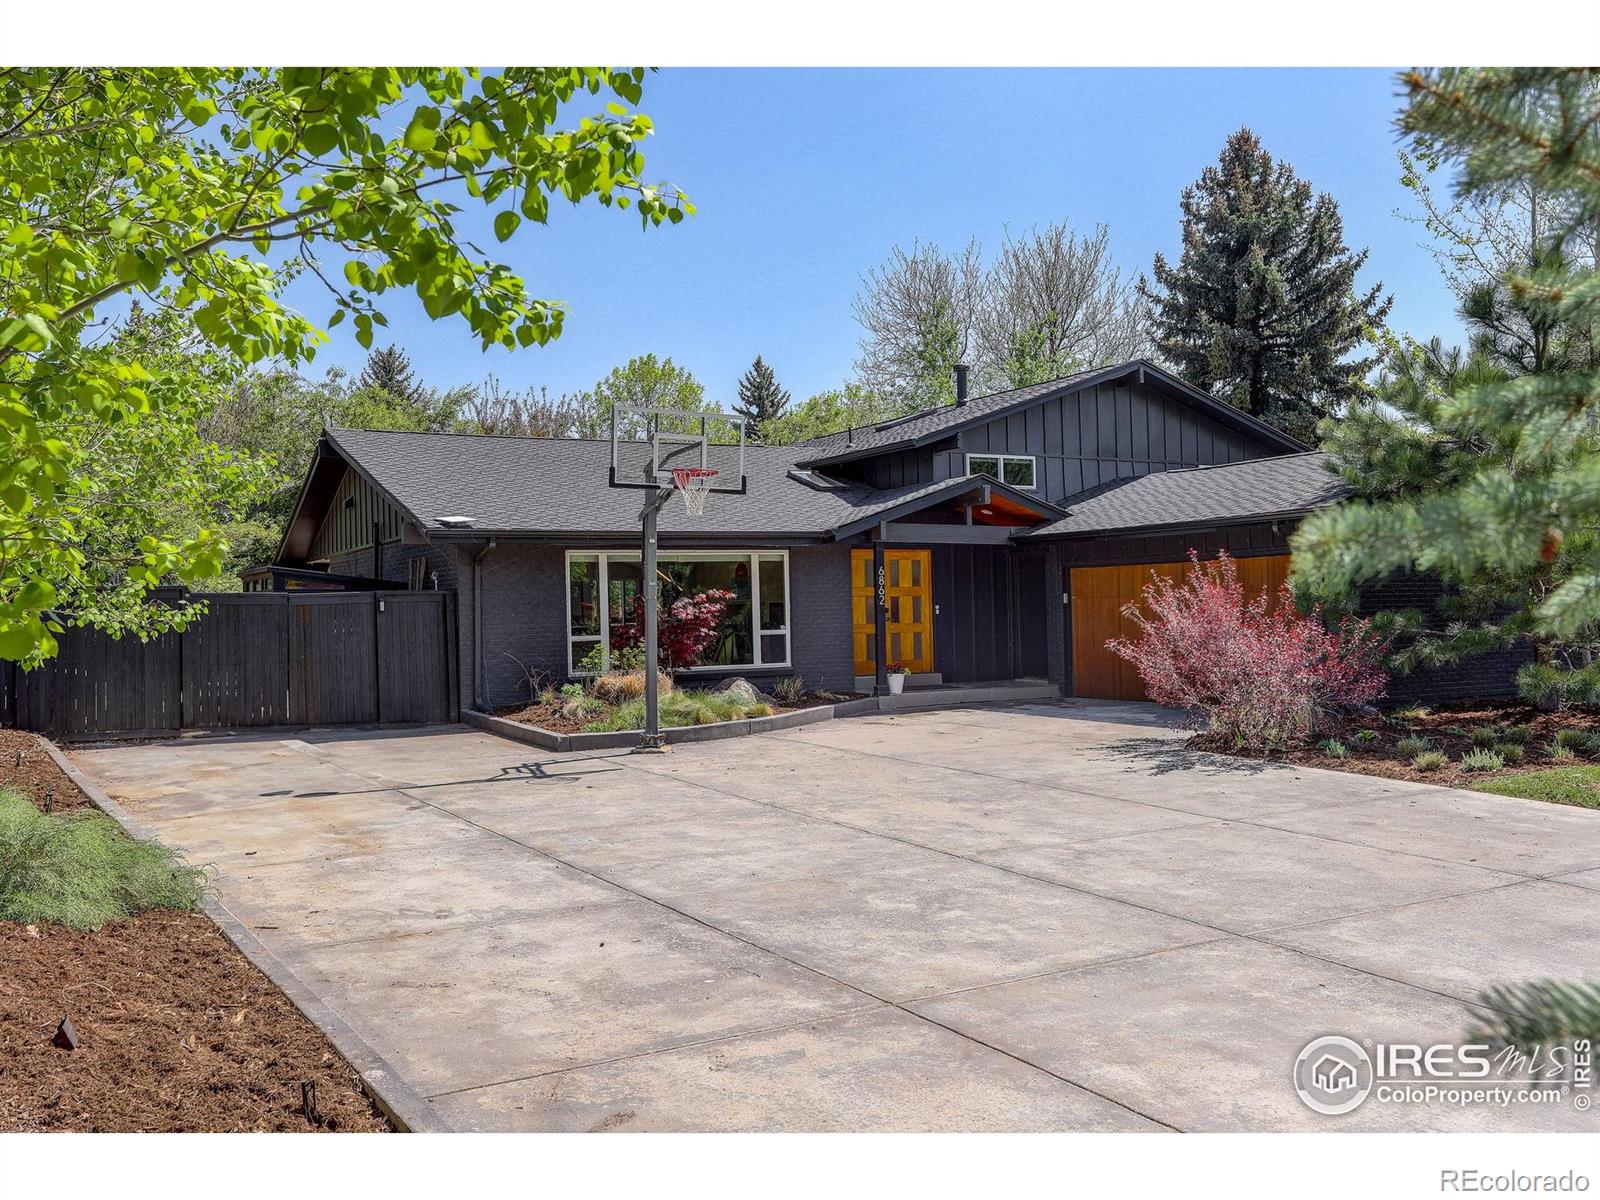
Active under contract
$1,295,000
5
bds
|
3
ba
|
2,702
sqft
|
built
1973
6862 Roaring Fork Trl, Boulder, CO 80301
$-4,605
Cash flow
-18.6%
Cash-on-Cash Return
2.0%
Cap rate
0.3%
Rent to Value Ratio
Active
$440,000
4
bds
|
4
ba
|
1,955
sqft
|
built
1994
1225 Baker St, Longmont, CO 80501
$-1,097
Cash flow
-13.0%
Cash-on-Cash Return
3.3%
Cap rate
0.6%
Rent to Value Ratio
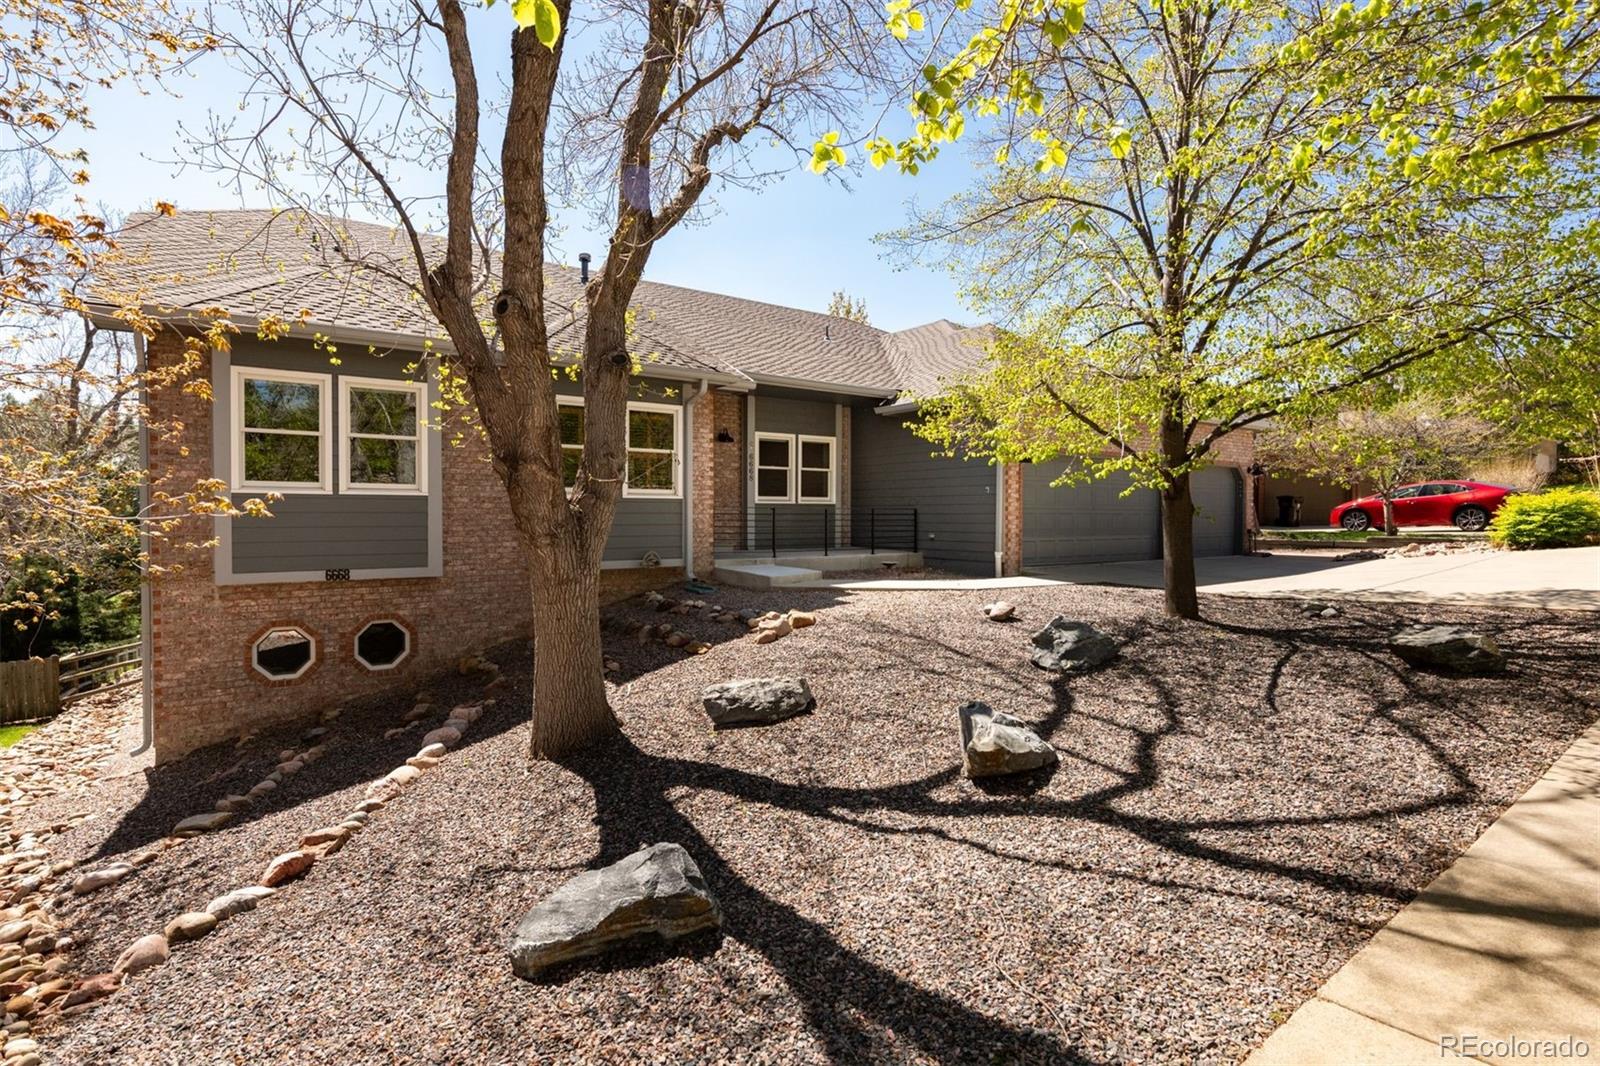
Active
$1,525,000
4
bds
|
3
ba
|
4,948
sqft
|
built
1989
6668 Fairways Dr, Longmont, CO 80503
$-5,700
Cash flow
-19.5%
Cash-on-Cash Return
1.8%
Cap rate
0.3%
Rent to Value Ratio
Active
$1,019,000
3
bds
|
1
ba
|
927
sqft
|
built
1958
6903 Valmont Rd, Boulder, CO 80301
$-3,534
Cash flow
-18.1%
Cash-on-Cash Return
2.1%
Cap rate
0.3%
Rent to Value Ratio
Active under contract
$595,000
4
bds
|
2
ba
|
1,536
sqft
|
built
1964
7105 Flagstaff Rd, Boulder, CO 80302
$-1,350
Cash flow
-11.8%
Cash-on-Cash Return
3.6%
Cap rate
0.5%
Rent to Value Ratio
Active
$2,990,000
3
bds
|
3
ba
|
4,085
sqft
|
built
1984
136 Old Post Office Rd, Boulder, CO 80302
$-12,028
Cash flow
-21.0%
Cash-on-Cash Return
1.5%
Cap rate
0.2%
Rent to Value Ratio
Active
$879,500
3
bds
|
4
ba
|
2,112
sqft
|
built
1989
4489 Wellington Rd, Boulder, CO 80301
$-2,930
Cash flow
-17.4%
Cash-on-Cash Return
2.3%
Cap rate
0.4%
Rent to Value Ratio
Active
$399,999
1
bds
|
1
ba
|
883
sqft
|
built
2005
2018 Ionosphere St, Longmont, CO 80504
$-1,007
Cash flow
-13.1%
Cash-on-Cash Return
3.3%
Cap rate
0.6%
Rent to Value Ratio
Active
$797,300
2
bds
|
2
ba
|
2,126
sqft
|
built
1994
548 Coughlin Meadows Rd, Boulder, CO 80302
$-2,024
Cash flow
-13.2%
Cash-on-Cash Return
3.2%
Cap rate
0.5%
Rent to Value Ratio
Active
$367,000
1
bds
|
1
ba
|
538
sqft
|
built
2004
801 Confidence Dr, Longmont, CO 80504
$-1,298
Cash flow
-18.5%
Cash-on-Cash Return
2.0%
Cap rate
0.5%
Rent to Value Ratio
Active
$595,000
2
bds
|
2
ba
|
1,046
sqft
|
built
2004
4500 Baseline Rd, Boulder, CO 80303
$-2,403
Cash flow
-21.1%
Cash-on-Cash Return
1.4%
Cap rate
0.4%
Rent to Value Ratio
Active
$2,400,000
5
bds
|
4
ba
|
3,612
sqft
|
built
1994
1385 Kalmia Ave, Boulder, CO 80304
$-10,451
Cash flow
-22.7%
Cash-on-Cash Return
1.1%
Cap rate
0.2%
Rent to Value Ratio
Active
$4,950,000
4
bds
|
4
ba
|
5,026
sqft
|
built
1978
3746 Wonderland Hill Ave, Boulder, CO 80304
$-21,492
Cash flow
-22.7%
Cash-on-Cash Return
1.1%
Cap rate
0.2%
Rent to Value Ratio
Active
$284,900
1
bds
|
1
ba
|
816
sqft
|
built
1981
400 Emery St, Longmont, CO 80501
$-746
Cash flow
-13.7%
Cash-on-Cash Return
3.1%
Cap rate
0.6%
Rent to Value Ratio