Boulder County Investment Properties for Sale
Browse homes for sale and investment properties in Boulder County. Refine your search by price, property type, or more.
Best cash flowing properties in Boulder County
Active
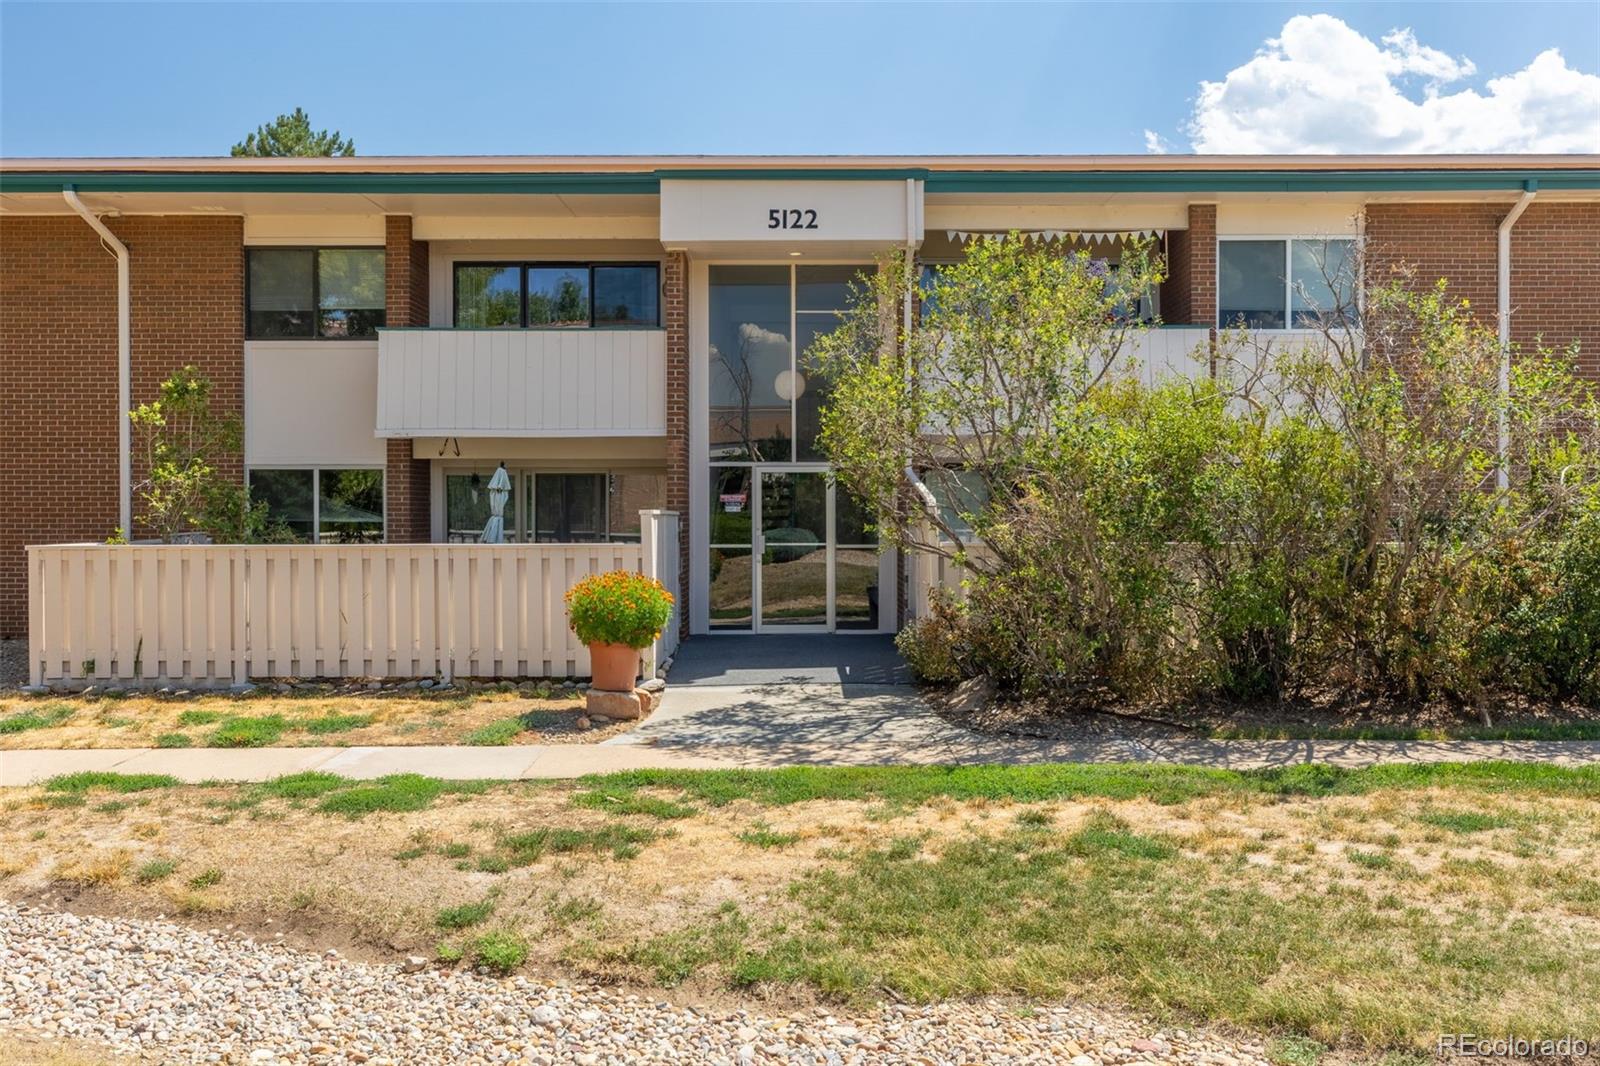
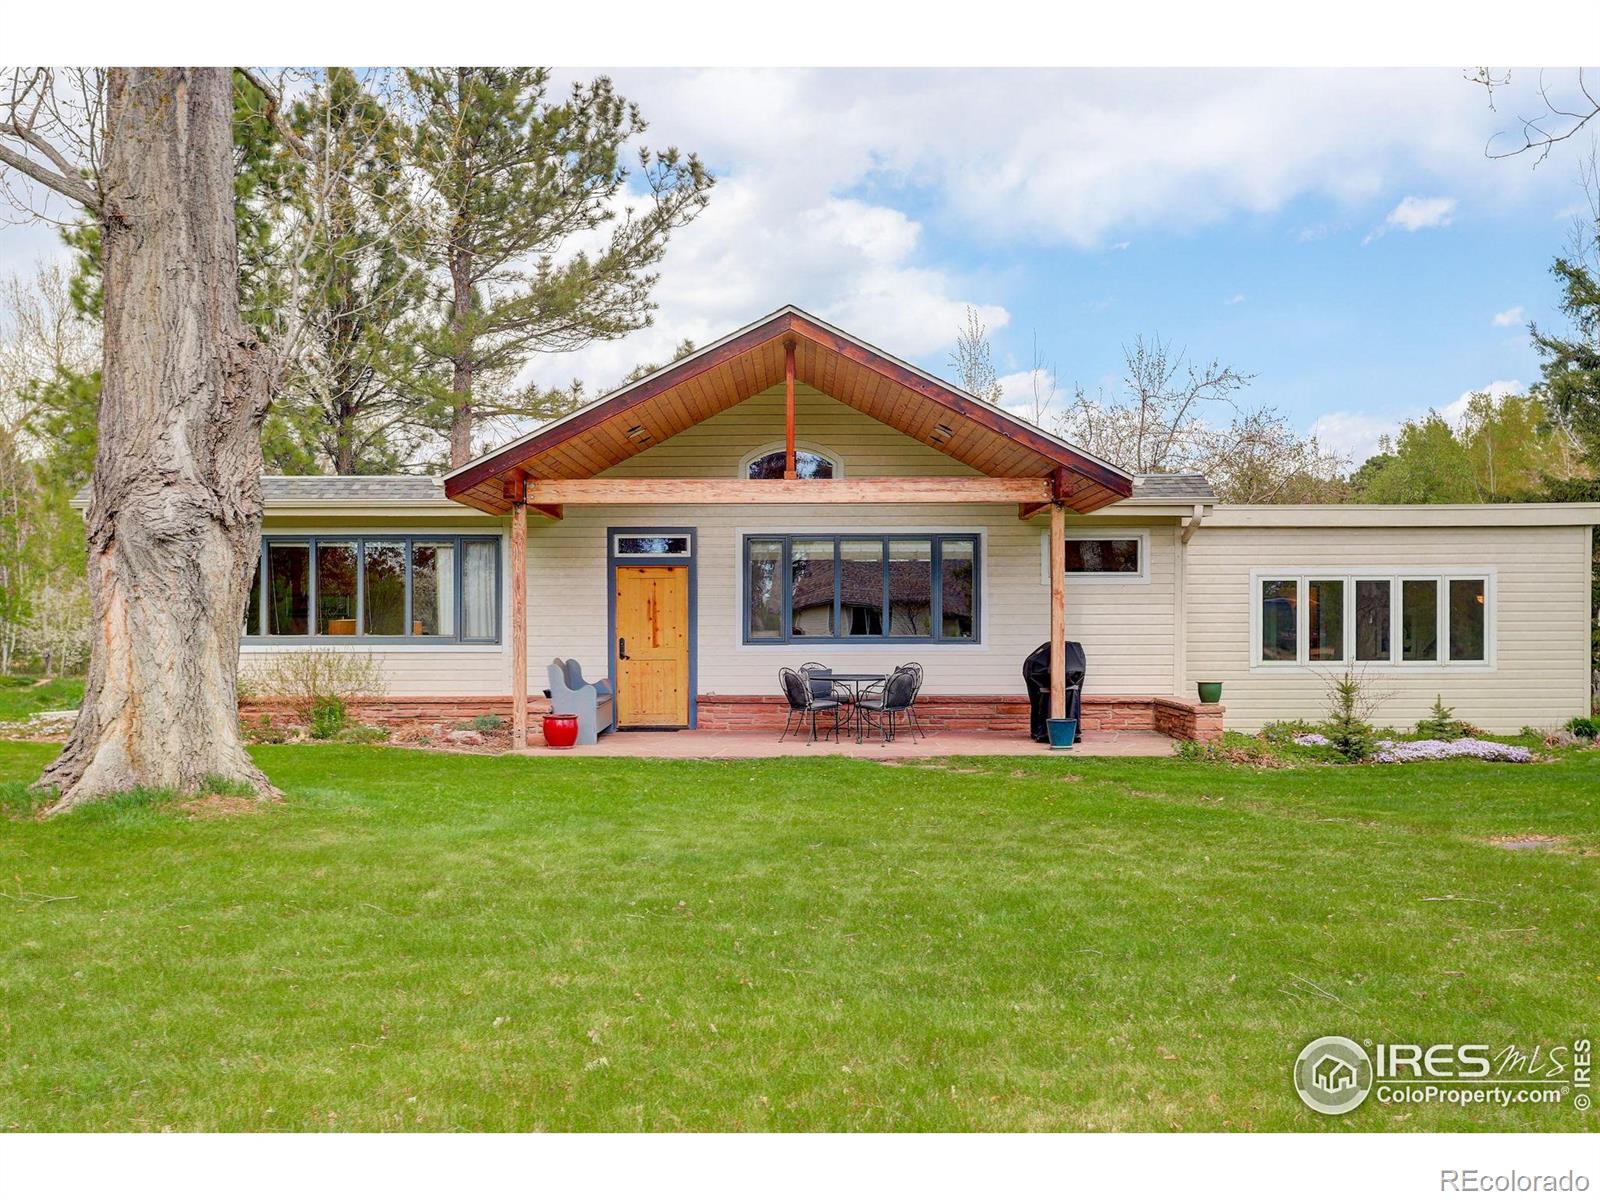
$310,000
3
bds
|
2
ba
|
1,350
sqft
|
built
1969
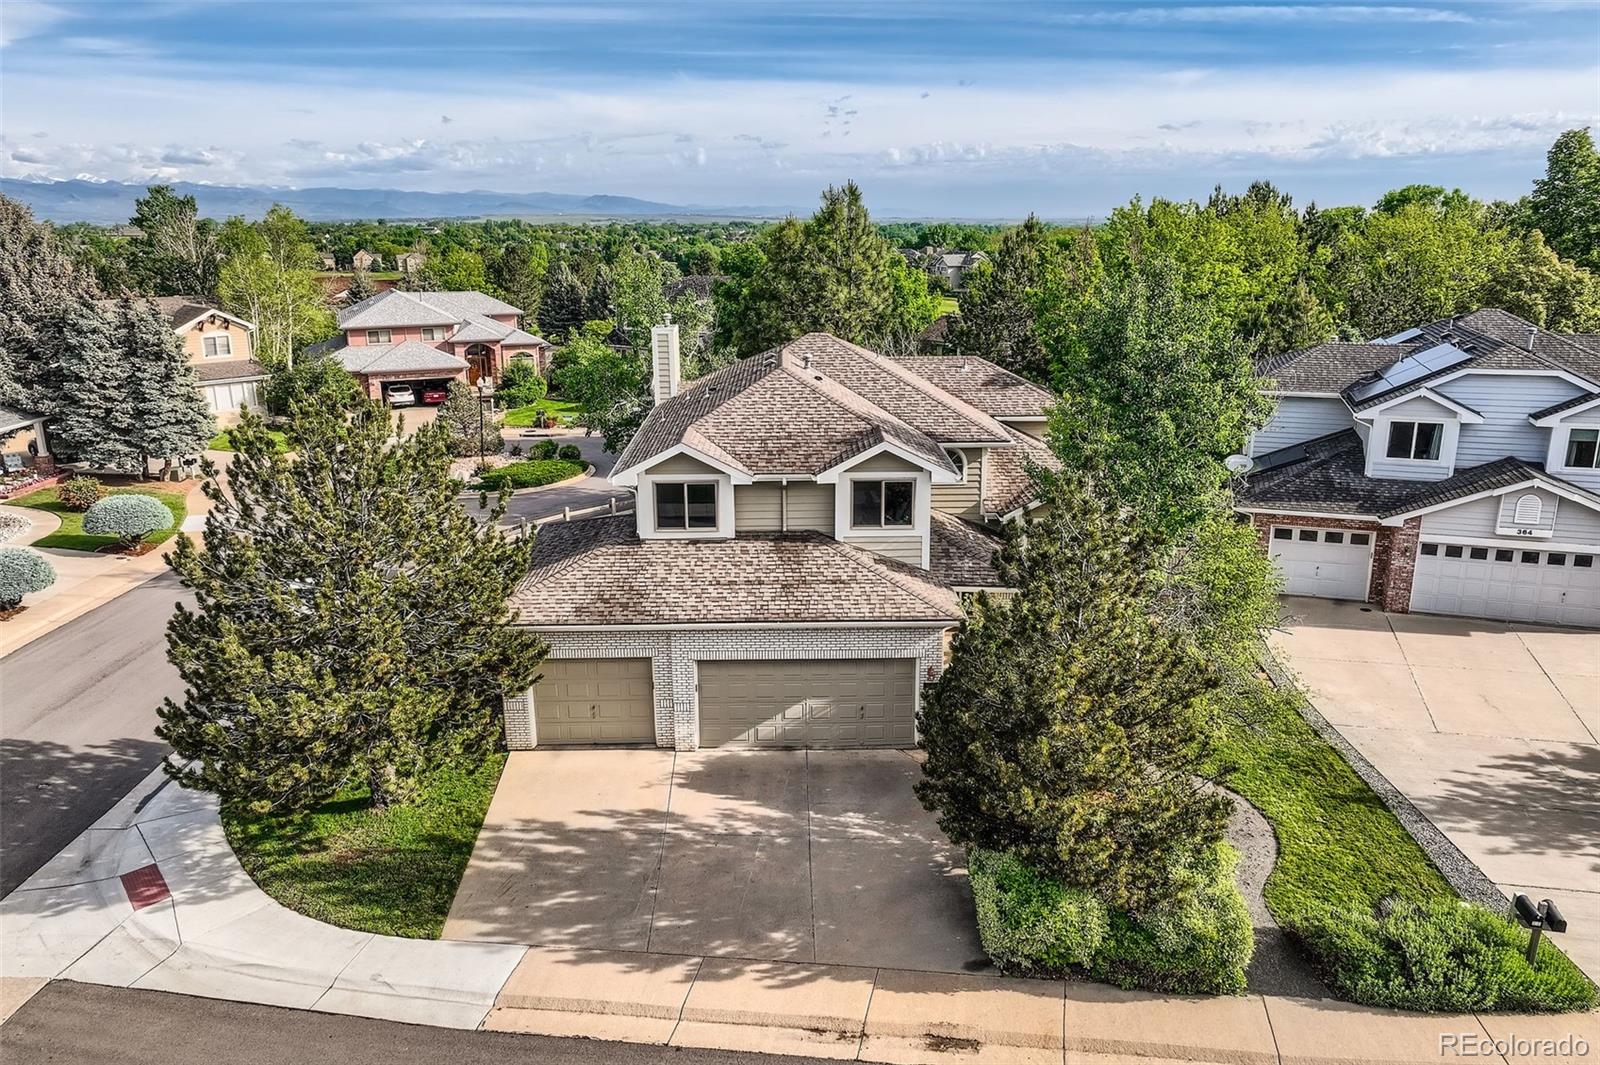
5122 Williams Fork Trl, Boulder, CO 80301
$-515
Cash flow
-8.7%
Cash-on-Cash Return
3.7%
Cap rate
0.7%
Rent to Value Ratio
Active under contract
$260,000
2
bds
|
2
ba
|
859
sqft
|
built
1986
5540 Stonewall Pl, Boulder, CO 80303
$-576
Cash flow
-11.6%
Cash-on-Cash Return
3.0%
Cap rate
0.7%
Rent to Value Ratio
1,203 out of 1,343 properties for sale in Boulder County
Limited Results Shown
Create a free account, or log in to reveal all property listings and enjoy the complete experience.
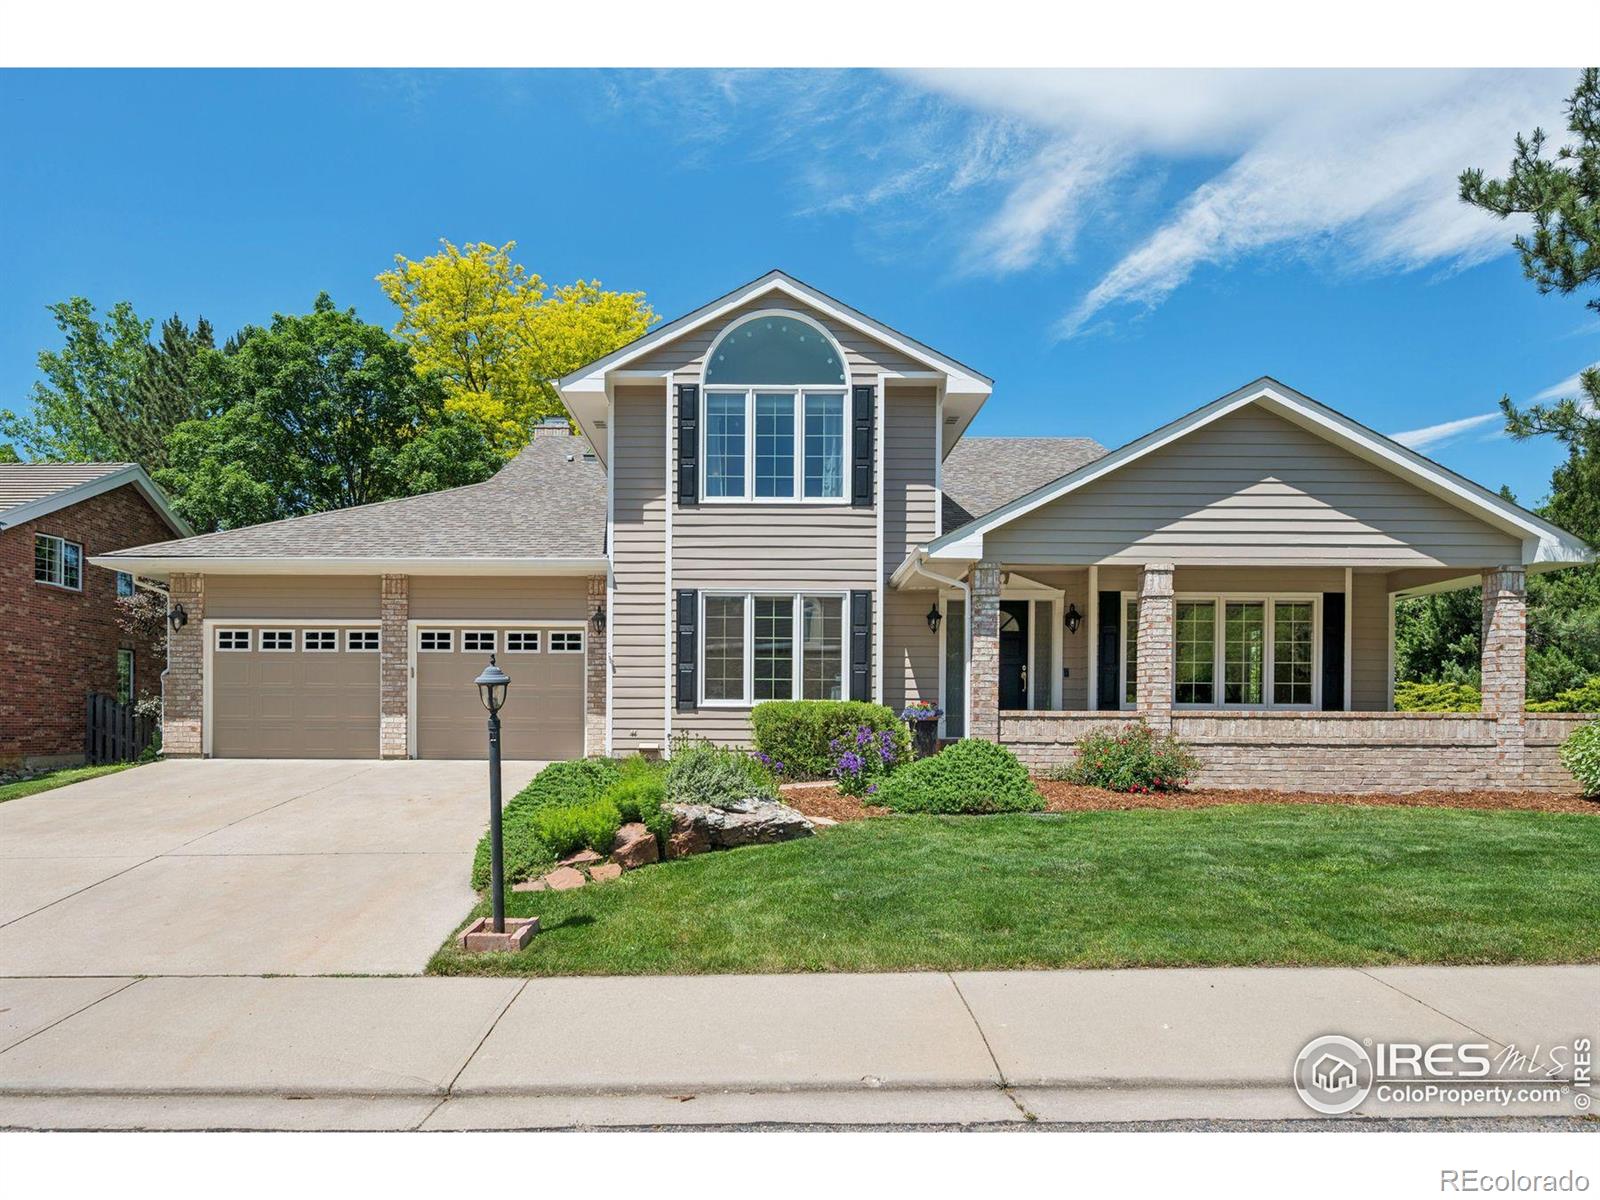
Active
$885,000
4
bds
|
3
ba
|
1,832
sqft
|
built
1976
116 Monarch St, Louisville, CO 80027
$-1,692
Cash flow
-10.0%
Cash-on-Cash Return
3.4%
Cap rate
0.5%
Rent to Value Ratio
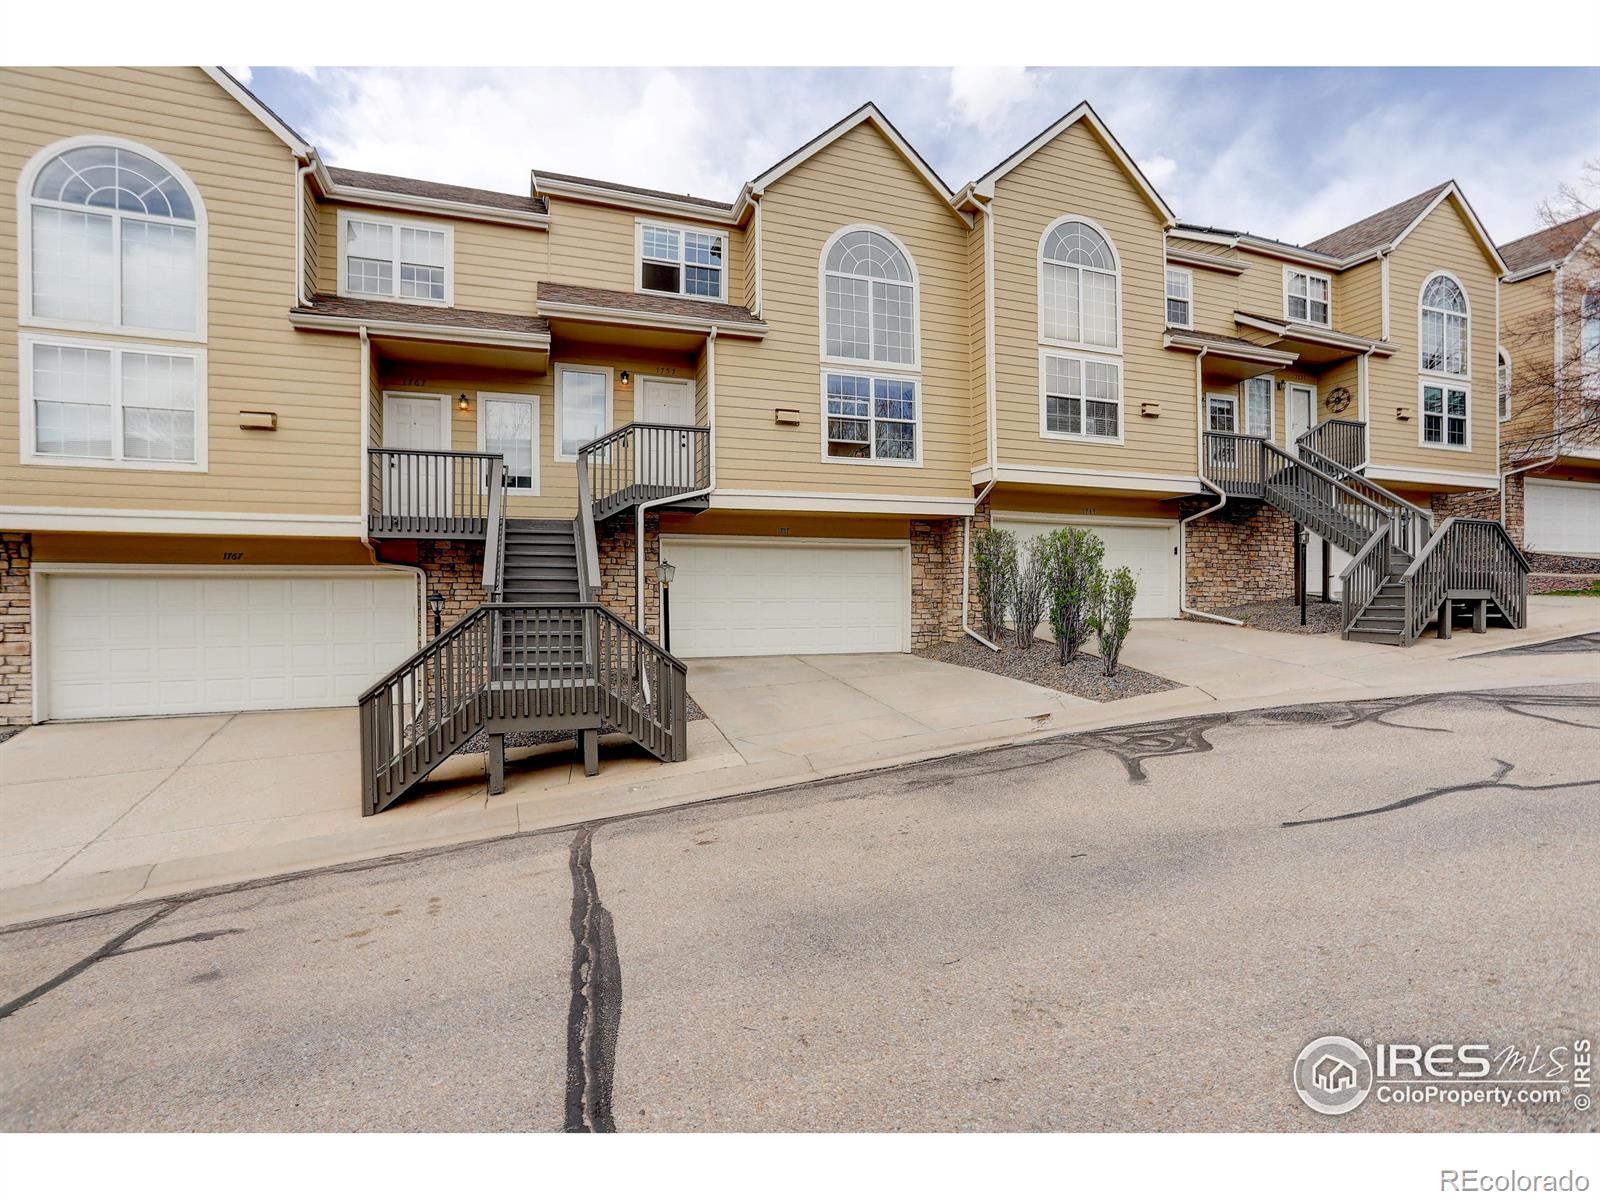
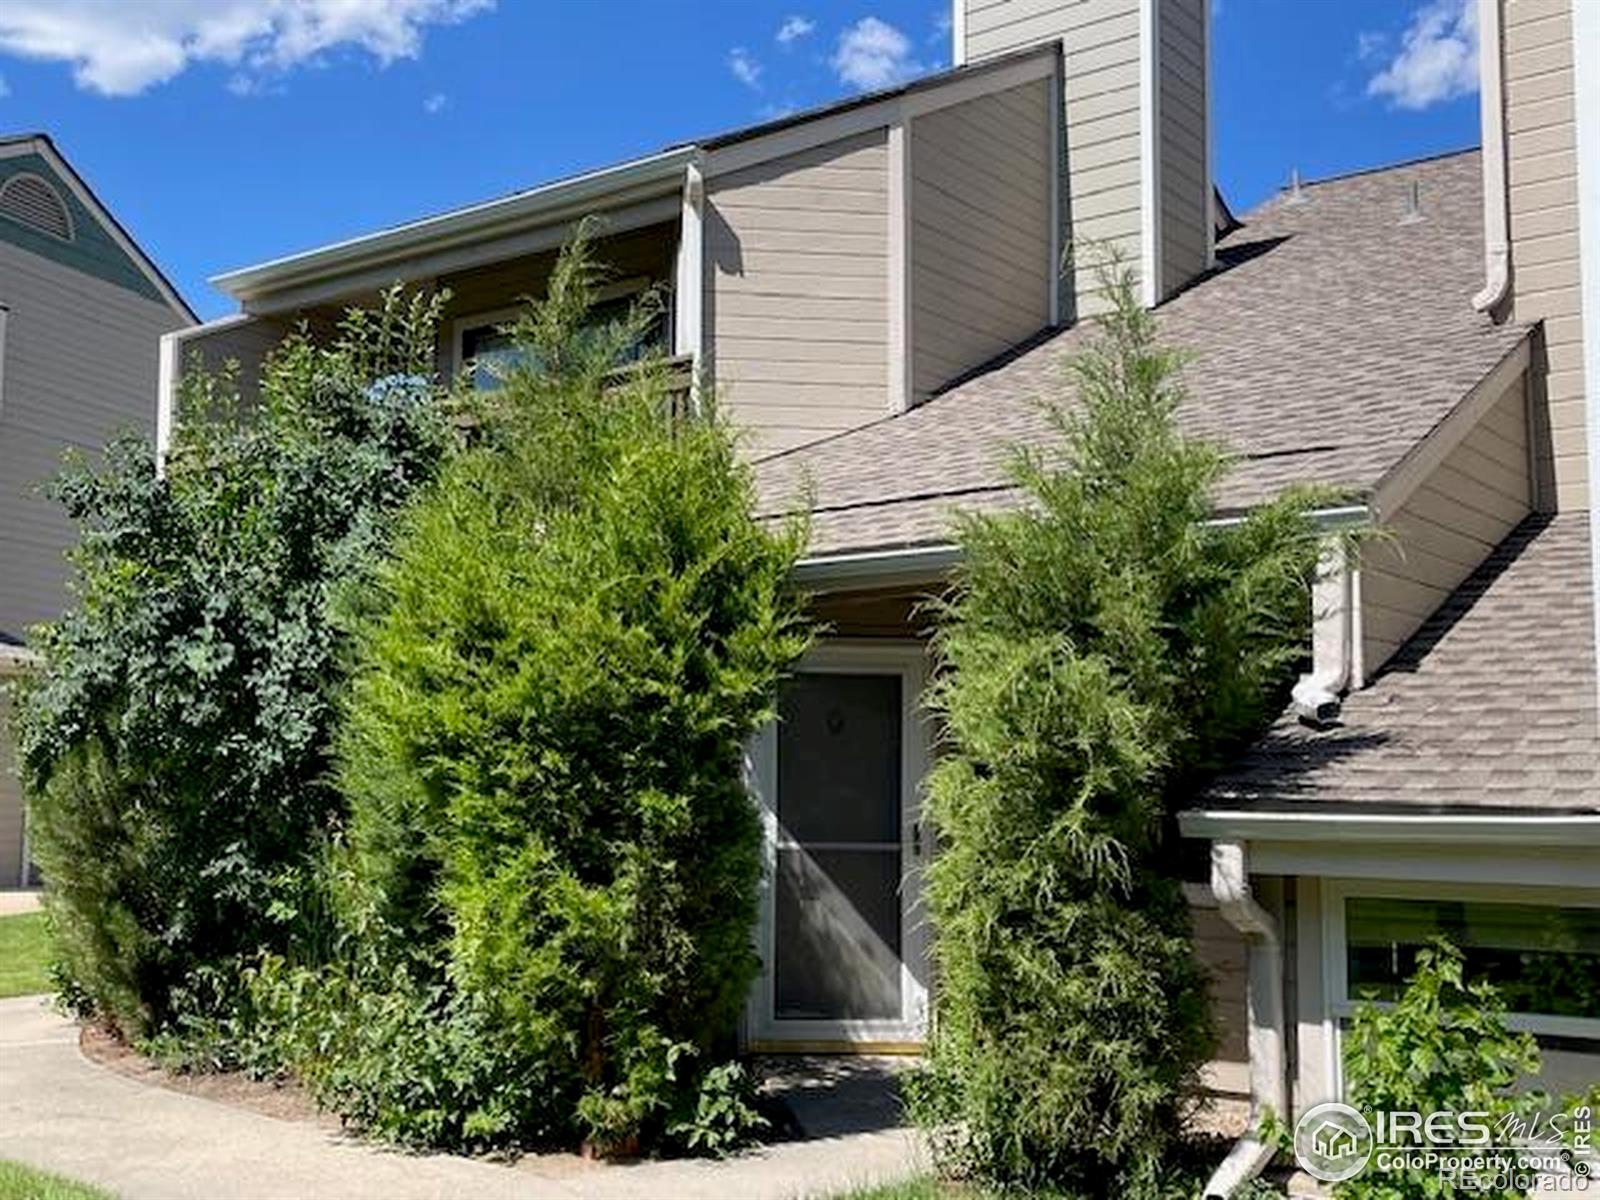
Active
$514,000
2
bds
|
2
ba
|
1,286
sqft
|
built
1996
1757 High Plains Ct, Superior, CO 80027
$-1,485
Cash flow
-15.1%
Cash-on-Cash Return
2.2%
Cap rate
0.5%
Rent to Value Ratio

Active
$625,000
3
bds
|
3
ba
|
2,136
sqft
|
built
2003
1824 Ute Creek Dr, Longmont, CO 80504
$-1,356
Cash flow
-11.3%
Cash-on-Cash Return
3.1%
Cap rate
0.4%
Rent to Value Ratio
Active
$1,195,000
4
bds
|
4
ba
|
3,282
sqft
|
built
1993
1987 Grayden Ct, Superior, CO 80027
$-3,082
Cash flow
-13.5%
Cash-on-Cash Return
2.6%
Cap rate
0.4%
Rent to Value Ratio
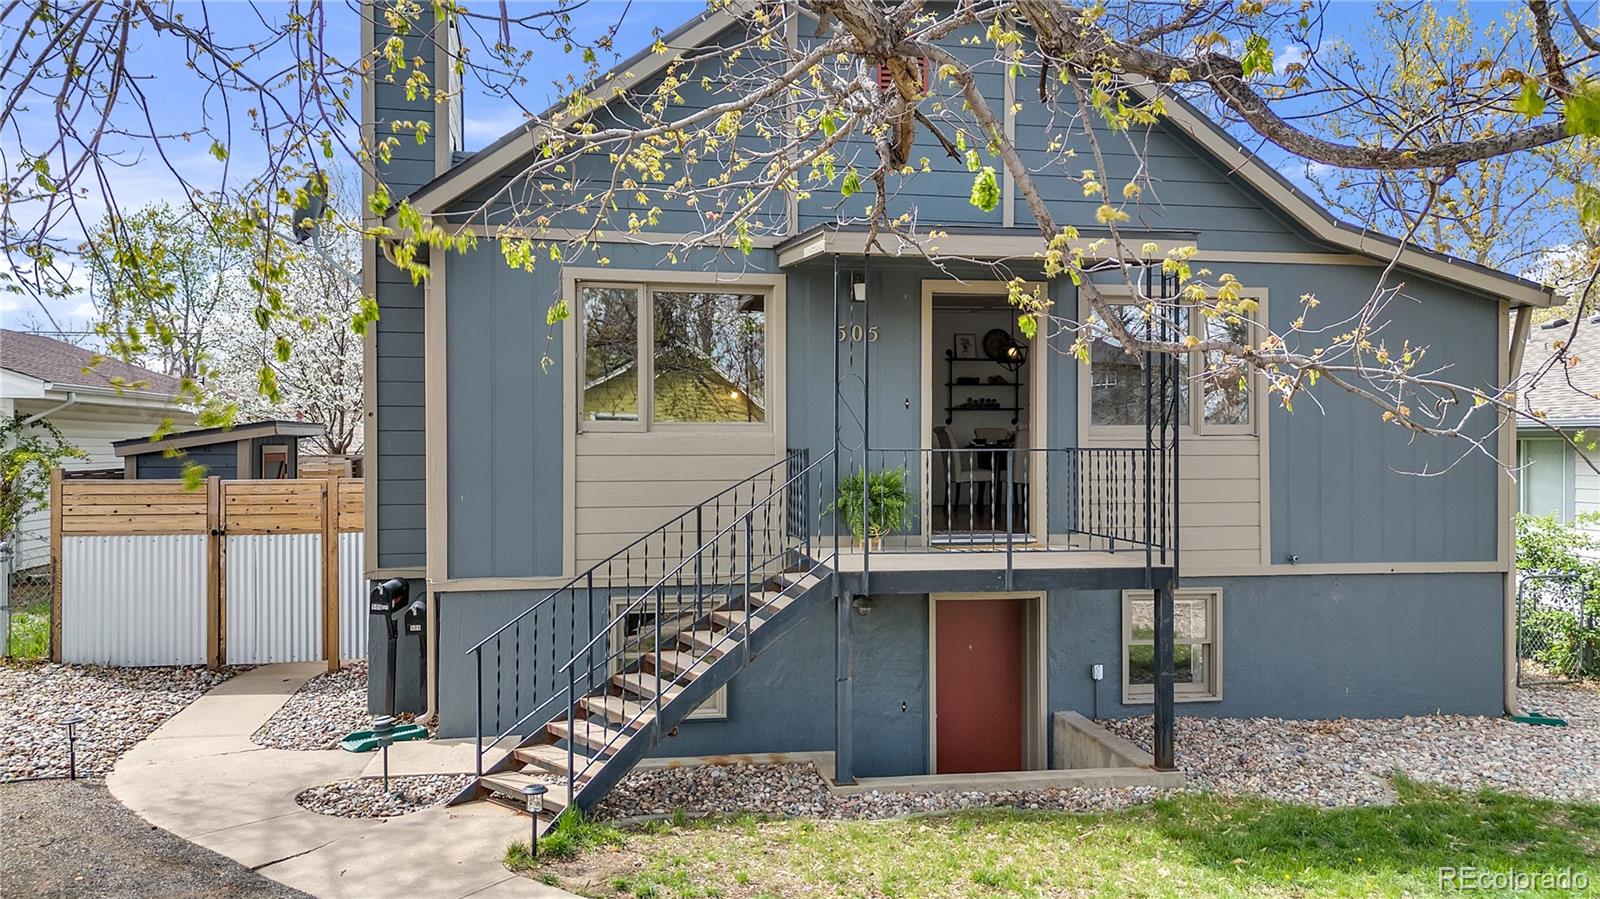
Active under contract
$825,000
5
bds
|
2
ba
|
2,446
sqft
|
built
1958
505 S Roosevelt Ave, Lafayette, CO 80026
$-2,196
Cash flow
-13.9%
Cash-on-Cash Return
2.5%
Cap rate
0.4%
Rent to Value Ratio
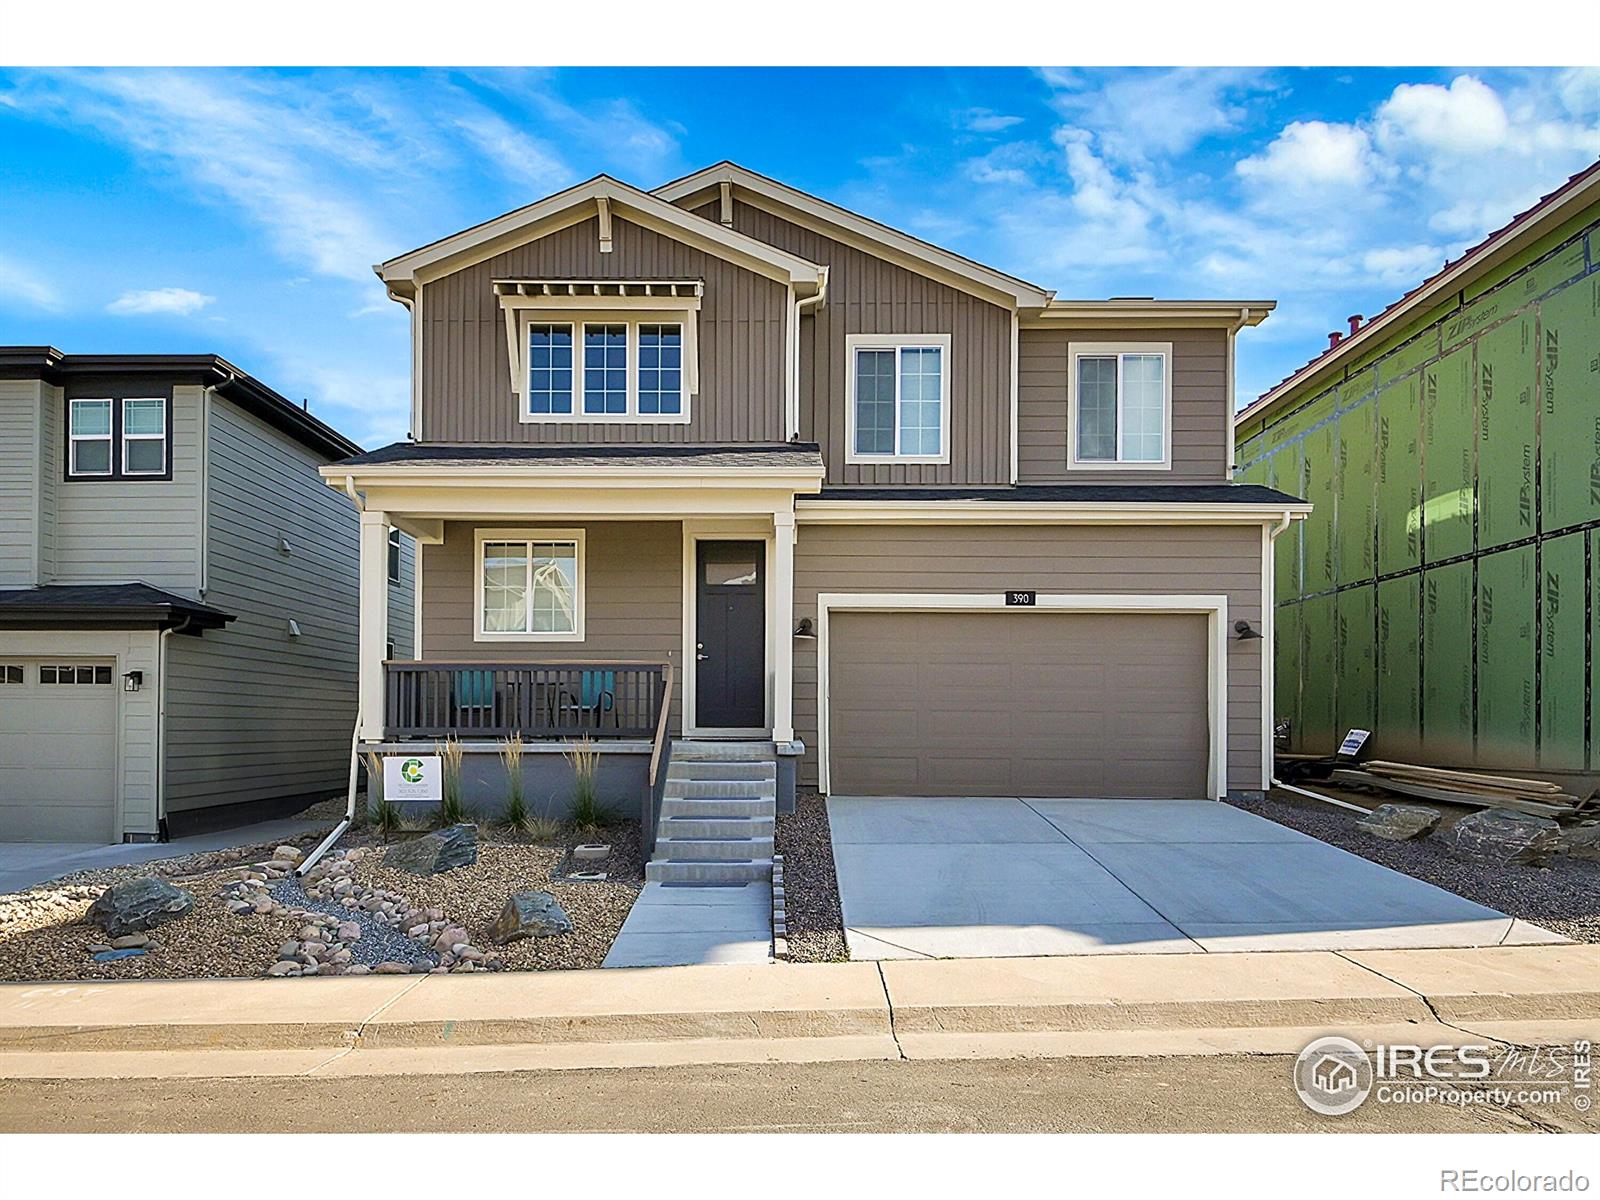
Active
$885,000
3
bds
|
3
ba
|
2,168
sqft
|
built
2023
390 Blackfoot St, Superior, CO 80027
$-2,249
Cash flow
-13.3%
Cash-on-Cash Return
2.6%
Cap rate
0.4%
Rent to Value Ratio
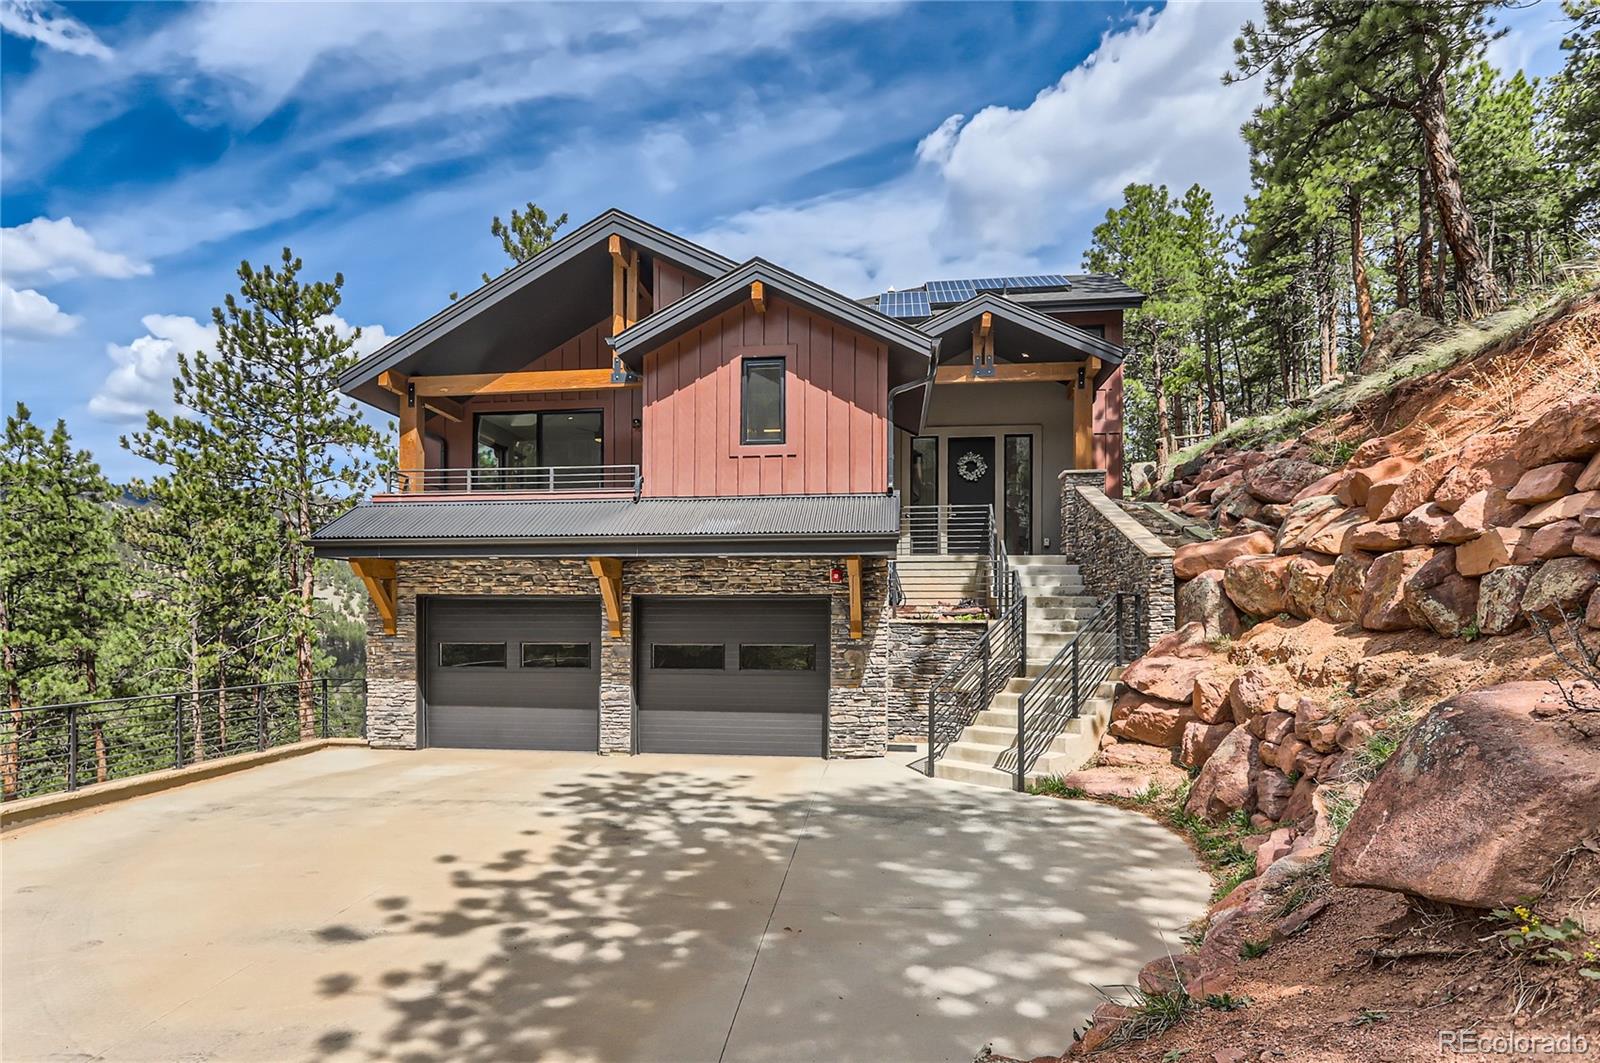
Active
$649,900
3
bds
|
2
ba
|
1,770
sqft
|
built
1997
248 Copperdale Ln, Golden, CO 80403
$-1,124
Cash flow
-9.0%
Cash-on-Cash Return
3.6%
Cap rate
0.5%
Rent to Value Ratio
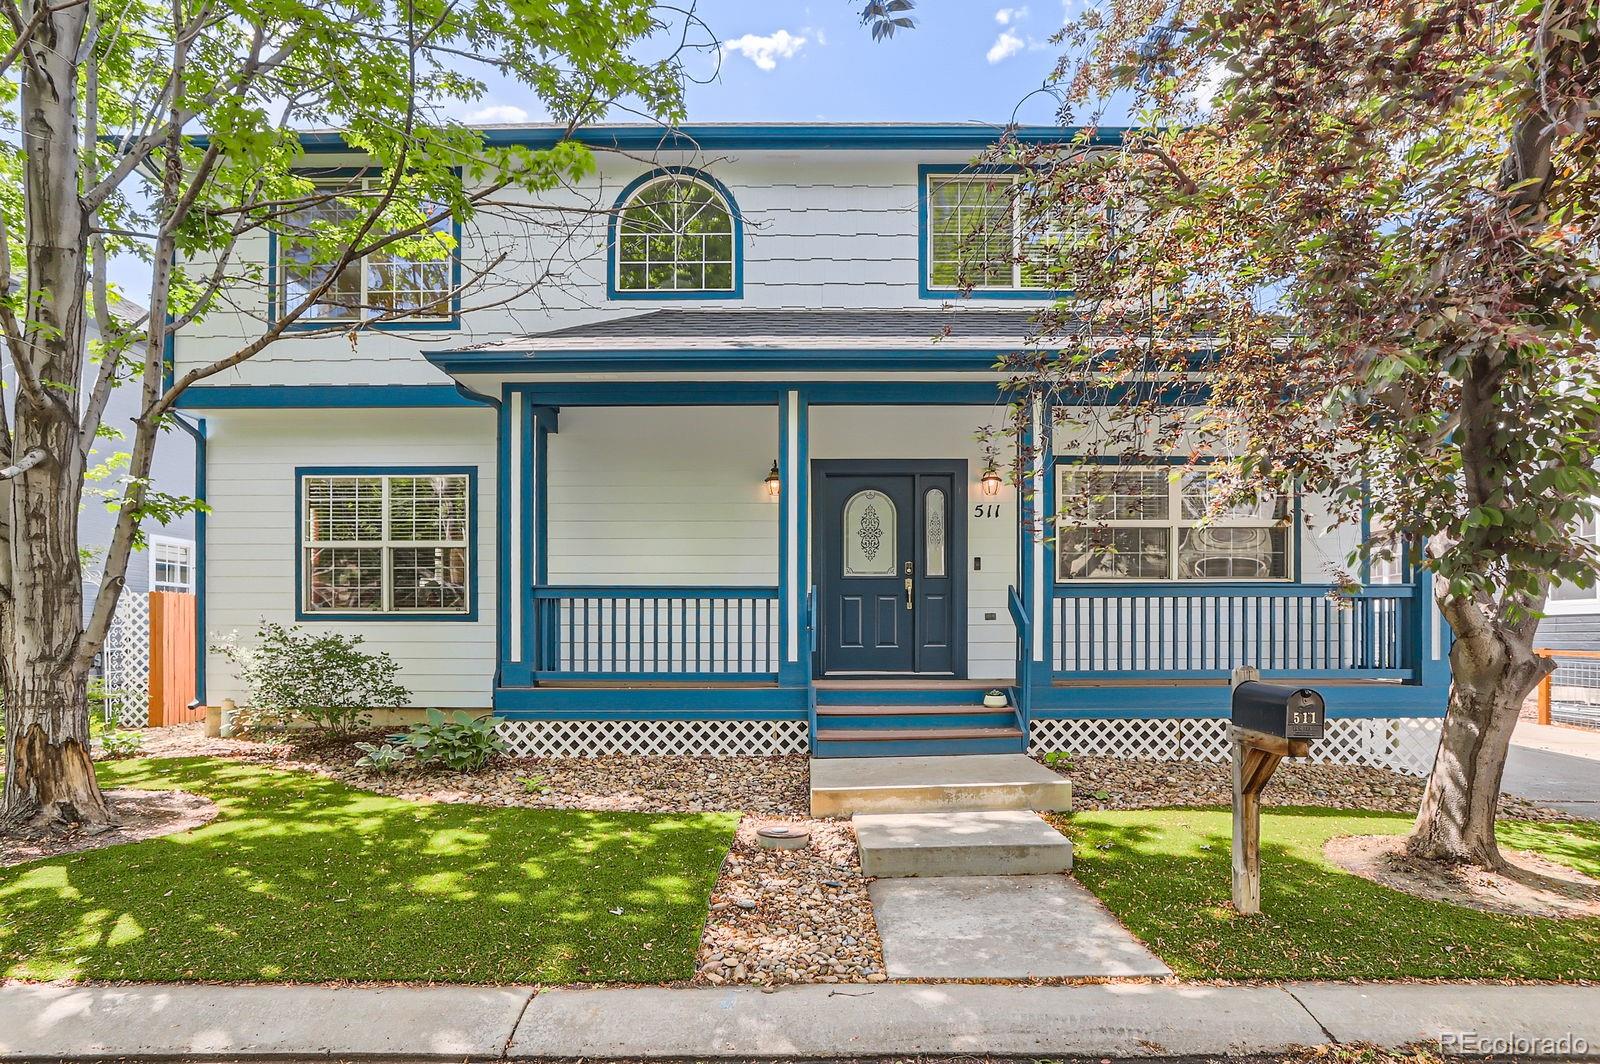
Active
$575,000
3
bds
|
3
ba
|
1,707
sqft
|
built
2003
511 Noel Ave, Longmont, CO 80501
$-1,151
Cash flow
-10.4%
Cash-on-Cash Return
3.3%
Cap rate
0.5%
Rent to Value Ratio
Active
$2,500,000
4
bds
|
4
ba
|
3,021
sqft
|
built
2019
795 Pine Brook Rd, Boulder, CO 80304
$-7,342
Cash flow
-15.3%
Cash-on-Cash Return
2.2%
Cap rate
0.3%
Rent to Value Ratio
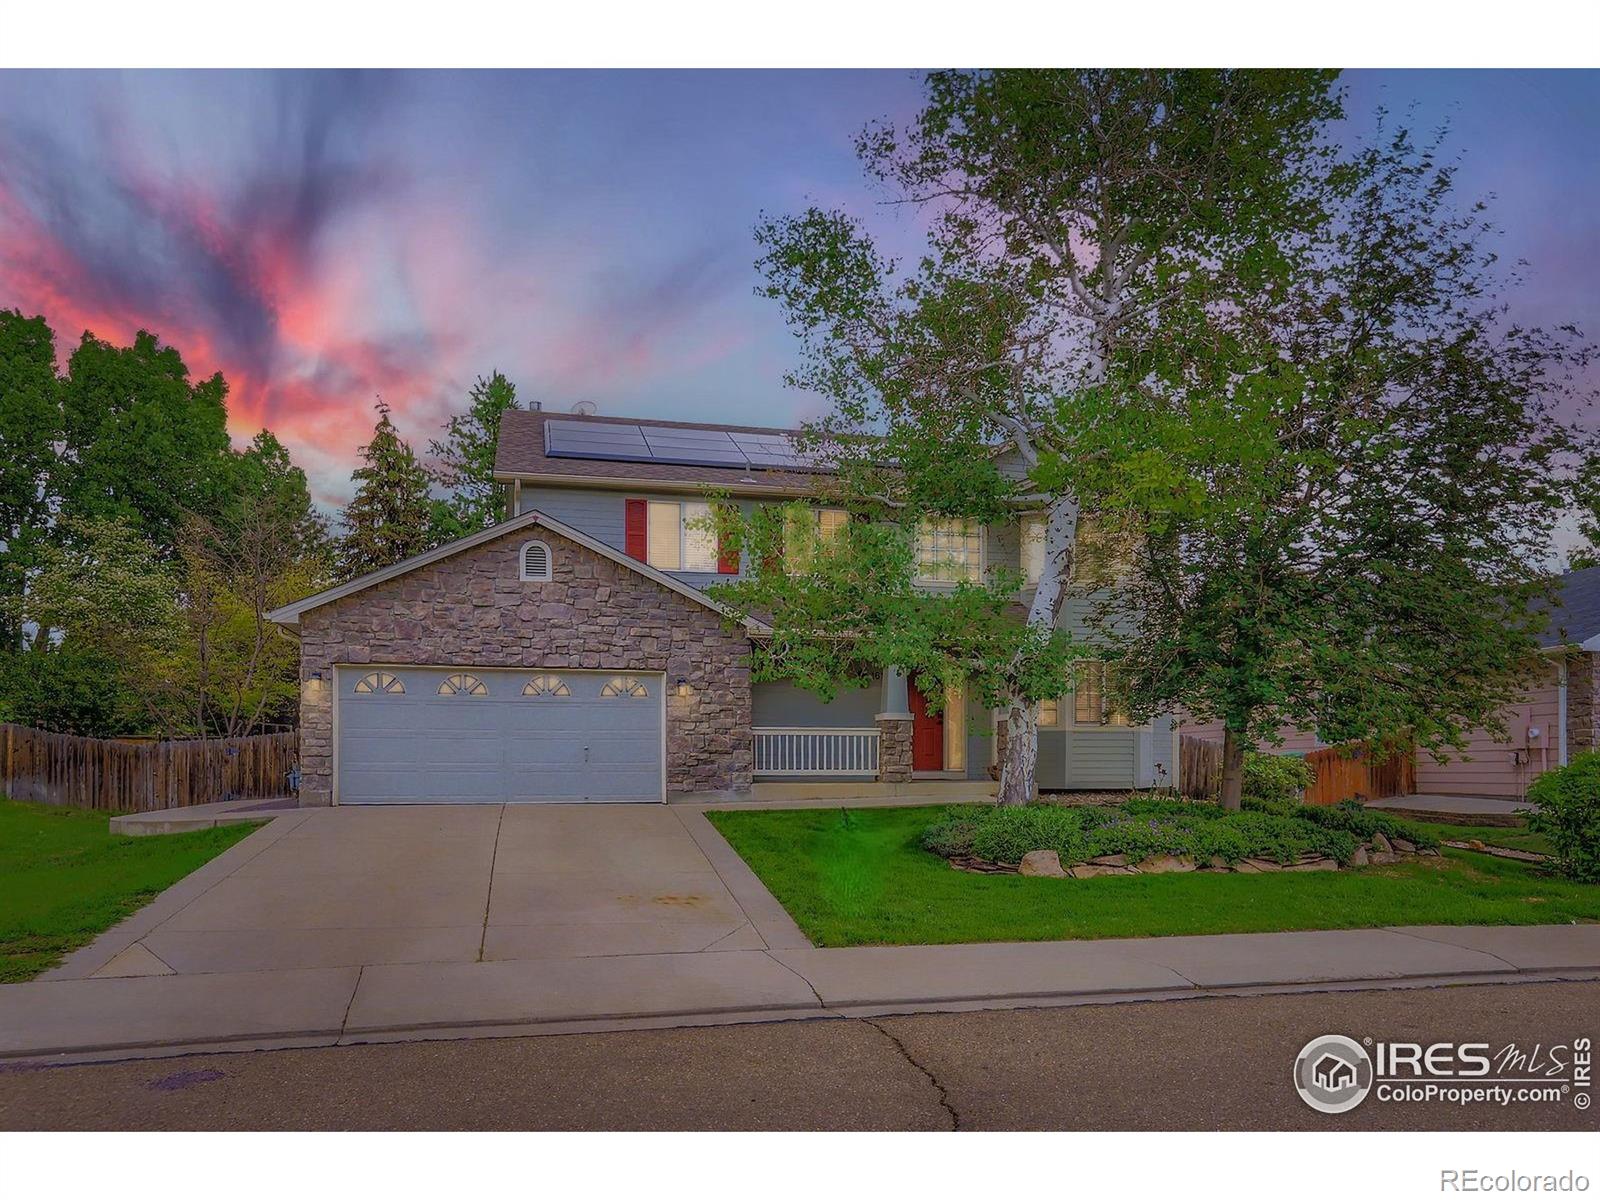
Active
$310,000
3
bds
|
2
ba
|
1,350
sqft
|
built
1969
5122 Williams Fork Trl, Boulder, CO 80301
$-515
Cash flow
-8.7%
Cash-on-Cash Return
3.7%
Cap rate
0.7%
Rent to Value Ratio
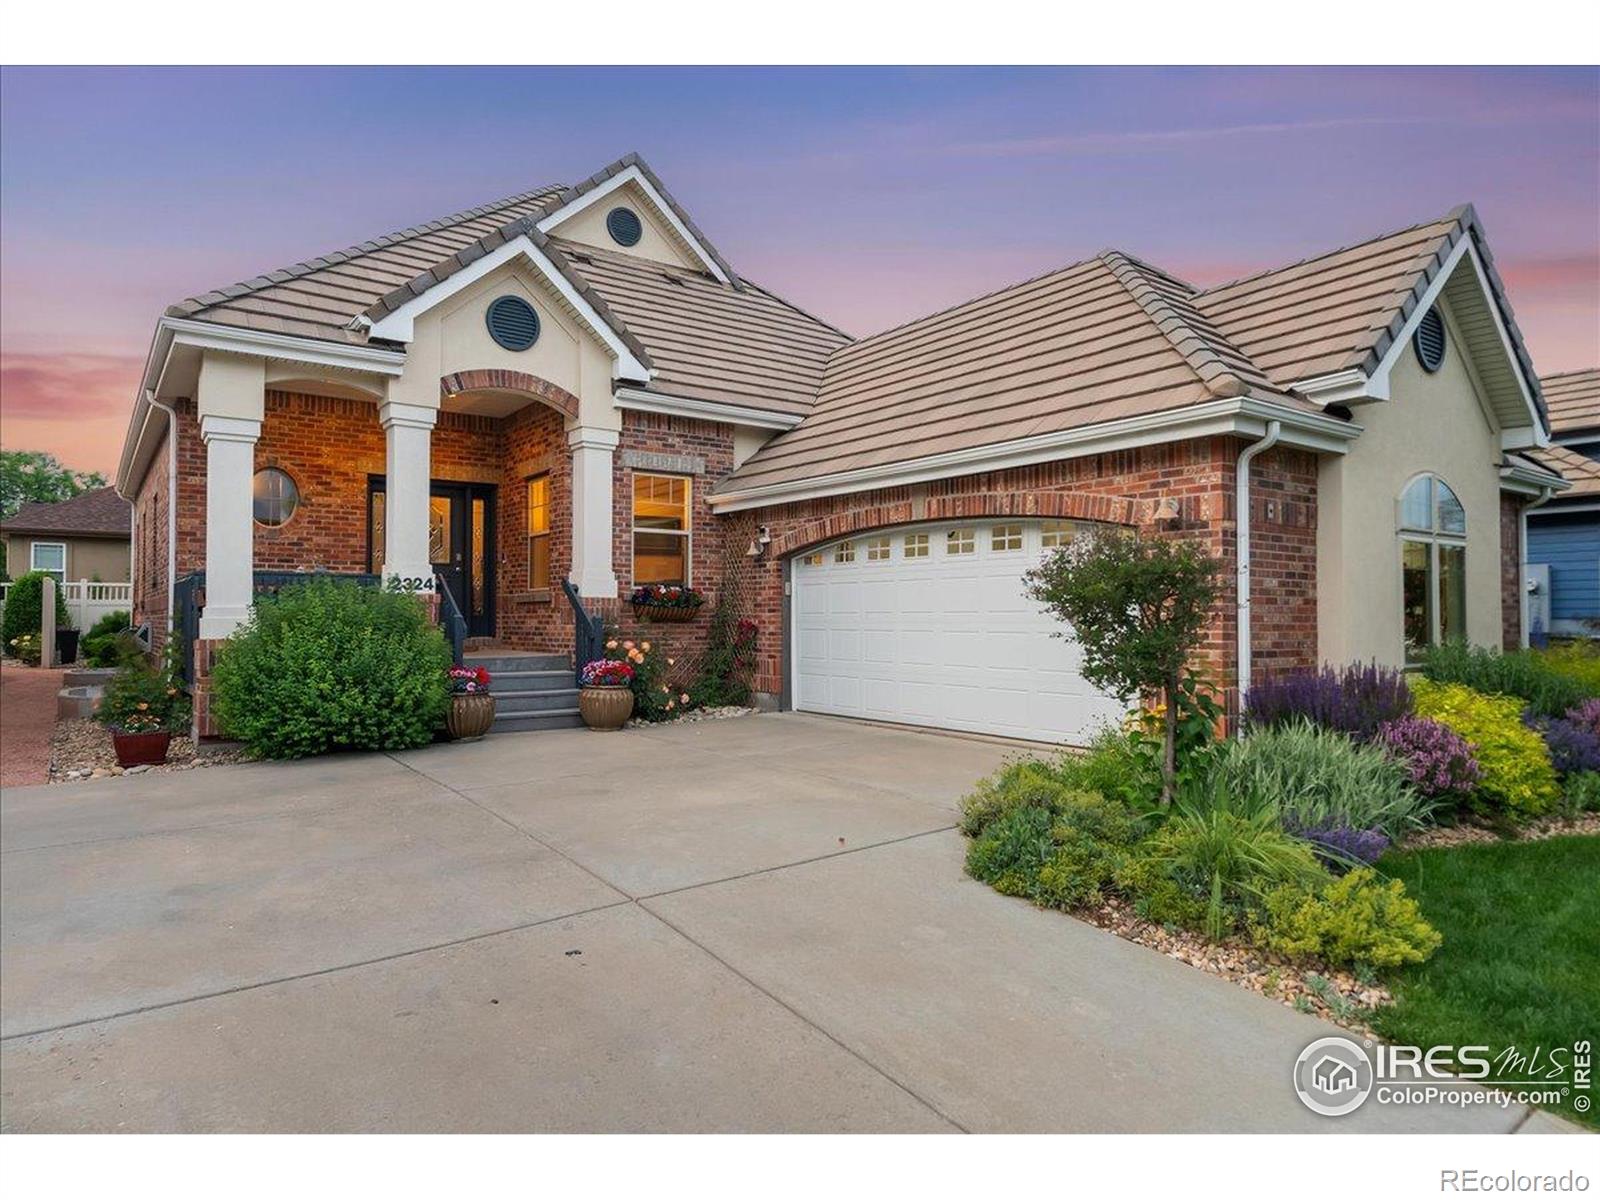
Active
$679,500
3
bds
|
3
ba
|
2,897
sqft
|
built
2005
2324 Steppe Dr, Longmont, CO 80504
$-1,577
Cash flow
-12.1%
Cash-on-Cash Return
2.9%
Cap rate
0.4%
Rent to Value Ratio
Active under contract
$395,000
1
bds
|
1
ba
|
720
sqft
|
built
1967
850 20th St, Boulder, CO 80302
$-1,069
Cash flow
-14.1%
Cash-on-Cash Return
2.4%
Cap rate
0.5%
Rent to Value Ratio
Active under contract
$260,000
2
bds
|
2
ba
|
859
sqft
|
built
1986
5540 Stonewall Pl, Boulder, CO 80303
$-576
Cash flow
-11.6%
Cash-on-Cash Return
3.0%
Cap rate
0.7%
Rent to Value Ratio
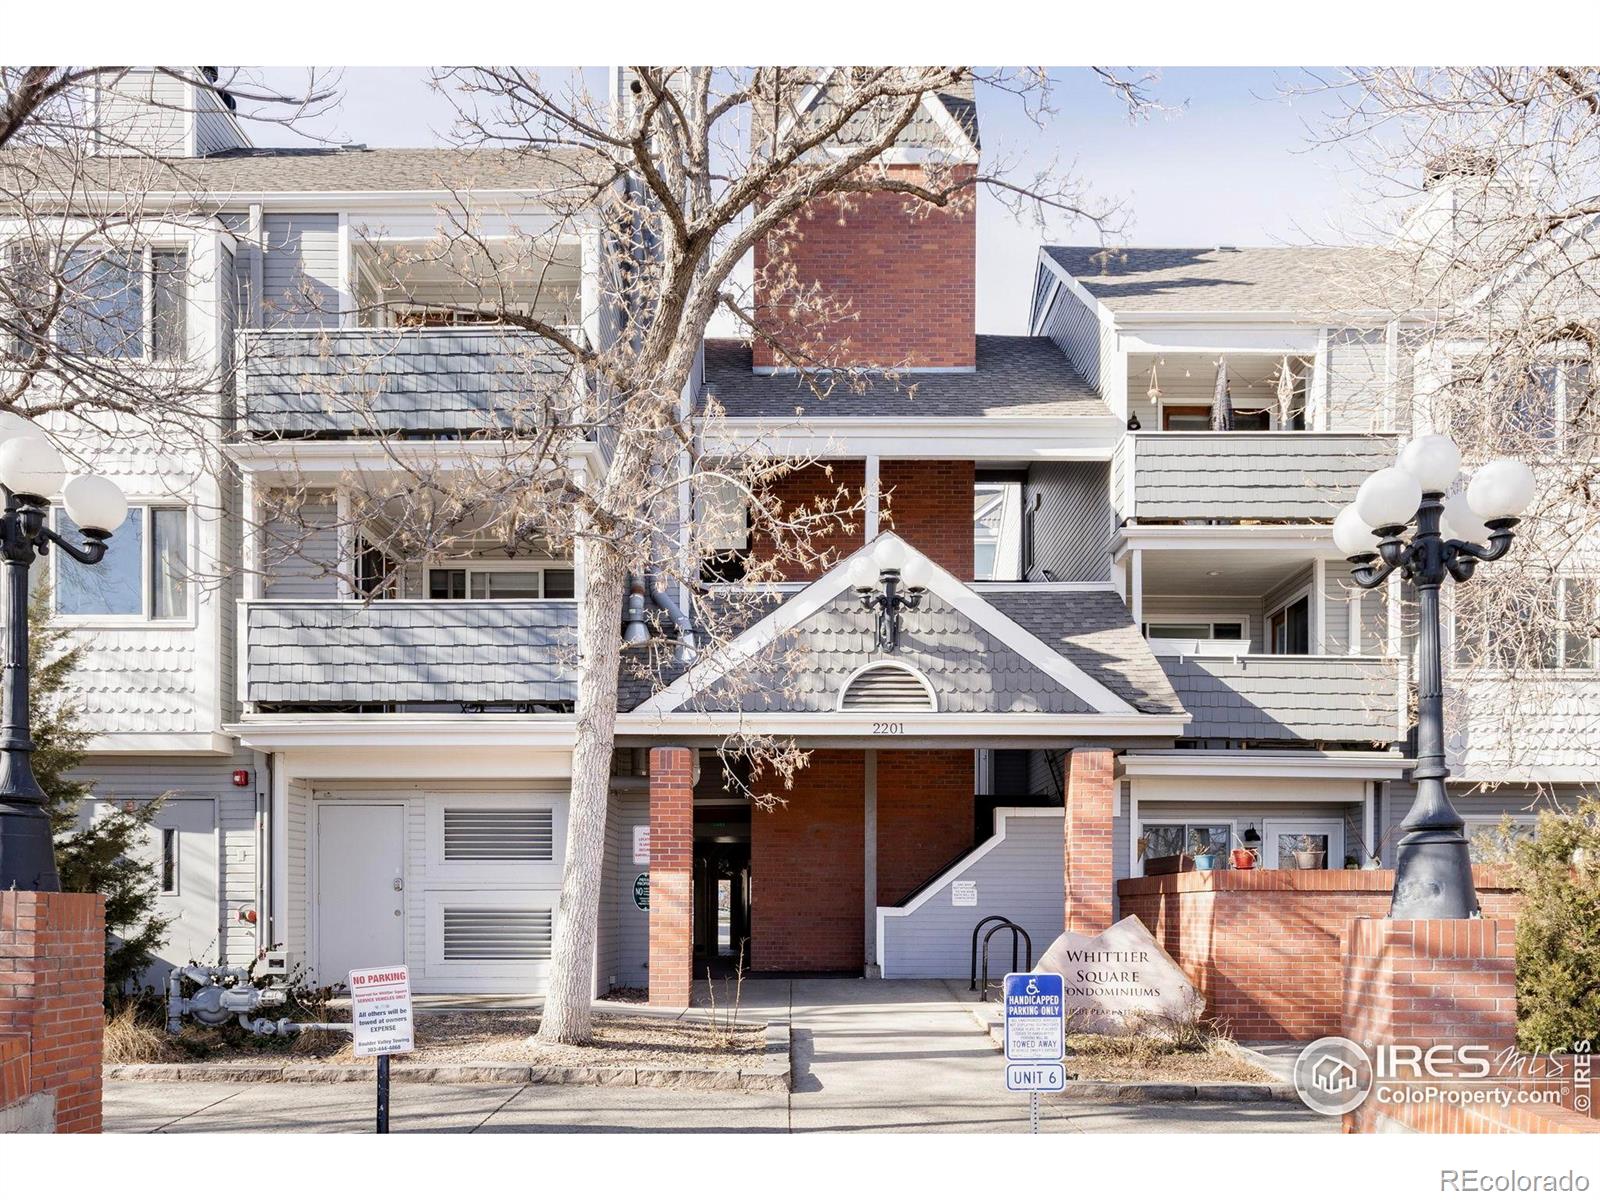
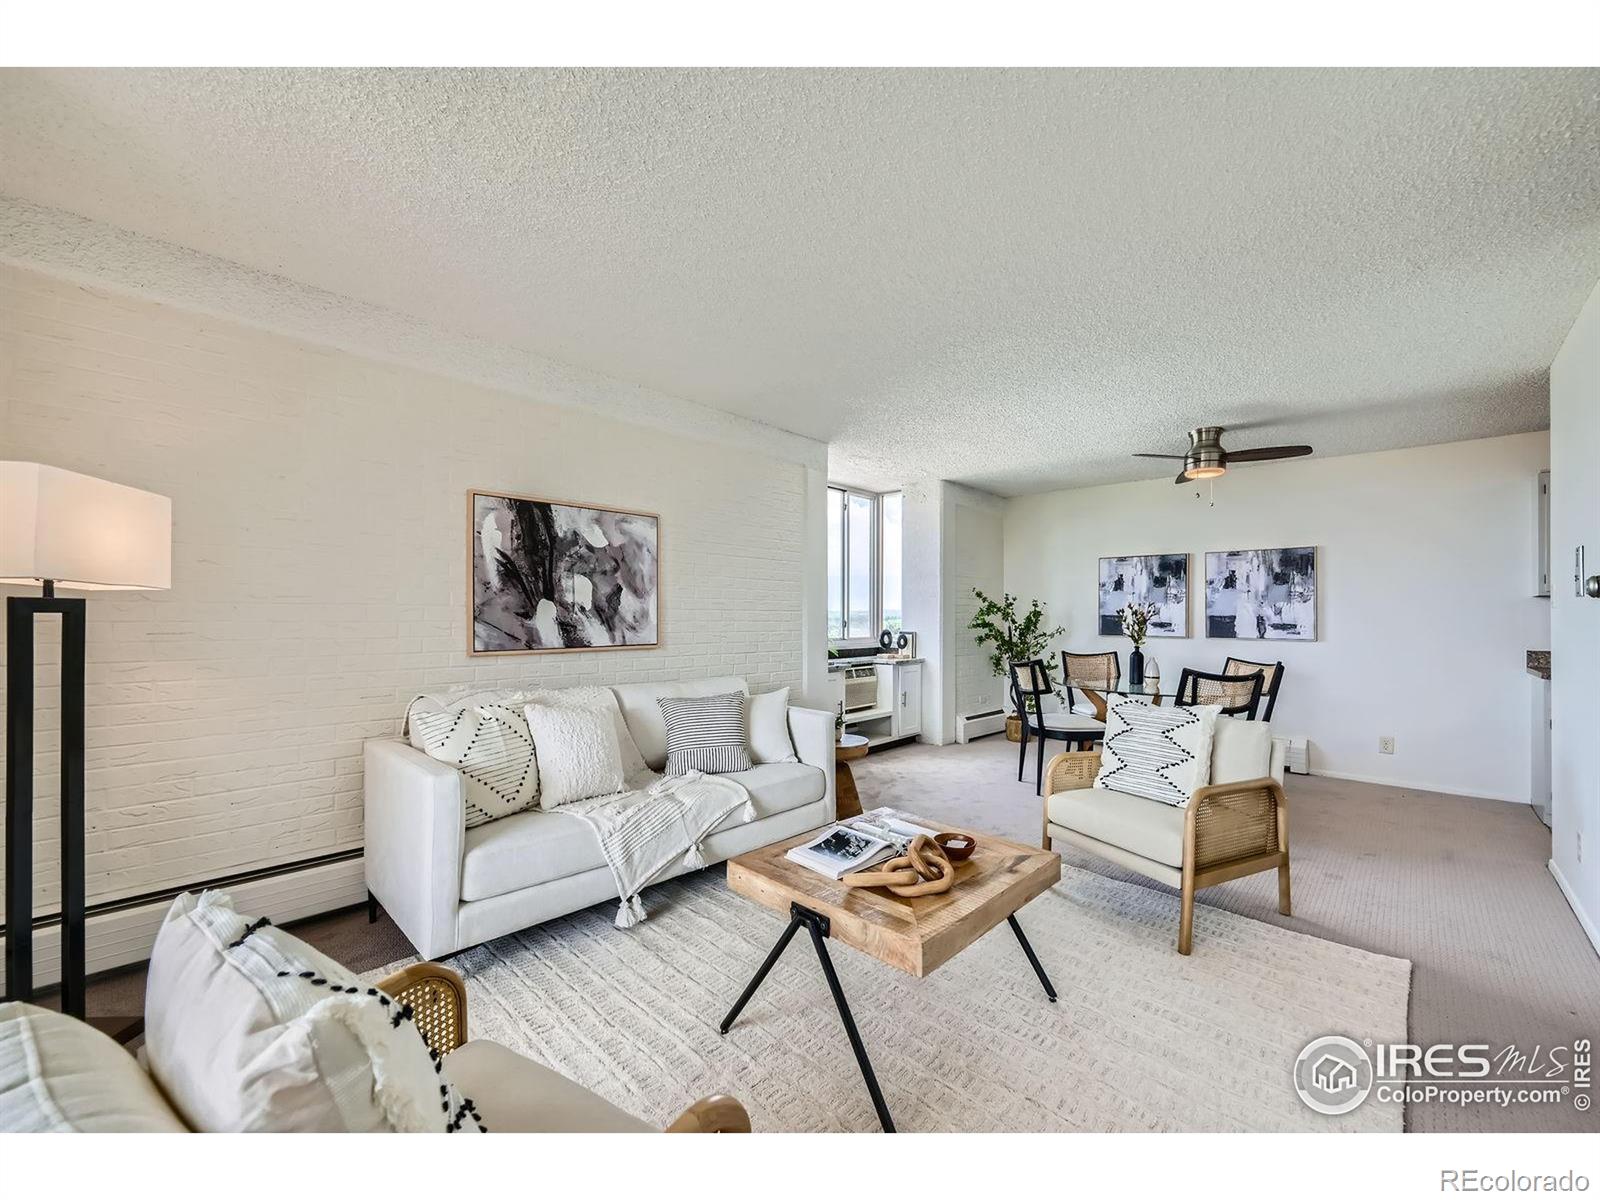
Active
$425,000
1
bds
|
1
ba
|
611
sqft
|
built
1984
2201 Pearl St, Boulder, CO 80302
$-1,246
Cash flow
-15.3%
Cash-on-Cash Return
2.2%
Cap rate
0.5%
Rent to Value Ratio
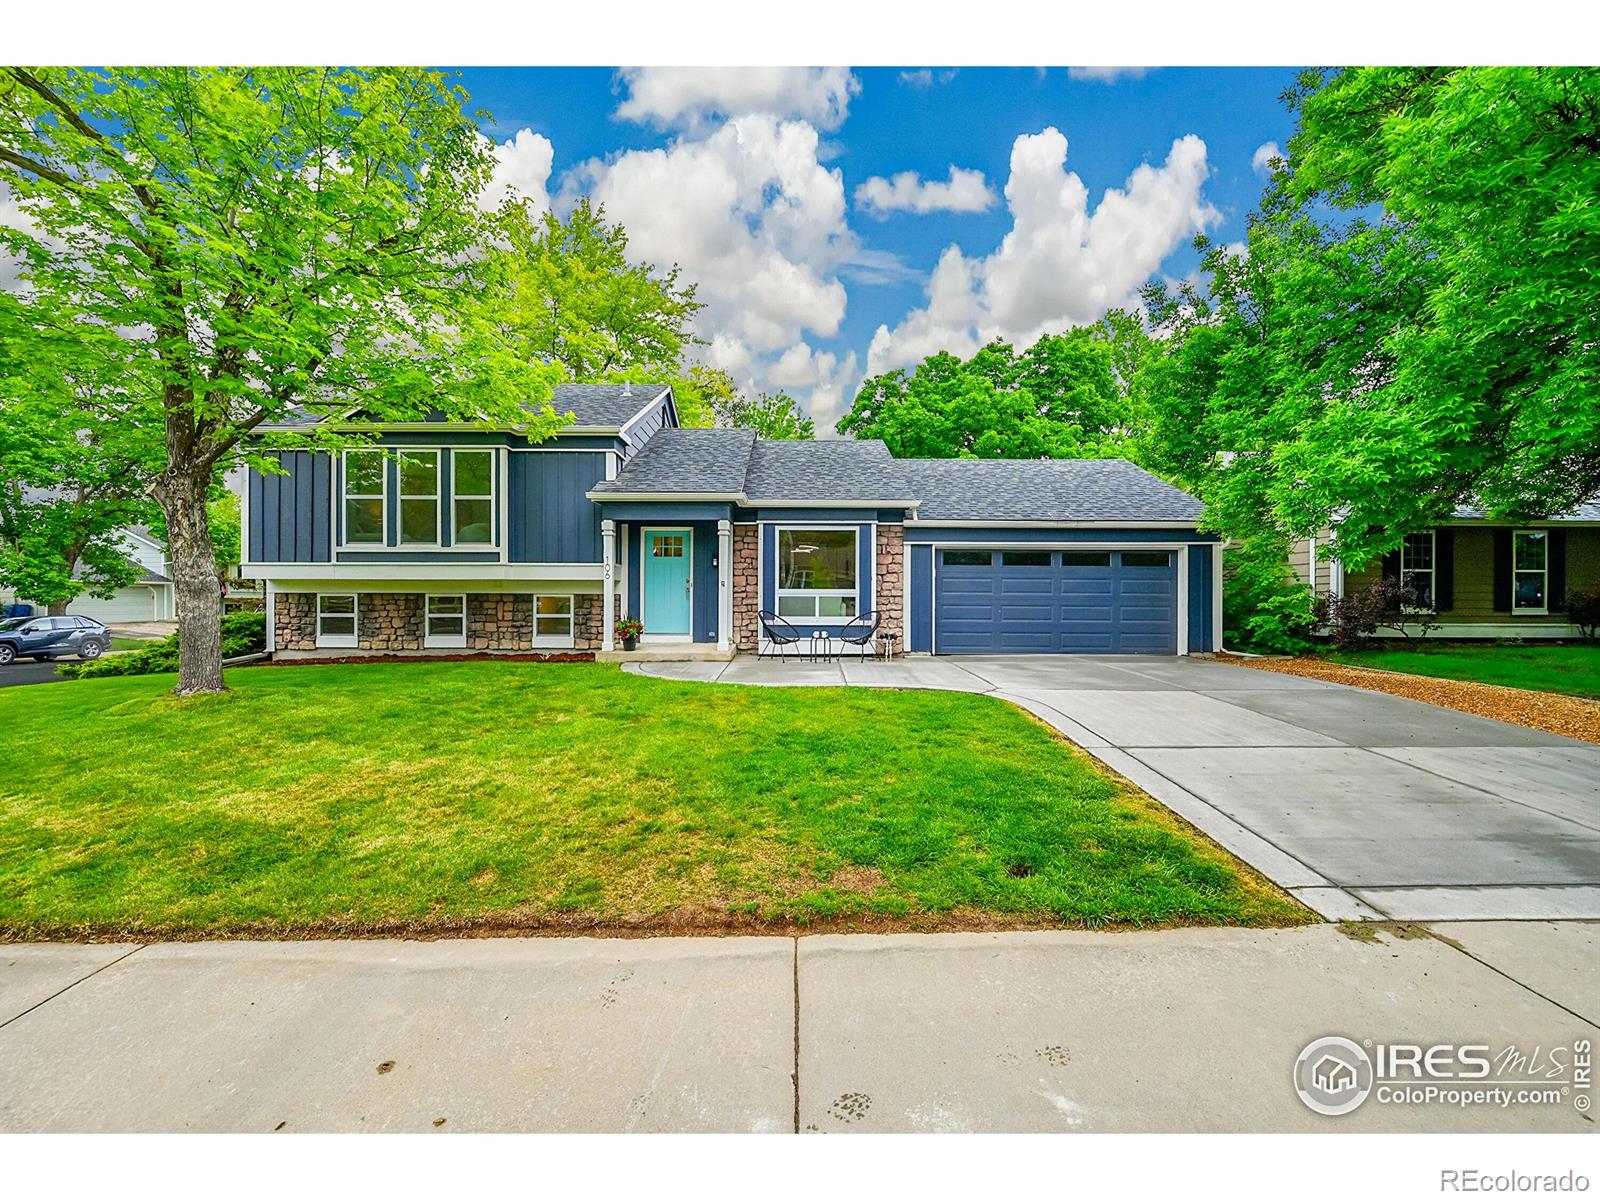
Active
$939,000
4
bds
|
2
ba
|
1,760
sqft
|
built
1983
106 S Madison Ave, Louisville, CO 80027
$-2,786
Cash flow
-15.5%
Cash-on-Cash Return
2.1%
Cap rate
0.3%
Rent to Value Ratio
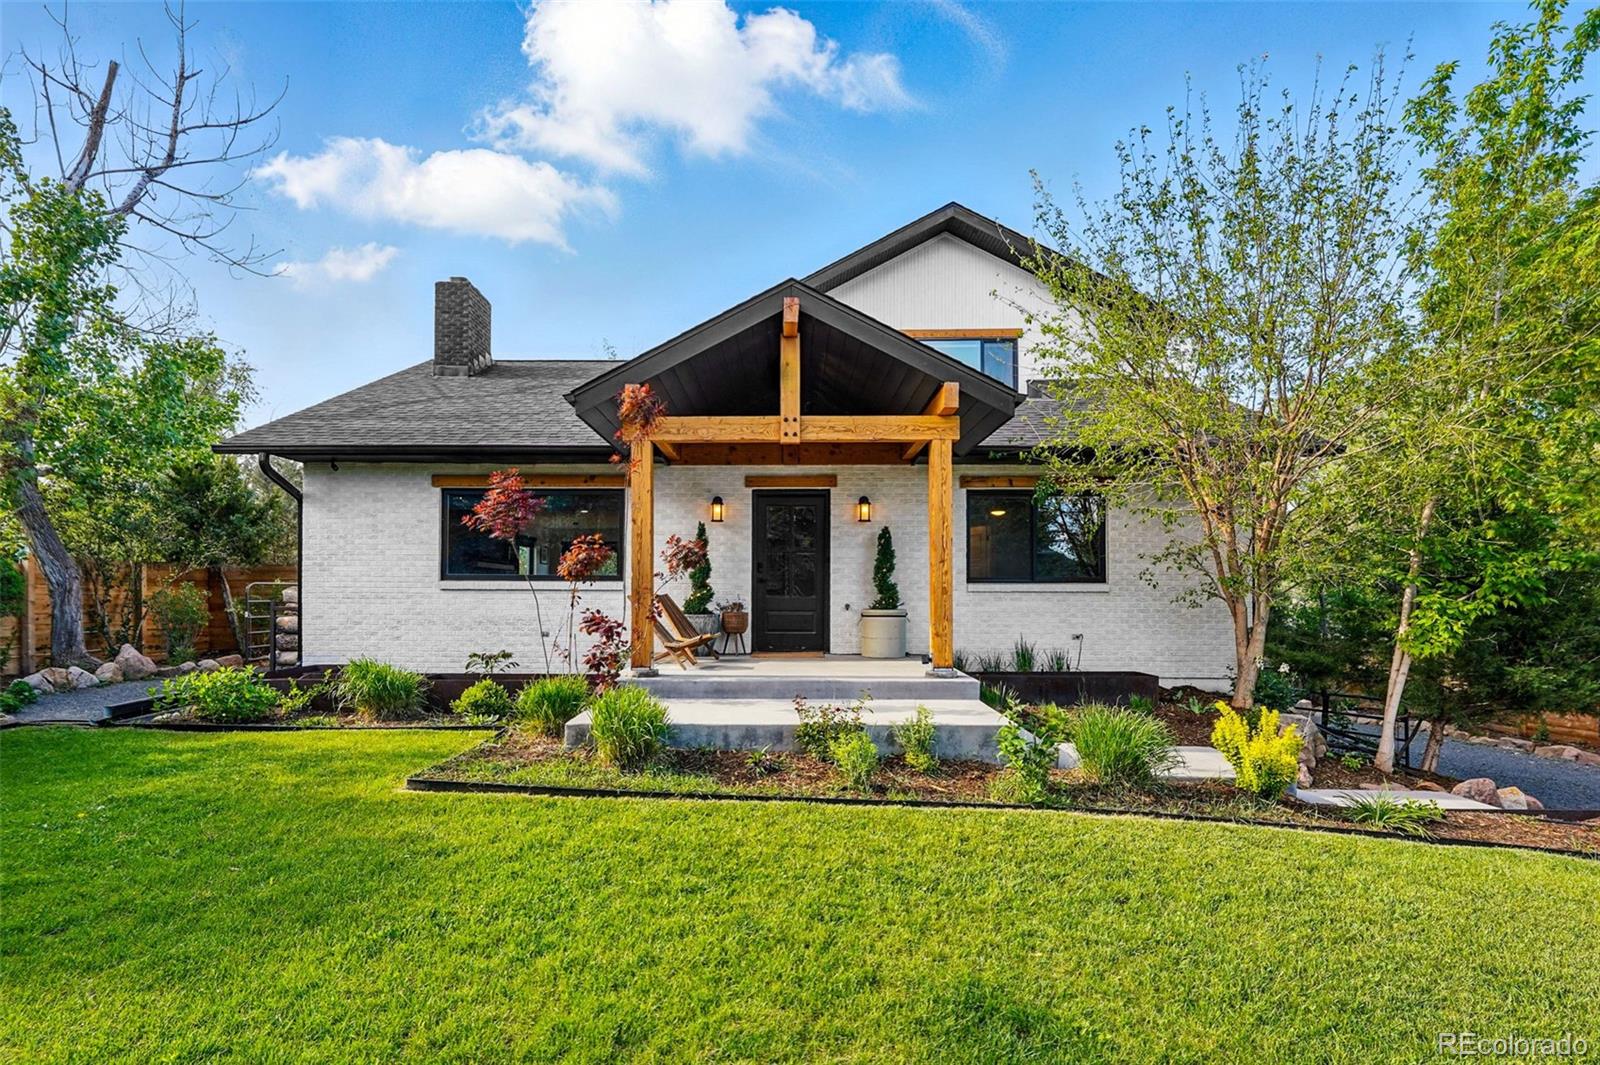
Active
$3,100,000
5
bds
|
4
ba
|
3,456
sqft
|
built
1978
1801 Redwood Ave, Boulder, CO 80304
$-12,502
Cash flow
-21.0%
Cash-on-Cash Return
0.8%
Cap rate
0.1%
Rent to Value Ratio
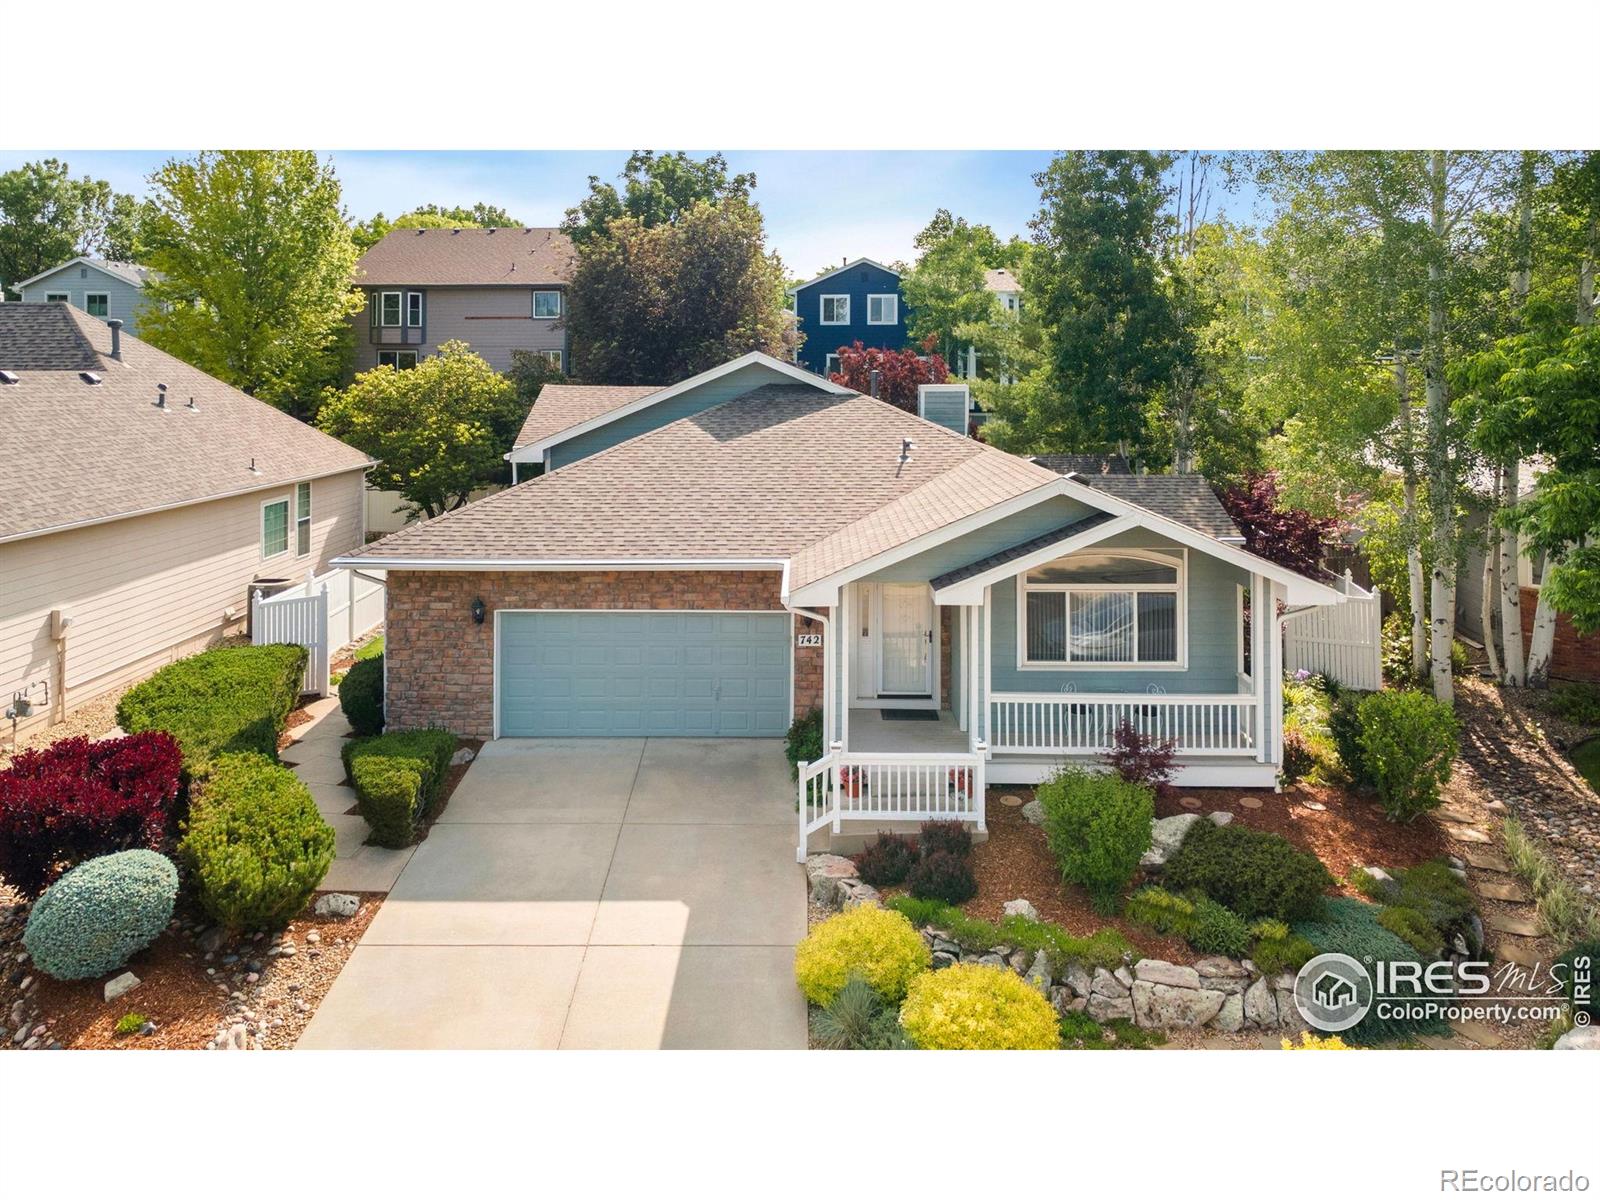
Active
$749,500
4
bds
|
5
ba
|
3,756
sqft
|
built
1997
742 Megan Ct, Longmont, CO 80504
$-1,930
Cash flow
-13.4%
Cash-on-Cash Return
2.6%
Cap rate
0.4%
Rent to Value Ratio
Active
$940,000
4
bds
|
4
ba
|
2,585
sqft
|
built
1993
360 Morning Star Ln, Lafayette, CO 80026
$-2,337
Cash flow
-13.0%
Cash-on-Cash Return
2.7%
Cap rate
0.4%
Rent to Value Ratio
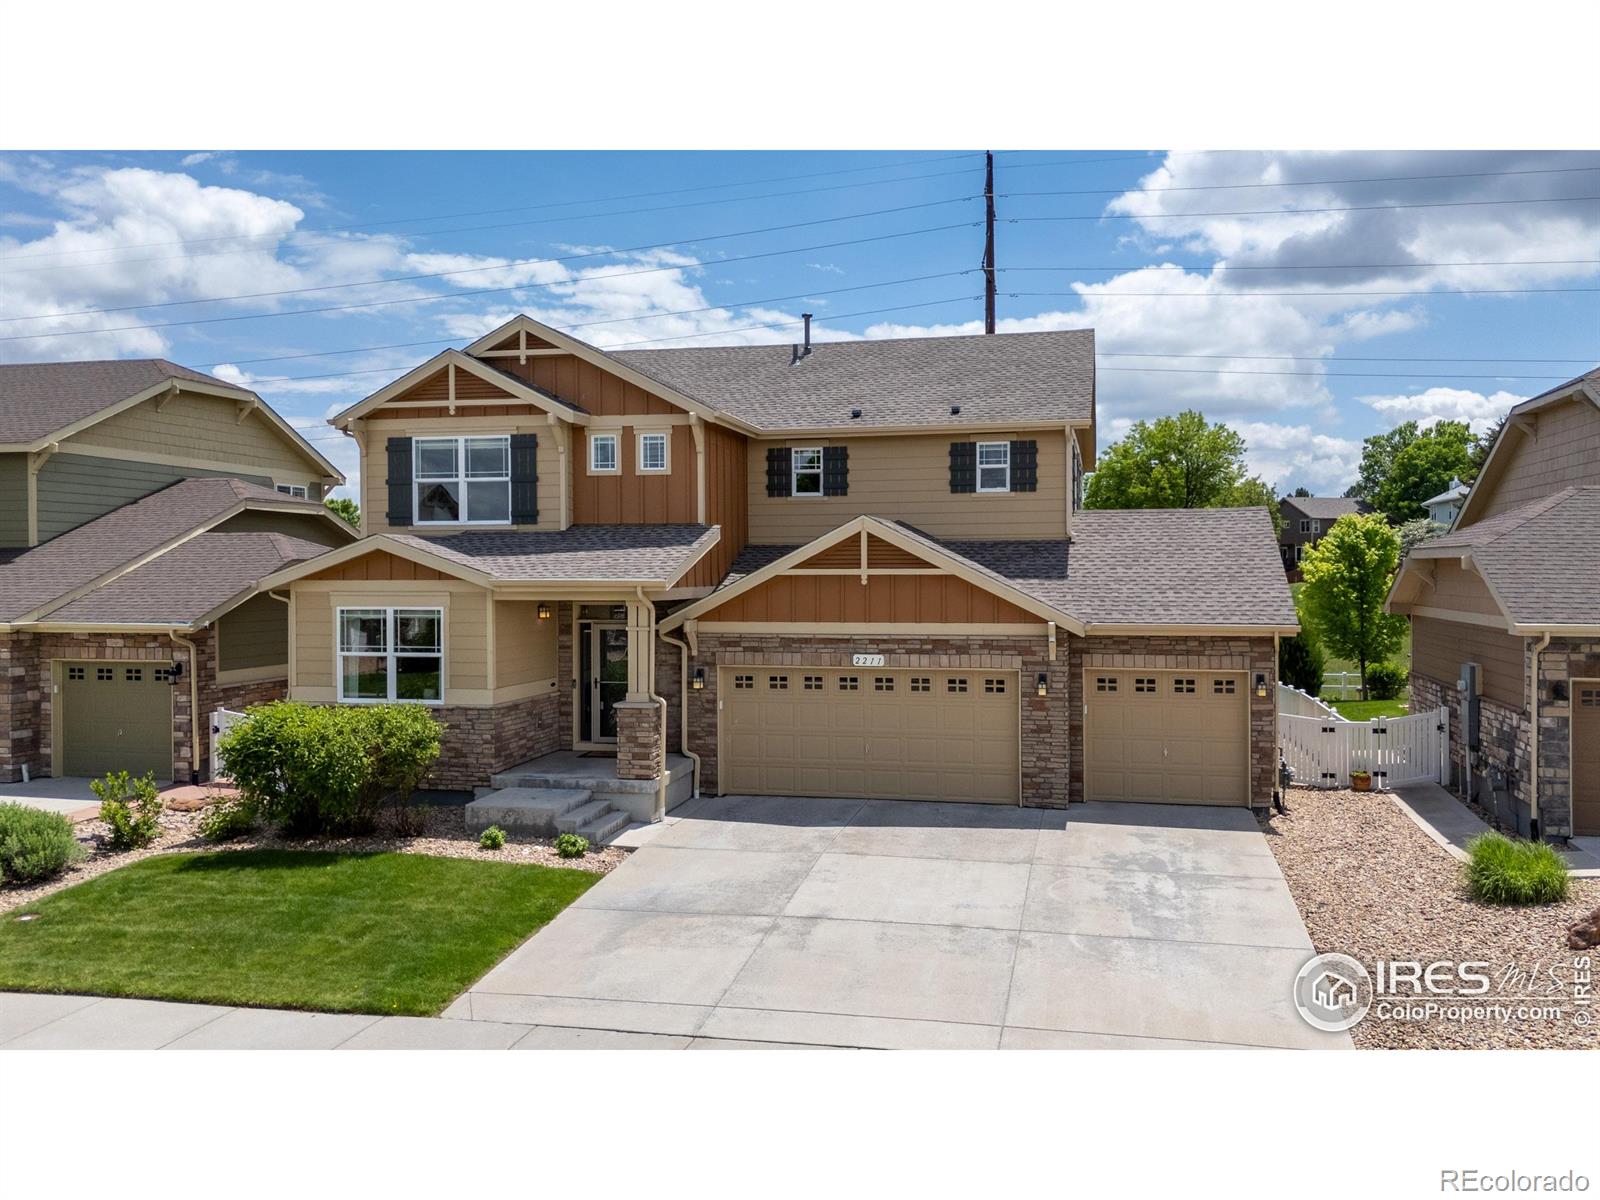
Active under contract
$739,000
5
bds
|
4
ba
|
3,628
sqft
|
built
2015
2211 Winding Dr, Longmont, CO 80504
$-1,494
Cash flow
-10.5%
Cash-on-Cash Return
3.3%
Cap rate
0.5%
Rent to Value Ratio
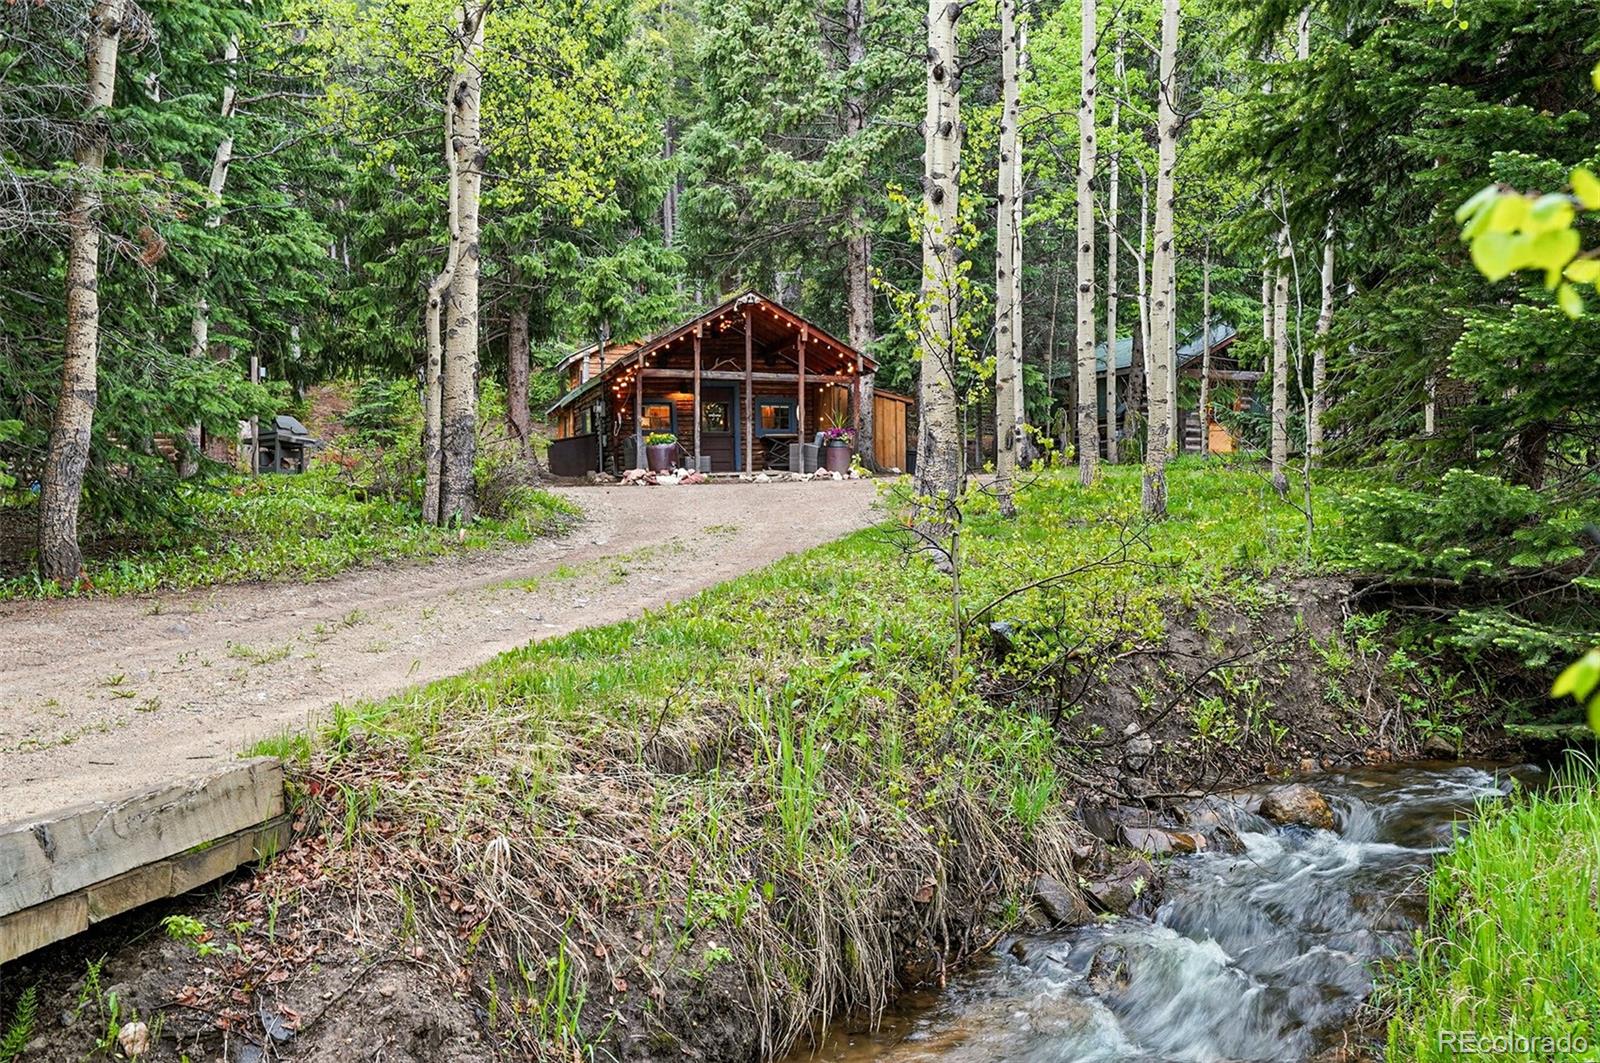
Active
$1,095,000
2
bds
|
3
ba
|
3,714
sqft
|
built
1988
625 N Beaver Rd, Nederland, CO 80466
$-1,762
Cash flow
-8.4%
Cash-on-Cash Return
3.7%
Cap rate
0.5%
Rent to Value Ratio
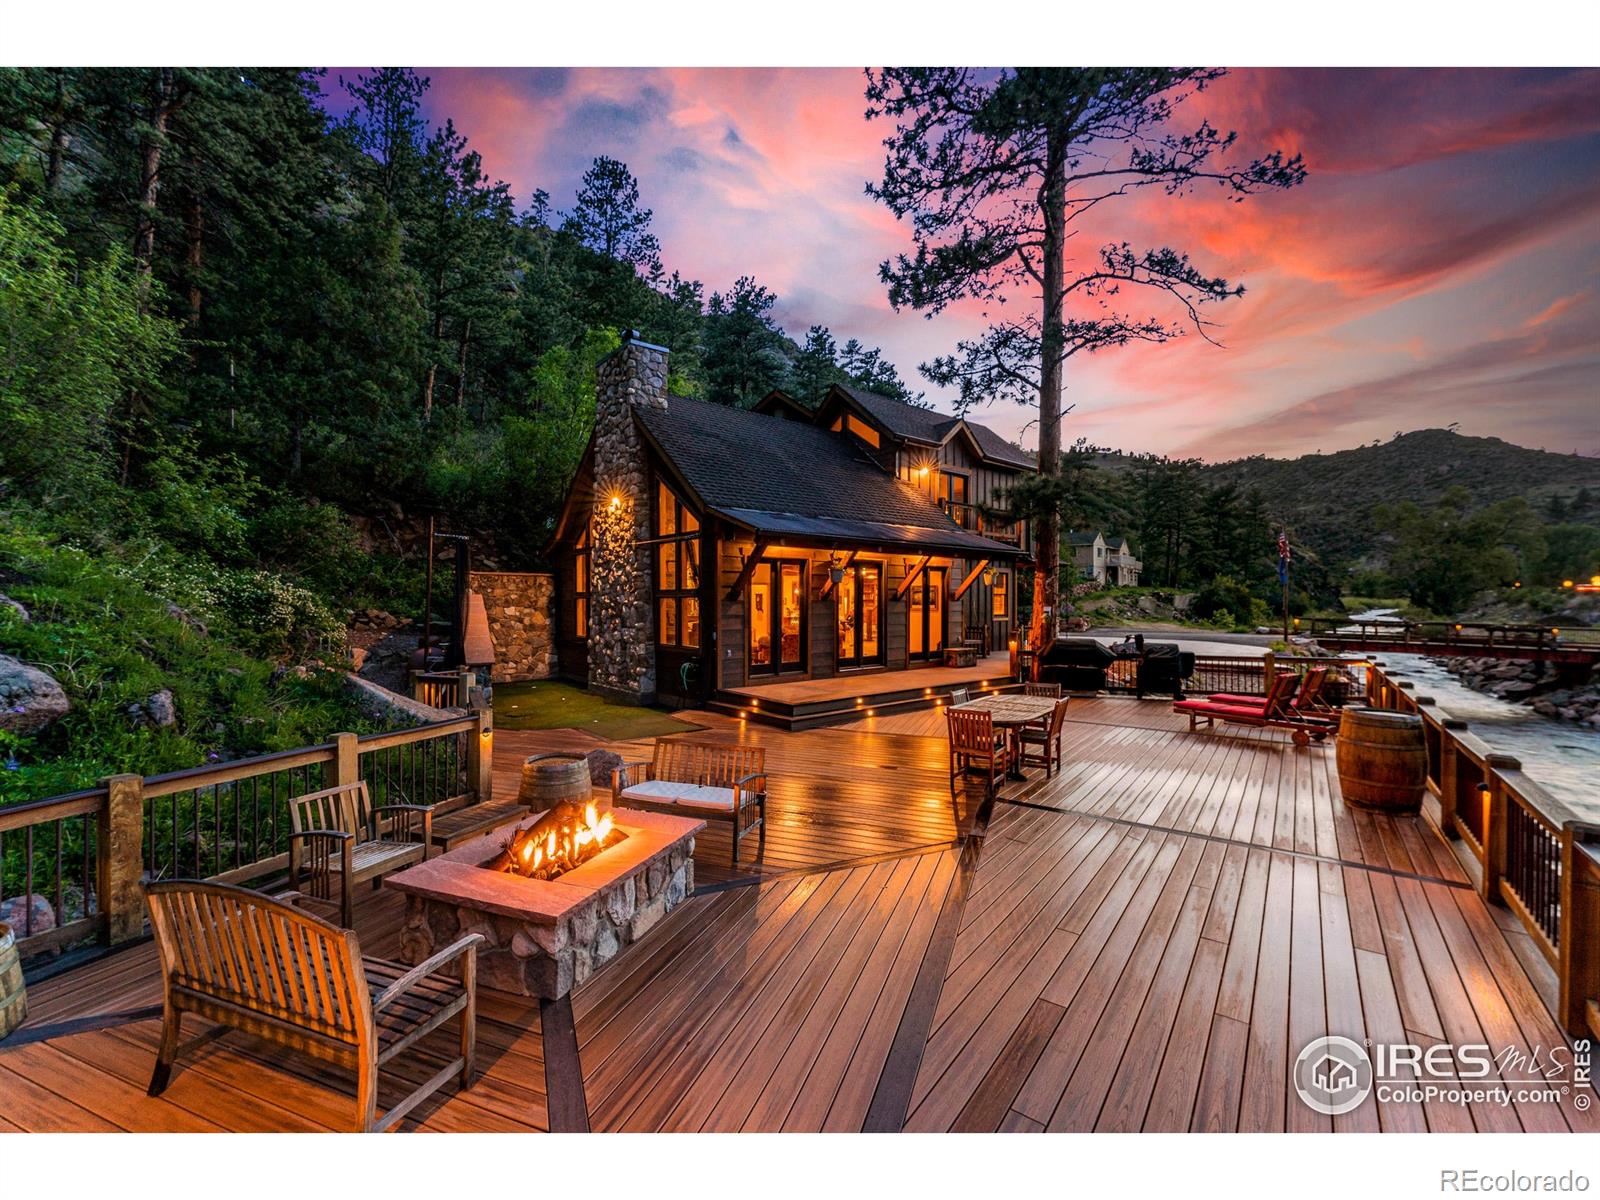
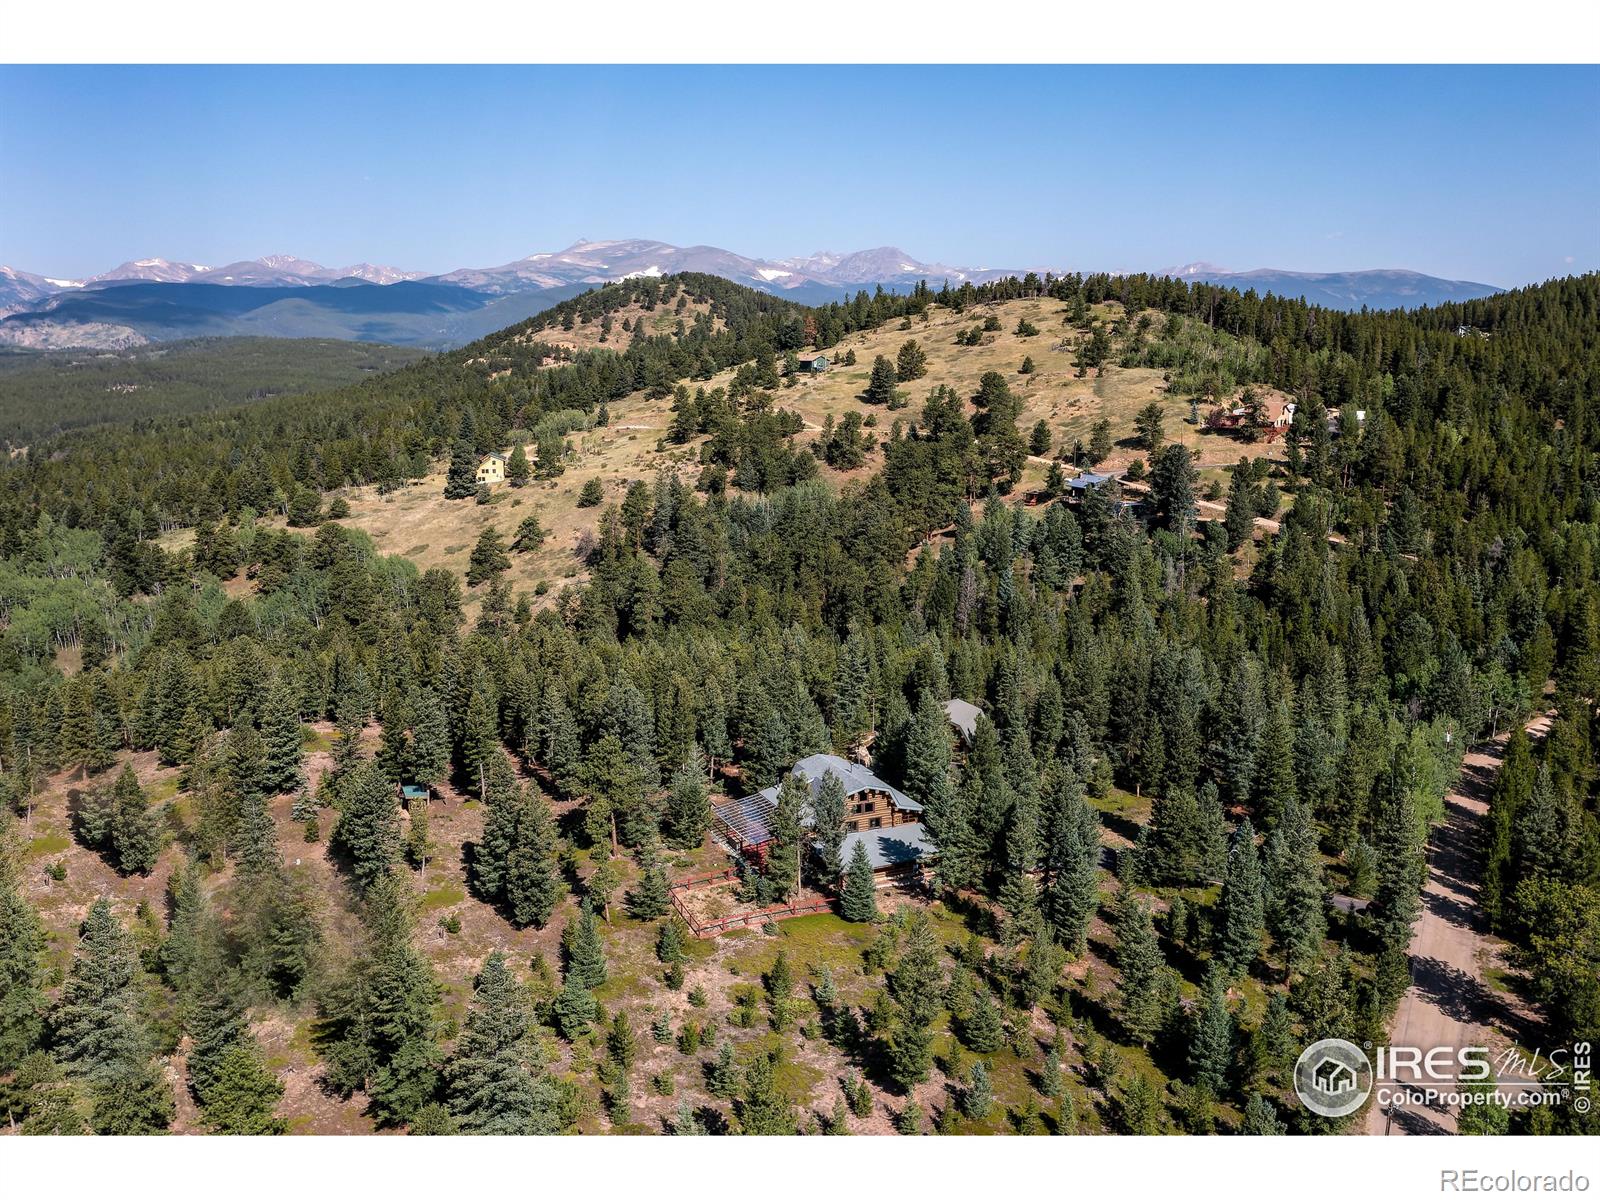
Active
$2,295,000
4
bds
|
5
ba
|
3,453
sqft
|
built
2006
16996 N Saint Vrain Dr, Lyons, CO 80540
$-7,186
Cash flow
-16.3%
Cash-on-Cash Return
1.9%
Cap rate
0.3%
Rent to Value Ratio
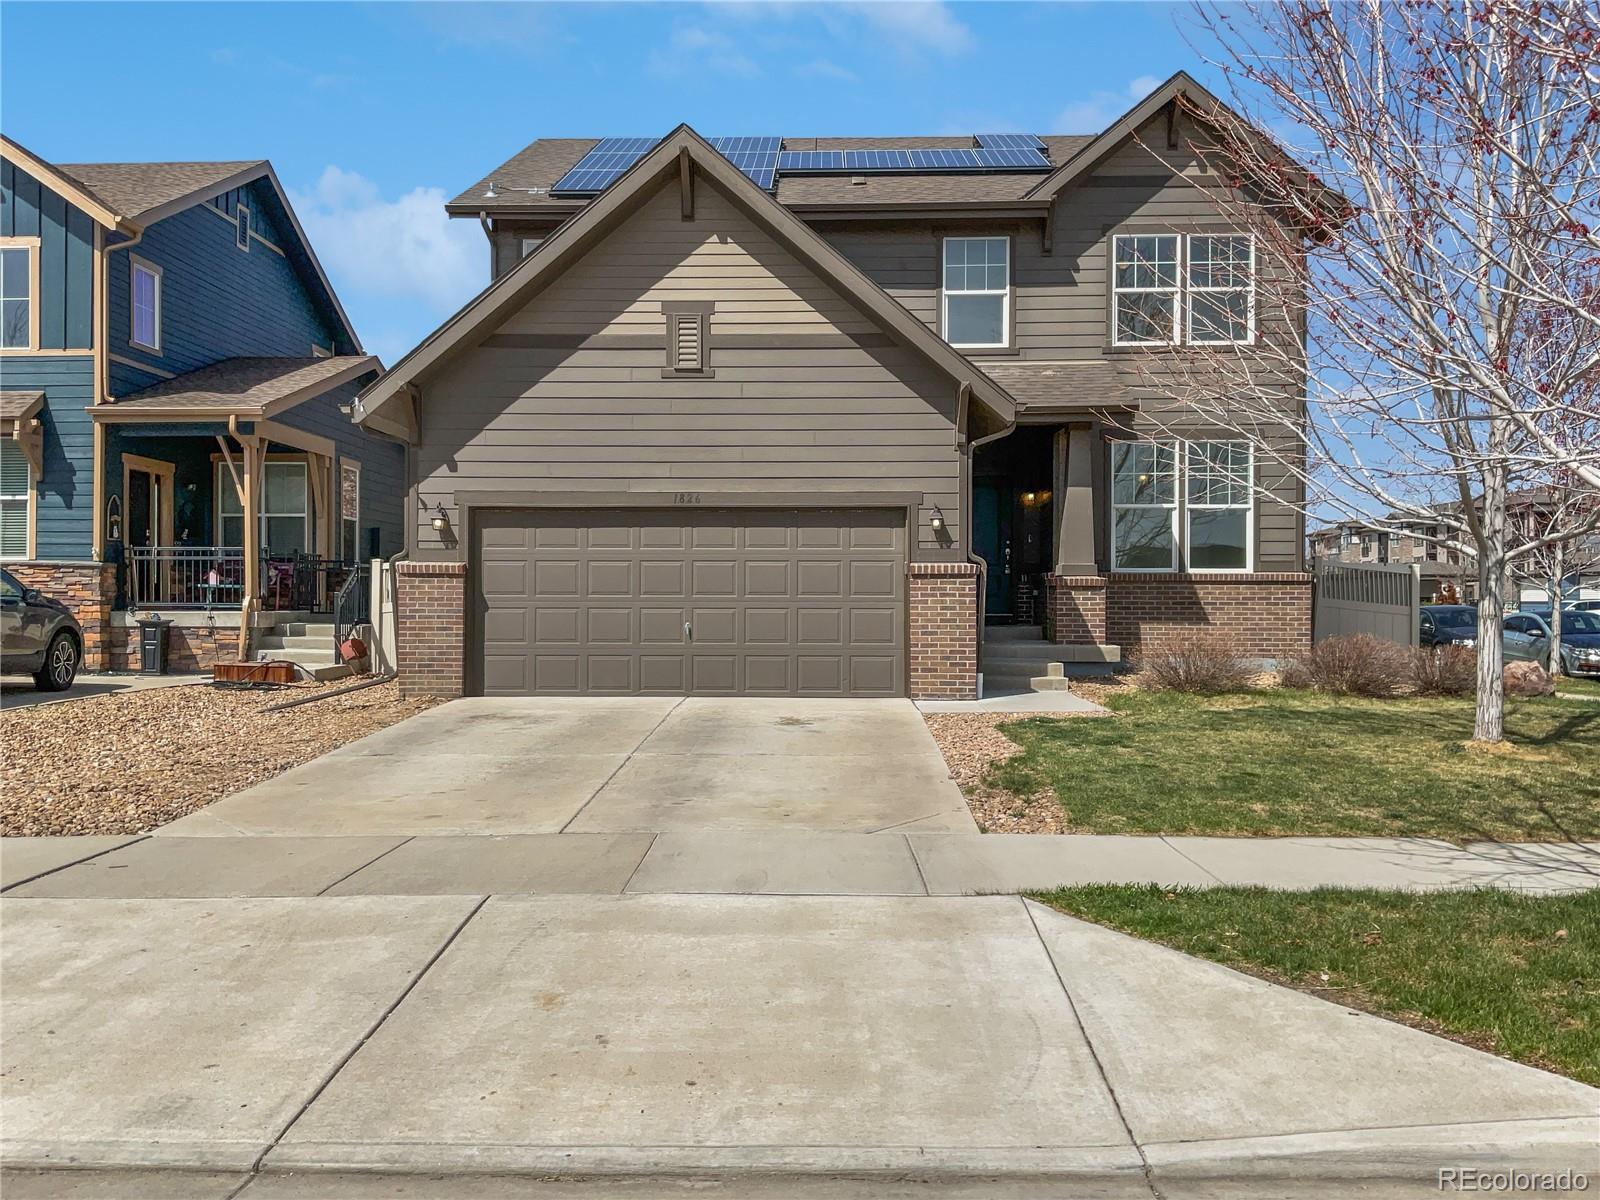
Active
$640,000
5
bds
|
3
ba
|
2,210
sqft
|
built
2016
1826 Sunshine Ave, Longmont, CO 80504
$-1,401
Cash flow
-11.4%
Cash-on-Cash Return
3.1%
Cap rate
0.5%
Rent to Value Ratio
Active
$430,000
2
bds
|
2
ba
|
1,188
sqft
|
built
1983
5950 Gunbarrel Ave, Boulder, CO 80301
$-1,093
Cash flow
-13.3%
Cash-on-Cash Return
2.6%
Cap rate
0.6%
Rent to Value Ratio
Active
$3,750,000
5
bds
|
5
ba
|
3,994
sqft
|
built
1995
7215 Hygiene Rd, Longmont, CO 80503
$-14,885
Cash flow
-20.7%
Cash-on-Cash Return
0.9%
Cap rate
0.1%
Rent to Value Ratio
Active
$395,000
2
bds
|
1
ba
|
737
sqft
|
built
1984
4887 White Rock Cir, Boulder, CO 80301
$-1,067
Cash flow
-14.1%
Cash-on-Cash Return
2.4%
Cap rate
0.6%
Rent to Value Ratio
Active
$479,000
2
bds
|
2
ba
|
1,133
sqft
|
built
2024
1304 Snowberry Ln, Louisville, CO 80027
$-1,005
Cash flow
-10.9%
Cash-on-Cash Return
3.2%
Cap rate
0.6%
Rent to Value Ratio
Active
$659,000
1
bds
|
2
ba
|
1,552
sqft
|
built
1975
1075 Eldorado Ave, Nederland, CO 80466
$-1,303
Cash flow
-10.3%
Cash-on-Cash Return
3.3%
Cap rate
0.5%
Rent to Value Ratio
Active under contract
$875,000
3
bds
|
3
ba
|
1,590
sqft
|
built
1986
79 Huron Ct, Boulder, CO 80303
$-2,589
Cash flow
-15.4%
Cash-on-Cash Return
2.1%
Cap rate
0.4%
Rent to Value Ratio
Pending
$649,900
5
bds
|
3
ba
|
2,544
sqft
|
built
2001
2205 Santa Fe Dr, Longmont, CO 80504
$-1,423
Cash flow
-11.4%
Cash-on-Cash Return
3.1%
Cap rate
0.4%
Rent to Value Ratio
Active
$1,375,000
3
bds
|
2
ba
|
1,874
sqft
|
built
1972
9445 Lykins Pl, Longmont, CO 80503
$-4,856
Cash flow
-18.4%
Cash-on-Cash Return
1.4%
Cap rate
0.3%
Rent to Value Ratio
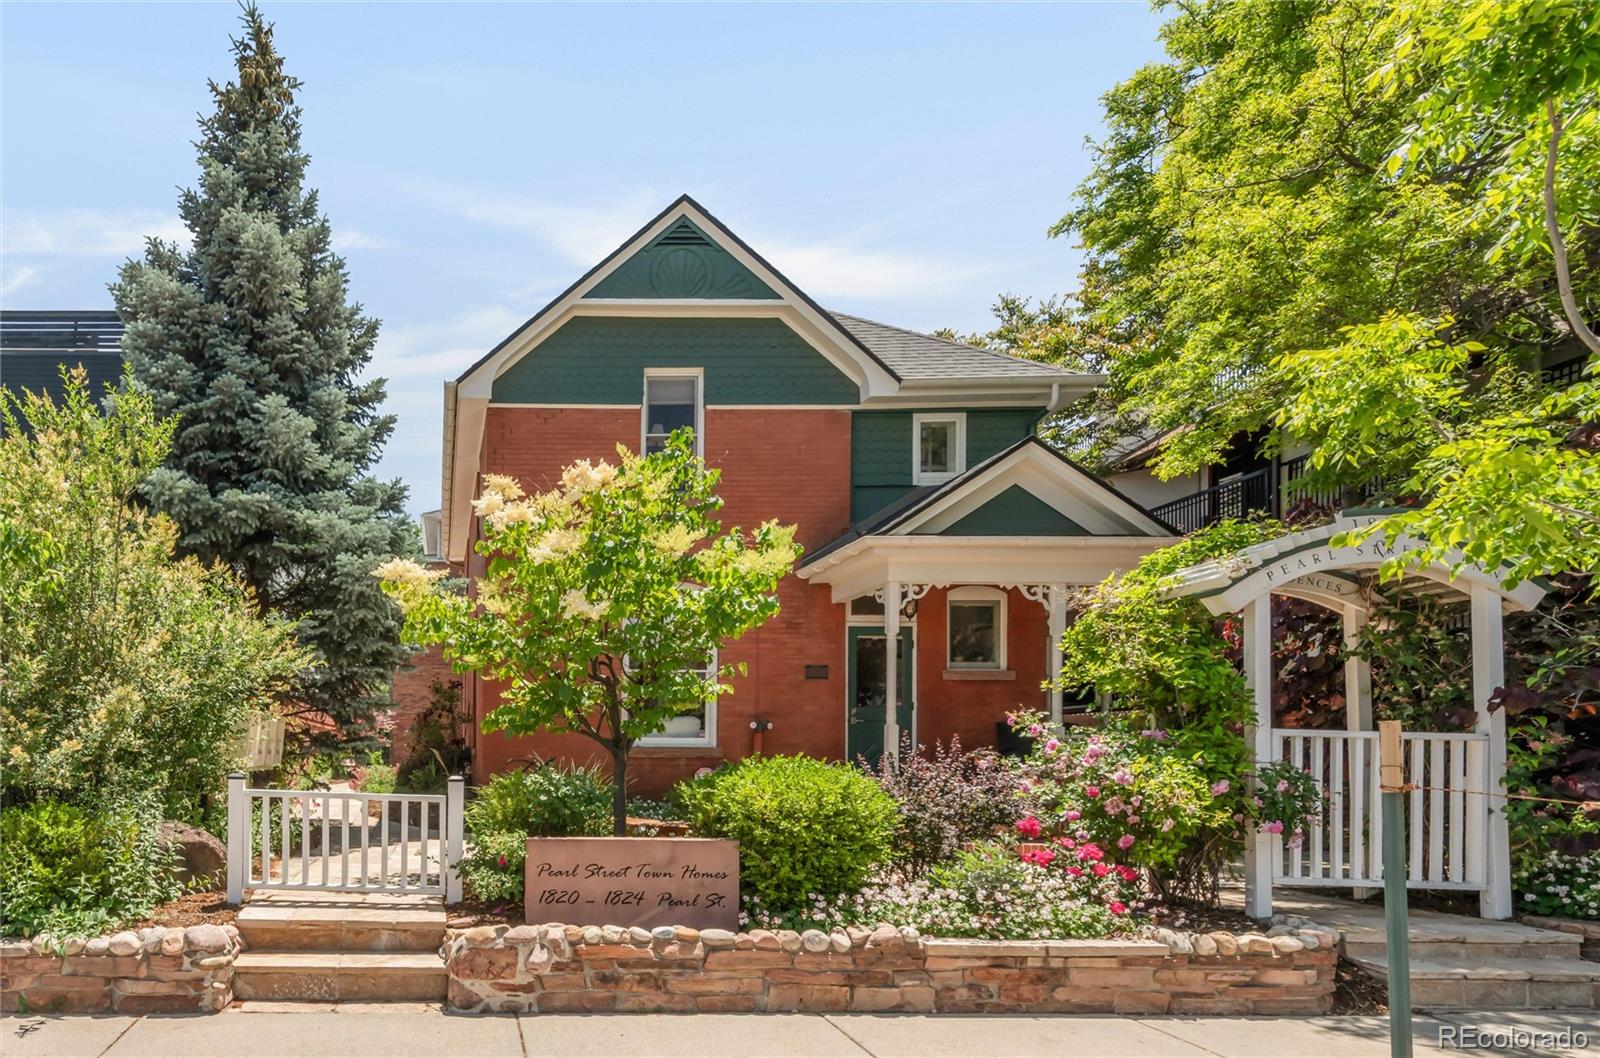
Active
$1,175,000
2
bds
|
3
ba
|
1,504
sqft
|
built
2009
1824 Pearl St, Boulder, CO 80302
$-3,388
Cash flow
-15.0%
Cash-on-Cash Return
2.2%
Cap rate
0.4%
Rent to Value Ratio
Active
$1,490,000
4
bds
|
3
ba
|
2,952
sqft
|
built
1987
4483 S Meadow Dr, Boulder, CO 80301
$-4,644
Cash flow
-16.3%
Cash-on-Cash Return
1.9%
Cap rate
0.3%
Rent to Value Ratio
Active
$600,000
5
bds
|
4
ba
|
2,467
sqft
|
built
1984
1460 Belmont Dr, Longmont, CO 80503
$-1,031
Cash flow
-9.0%
Cash-on-Cash Return
3.6%
Cap rate
0.5%
Rent to Value Ratio
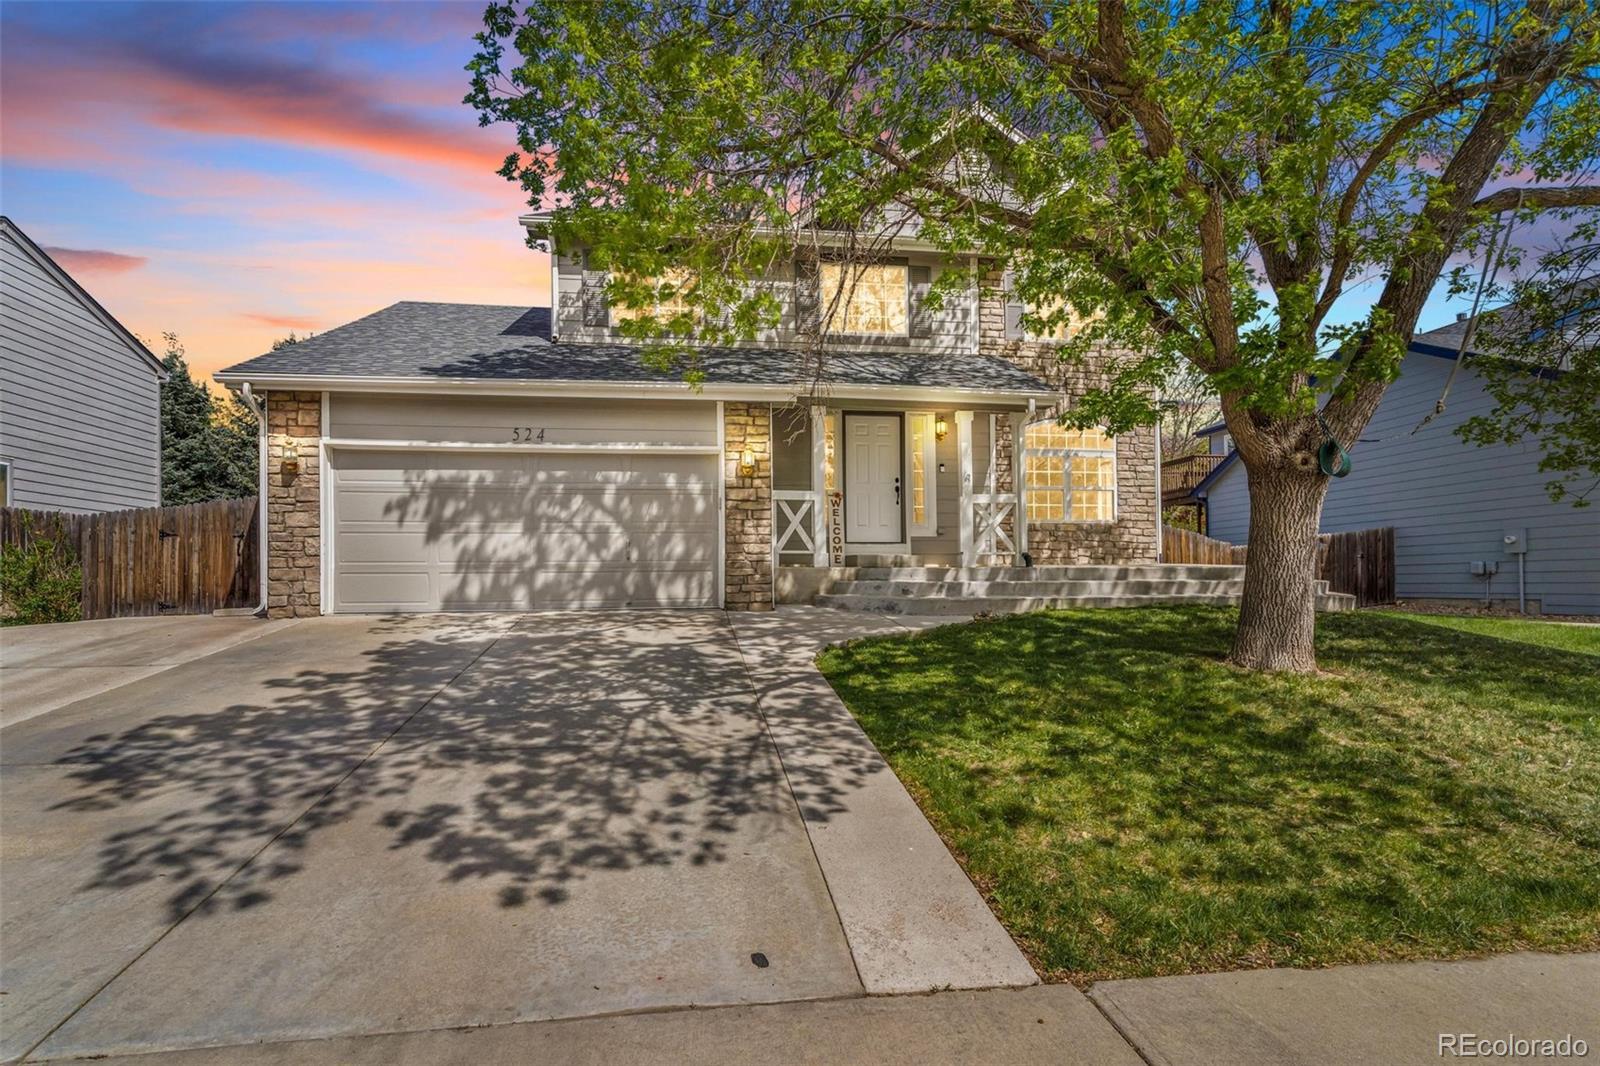
Active
$590,000
4
bds
|
4
ba
|
2,975
sqft
|
built
1994
524 Rider Ridge Dr, Longmont, CO 80504
$-983
Cash flow
-8.7%
Cash-on-Cash Return
3.7%
Cap rate
0.5%
Rent to Value Ratio
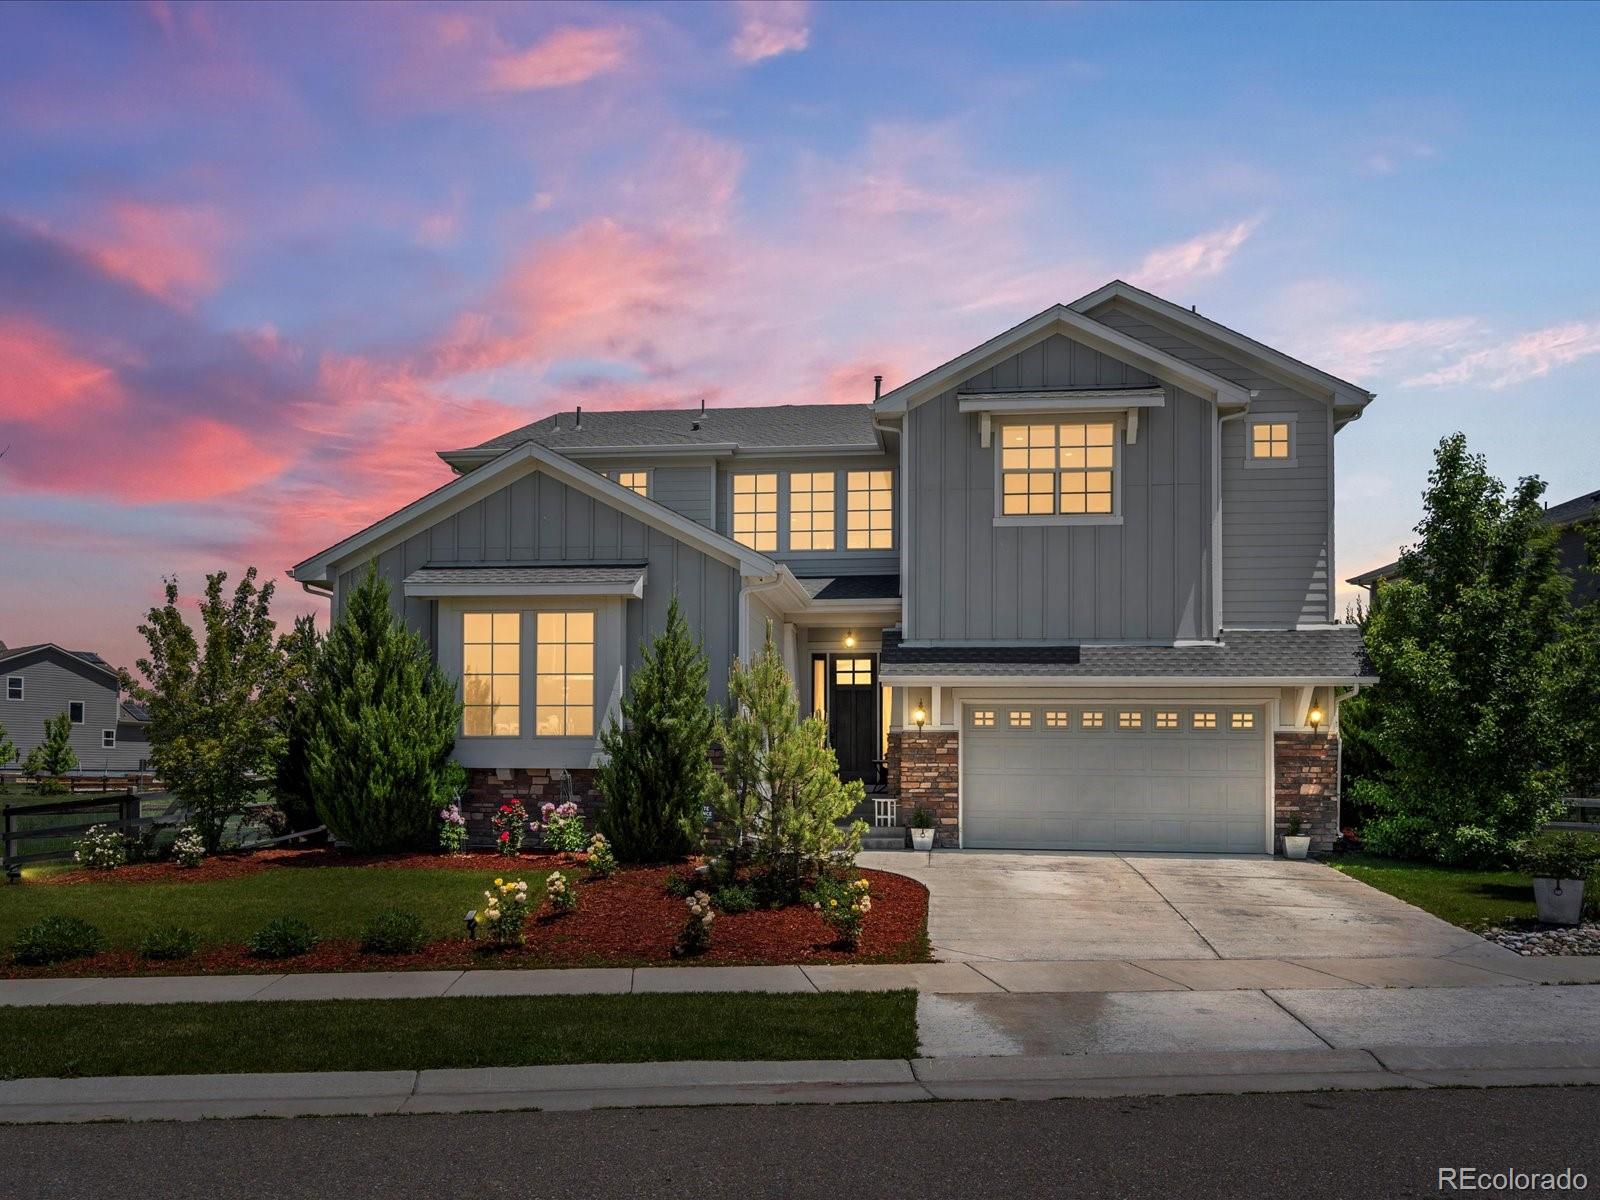
Active
$1,450,000
4
bds
|
4
ba
|
3,520
sqft
|
built
2018
1291 Fountain Ln, Erie, CO 80516
$-2,991
Cash flow
-10.8%
Cash-on-Cash Return
3.2%
Cap rate
0.5%
Rent to Value Ratio
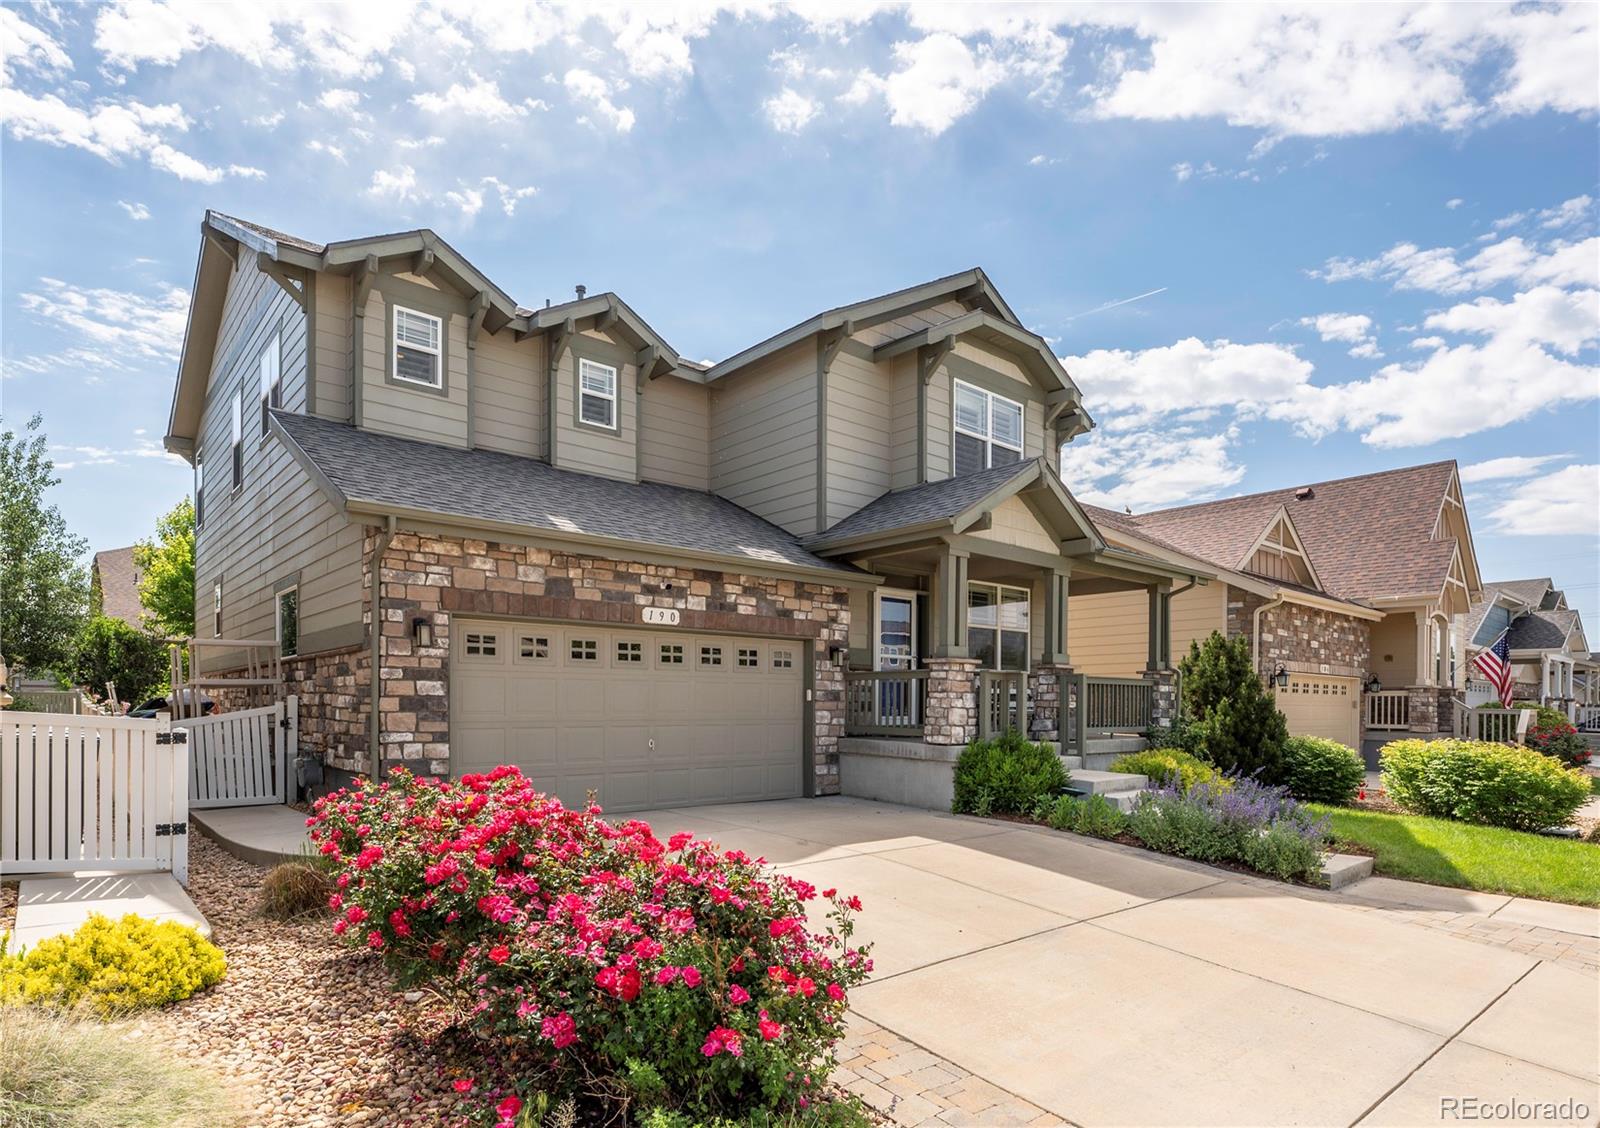
Active
$630,000
3
bds
|
3
ba
|
2,529
sqft
|
built
2015
190 Olympia Ave, Longmont, CO 80504
$-982
Cash flow
-8.1%
Cash-on-Cash Return
3.8%
Cap rate
0.6%
Rent to Value Ratio
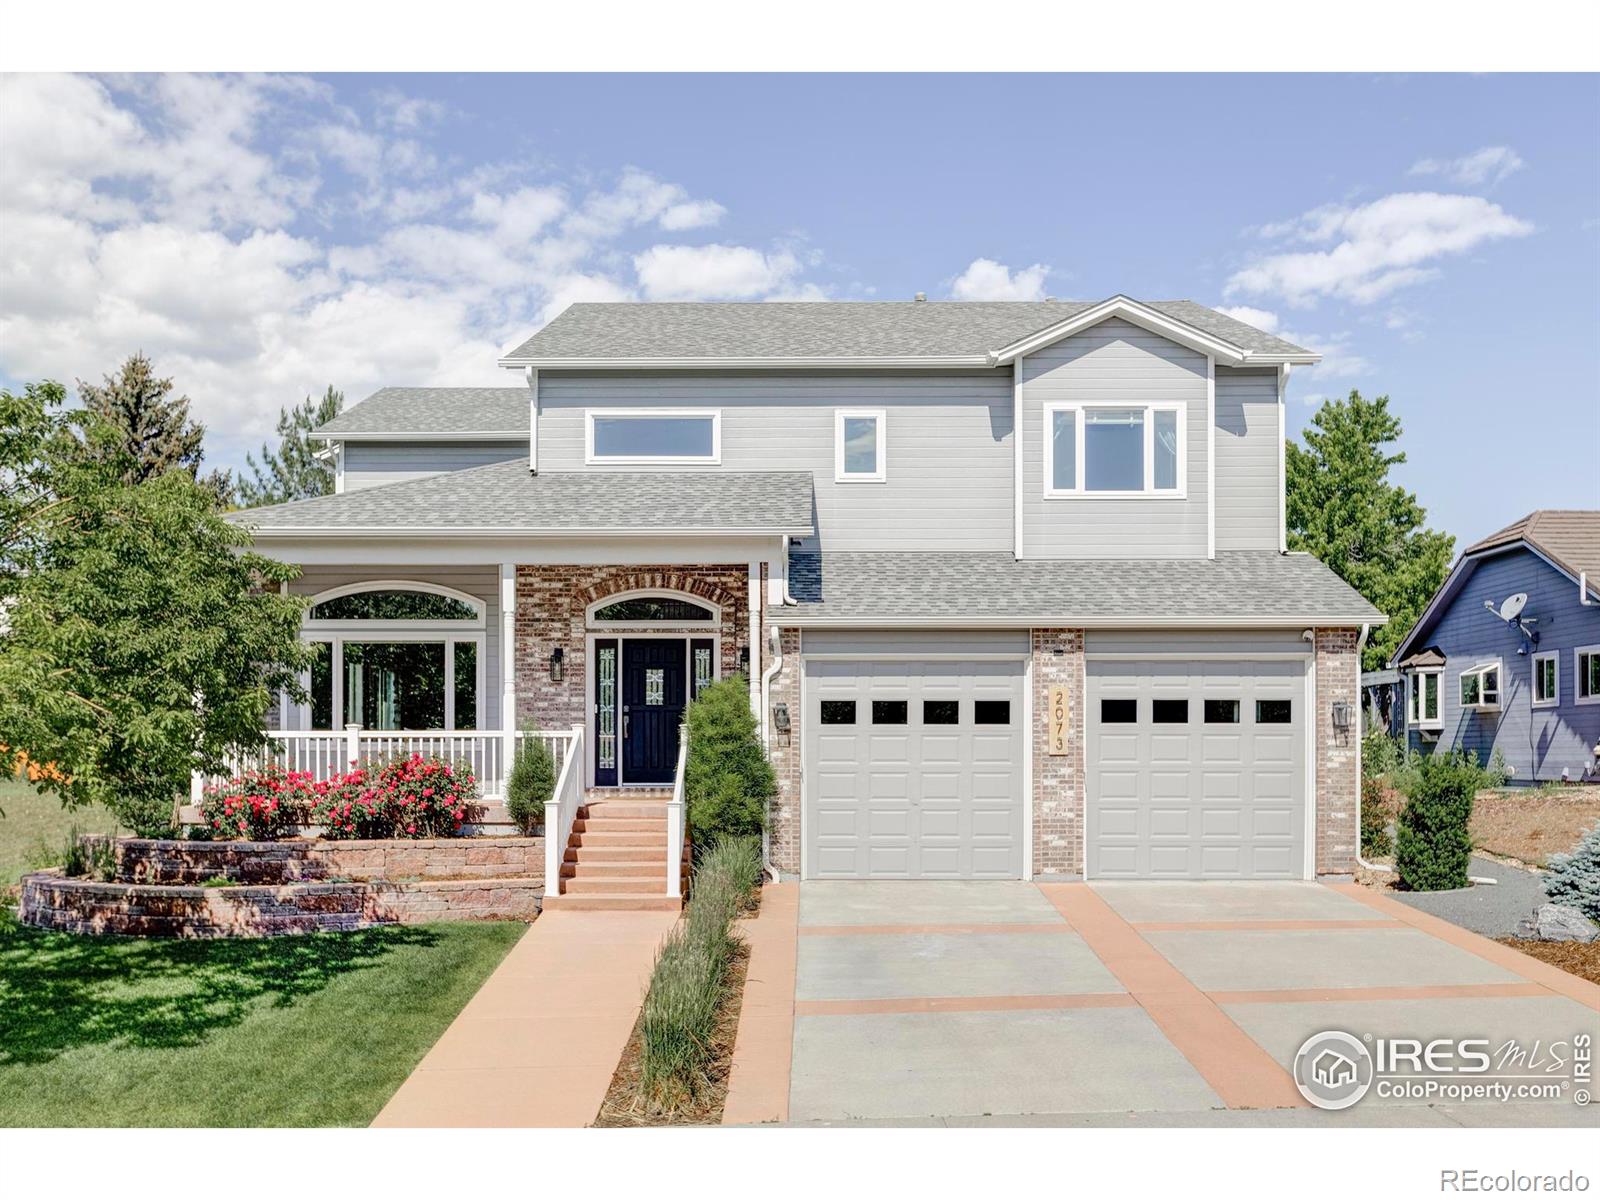
Active
$1,395,000
4
bds
|
5
ba
|
5,022
sqft
|
built
2004
2073 Eisenhower Dr, Louisville, CO 80027
$-3,820
Cash flow
-14.3%
Cash-on-Cash Return
2.4%
Cap rate
0.4%
Rent to Value Ratio
Active
$669,500
4
bds
|
3
ba
|
2,094
sqft
|
built
1999
1616 Cedarwood Dr, Longmont, CO 80504
$-1,476
Cash flow
-11.5%
Cash-on-Cash Return
3.0%
Cap rate
0.4%
Rent to Value Ratio
Active
$795,000
2
bds
|
2
ba
|
1,435
sqft
|
built
1949
1634 Caribou Rd, Nederland, CO 80466
$-1,801
Cash flow
-11.8%
Cash-on-Cash Return
3.0%
Cap rate
0.4%
Rent to Value Ratio
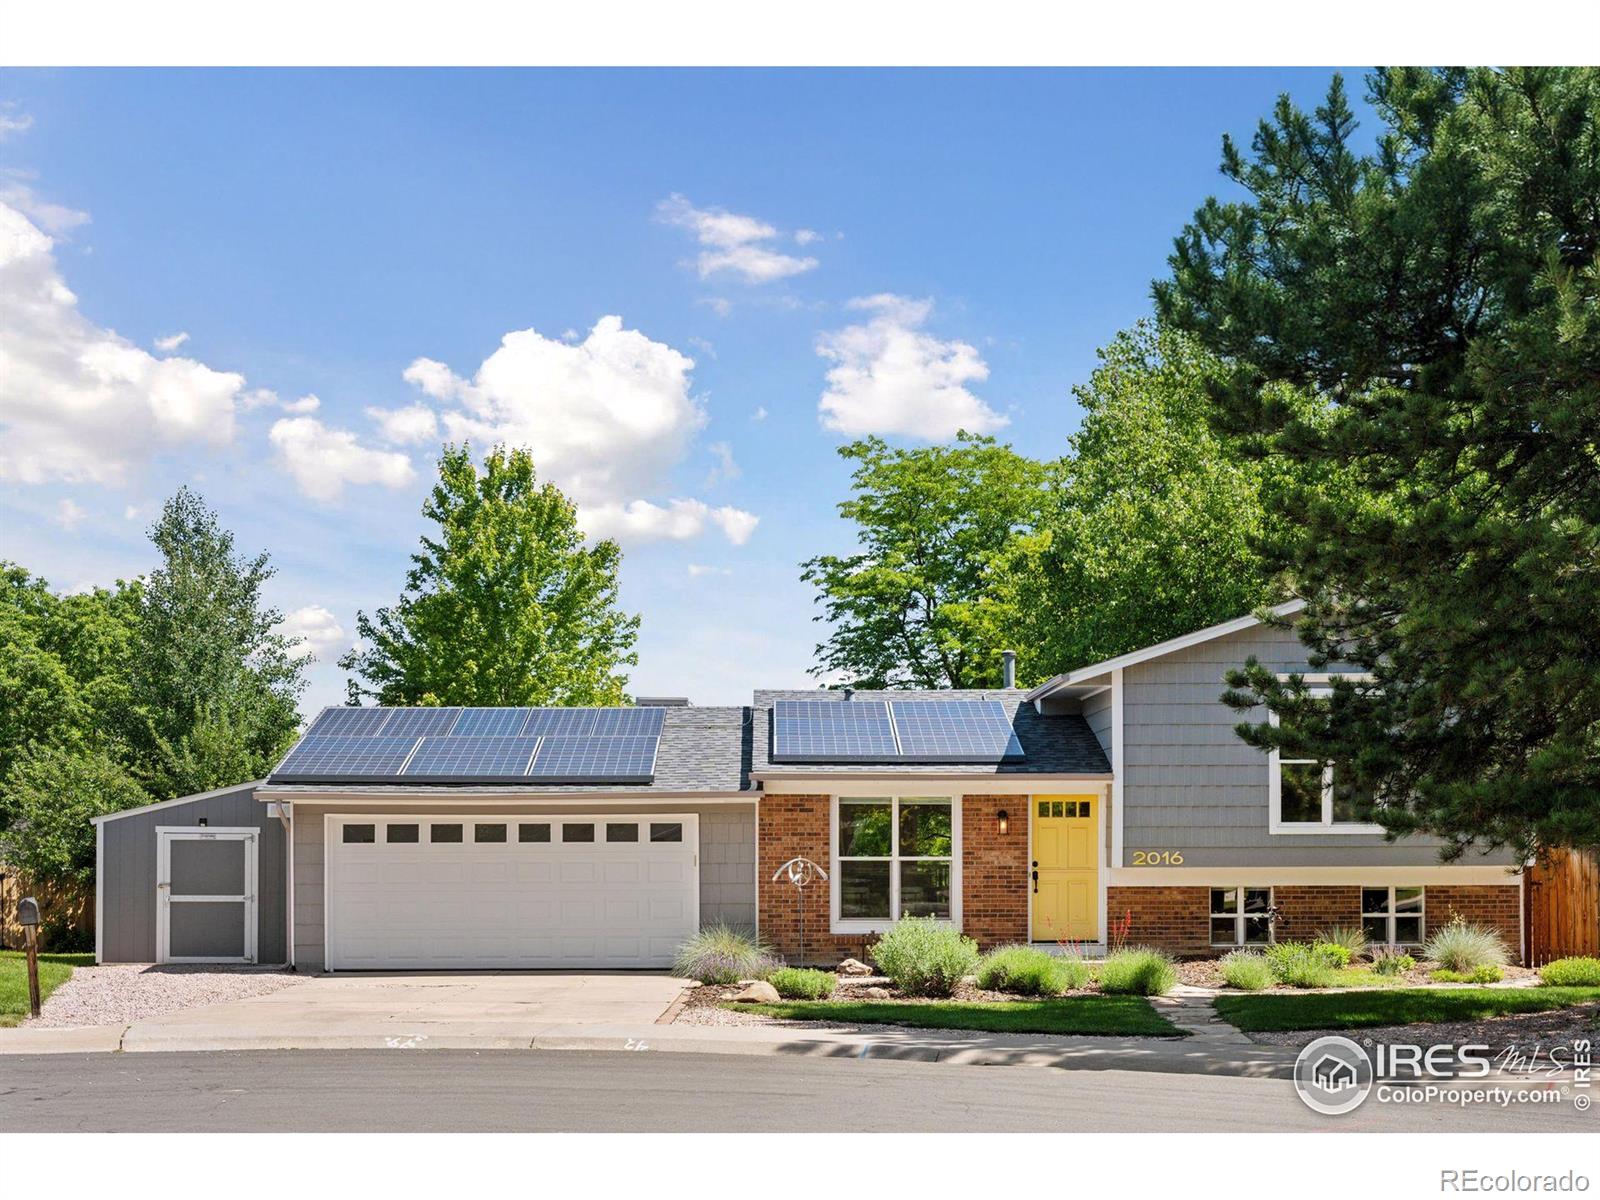
Active under contract
$779,000
3
bds
|
2
ba
|
1,478
sqft
|
built
1975
2016 Strathmore St, Louisville, CO 80027
$-1,877
Cash flow
-12.6%
Cash-on-Cash Return
2.8%
Cap rate
0.4%
Rent to Value Ratio