Boulder County Investment Properties for Sale
Browse homes for sale and investment properties in Boulder County. Refine your search by price, property type, or more.
Best cash flowing properties in Boulder County
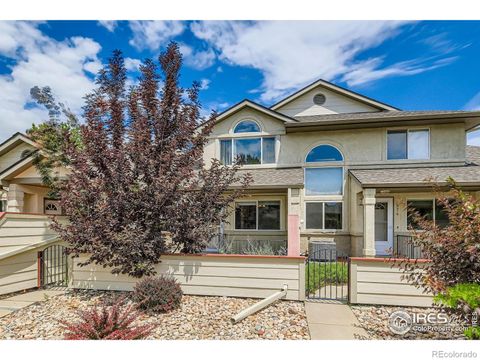
Active
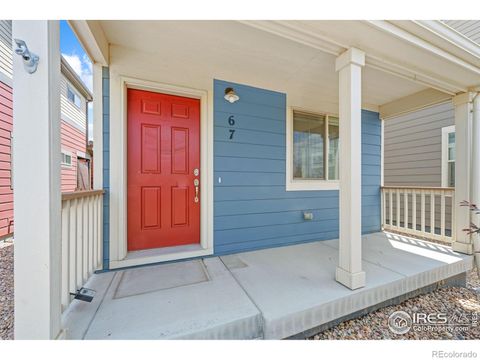
$255,000
2
bds
|
2
ba
|
896
sqft
|
built
2019
67 Quail Rd, Longmont, CO 80501
$-206
Cash flow
-4.2%
Cash-on-Cash Return
4.7%
Cap rate
0.8%
Rent to Value Ratio
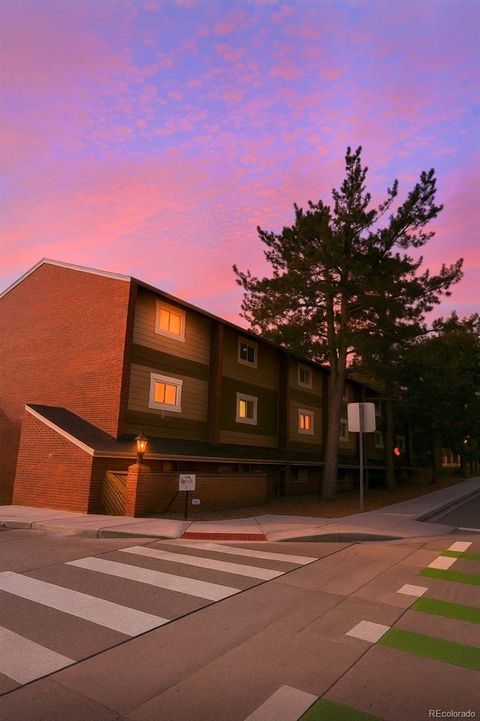
Active
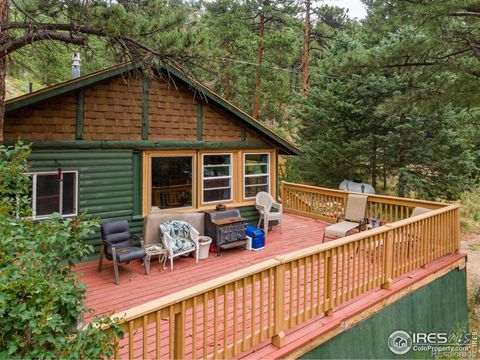
$399,000
1
bds
|
1
ba
|
845
sqft
|
built
1920
2248 Riverside Dr, Lyons, CO 80540
$-468
Cash flow
-6.1%
Cash-on-Cash Return
4.3%
Cap rate
0.6%
Rent to Value Ratio
896 out of 982 properties for sale in Boulder County
Limited Results Shown
Create a free account, or log in to reveal all property listings and enjoy the complete experience.
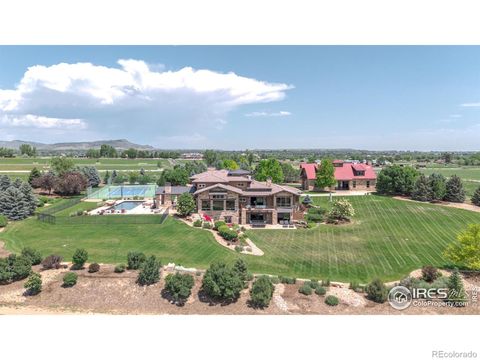
Active
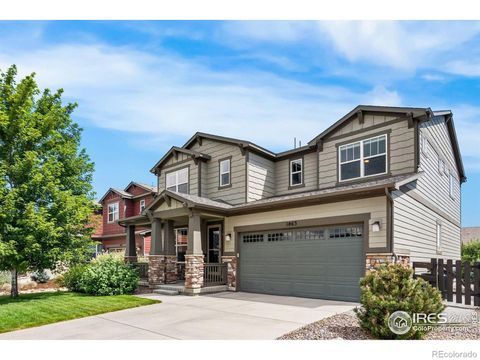
$998,000
3
bds
|
3
ba
|
3,515
sqft
|
built
2017
1863 Pioneer Cir, Lafayette, CO 80026
$-2,725
Cash flow
-14.2%
Cash-on-Cash Return
2.4%
Cap rate
0.4%
Rent to Value Ratio
Active
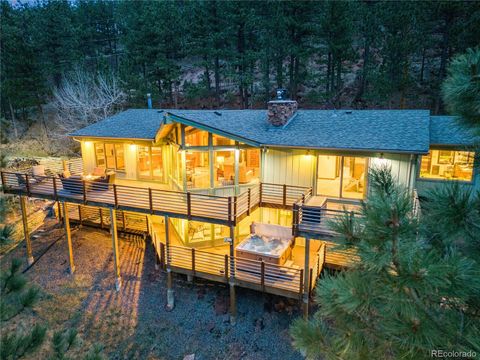
$1,900,000
3
bds
|
3
ba
|
3,328
sqft
|
built
1975
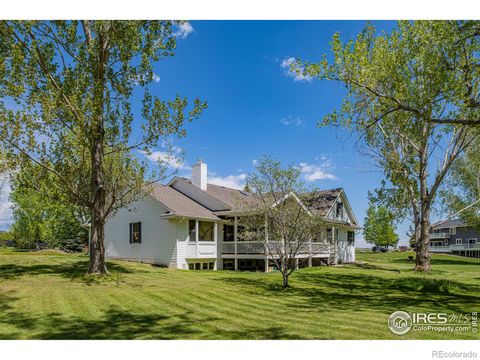
994 Timber Ln, Boulder, CO 80304
$-6,521
Cash flow
-17.9%
Cash-on-Cash Return
1.6%
Cap rate
0.2%
Rent to Value Ratio
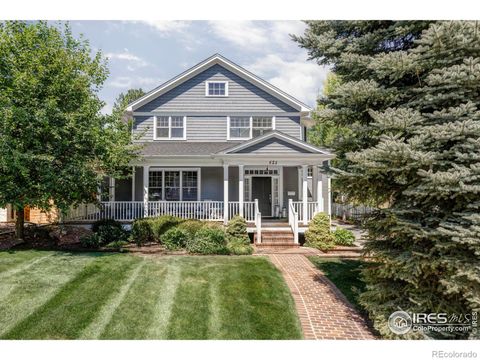
Active
$5,295,000
5
bds
|
5
ba
|
7,177
sqft
|
built
2008
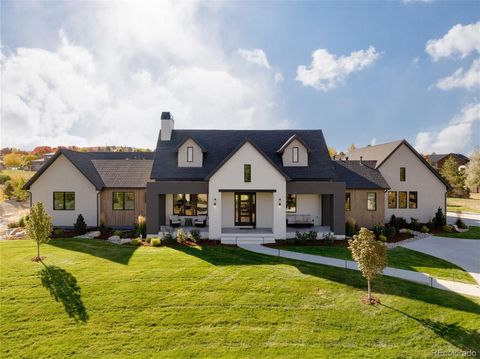
521 Hawthorn Ave, Boulder, CO 80304
$-22,828
Cash flow
-22.5%
Cash-on-Cash Return
0.5%
Cap rate
0.1%
Rent to Value Ratio
Active
$639,500
4
bds
|
4
ba
|
1,725
sqft
|
built
1993
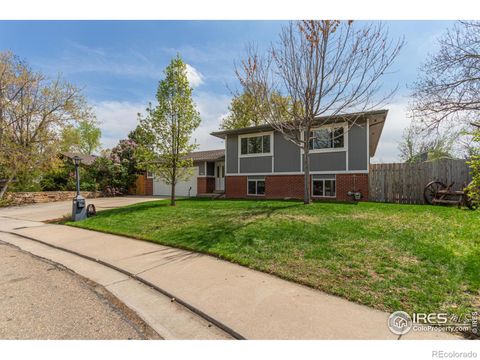
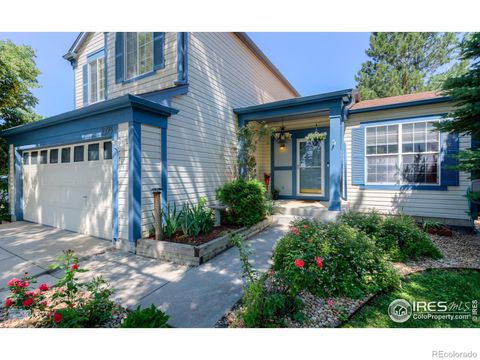
2421 Maplewood Cir W, Longmont, CO 80503
$-1,285
Cash flow
-10.5%
Cash-on-Cash Return
3.3%
Cap rate
0.5%
Rent to Value Ratio
Active
$1,050,000
4
bds
|
2
ba
|
2,330
sqft
|
built
1974
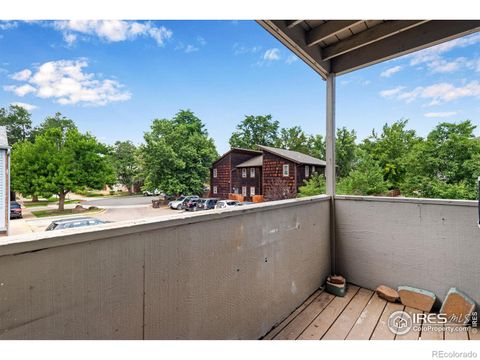
590 Yuma Cir, Boulder, CO 80303
$-3,020
Cash flow
-15.0%
Cash-on-Cash Return
2.2%
Cap rate
0.3%
Rent to Value Ratio
Active
$690,000
3
bds
|
1
ba
|
902
sqft
|
built
1952
325 27th St, Boulder, CO 80305
$-1,668
Cash flow
-12.6%
Cash-on-Cash Return
2.8%
Cap rate
0.4%
Rent to Value Ratio
Active
$595,000
4
bds
|
3
ba
|
2,616
sqft
|
built
1976
1313 Garden Cir, Longmont, CO 80501
$-1,280
Cash flow
-11.2%
Cash-on-Cash Return
3.1%
Cap rate
0.4%
Rent to Value Ratio
Active
$3,850,000
5
bds
|
6
ba
|
4,383
sqft
|
built
2015
350 15th St, Boulder, CO 80302
$-13,666
Cash flow
-18.5%
Cash-on-Cash Return
1.4%
Cap rate
0.2%
Rent to Value Ratio
Active
$1,039,000
4
bds
|
4
ba
|
2,758
sqft
|
built
1994
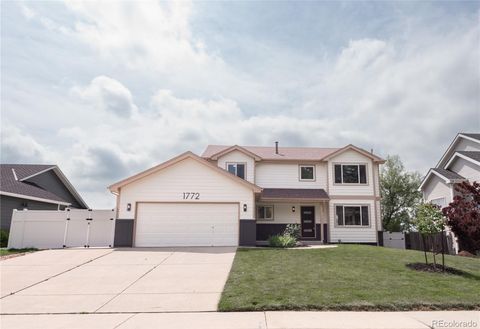
1772 Eisenhower Dr, Louisville, CO 80027
$-2,618
Cash flow
-13.1%
Cash-on-Cash Return
2.7%
Cap rate
0.4%
Rent to Value Ratio
Active
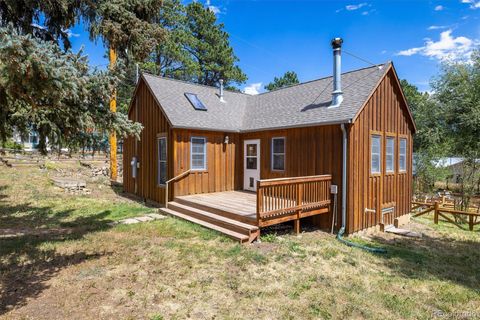
$735,000
3
bds
|
2
ba
|
2,490
sqft
|
built
1999
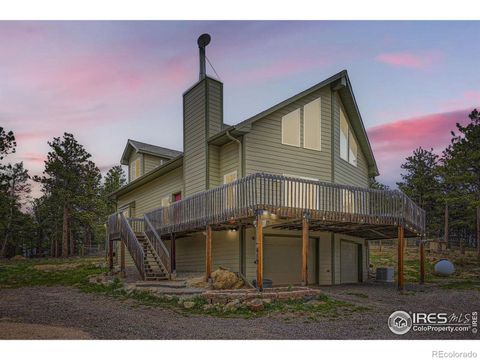
613 Ranch Rd, Ward, CO 80481
$-1,663
Cash flow
-11.8%
Cash-on-Cash Return
3.0%
Cap rate
0.4%
Rent to Value Ratio
Active
$1,695,000
3
bds
|
4
ba
|
3,451
sqft
|
built
1996
5986 Heather Way, Niwot, CO 80503
$-4,917
Cash flow
-15.1%
Cash-on-Cash Return
2.2%
Cap rate
0.3%
Rent to Value Ratio
Active
$5,699,000
5
bds
|
6
ba
|
7,168
sqft
|
built
2022
6816 Goldbranch Dr, Niwot, CO 80503
$-22,254
Cash flow
-20.4%
Cash-on-Cash Return
1.0%
Cap rate
0.2%
Rent to Value Ratio
Active
$669,000
3
bds
|
3
ba
|
2,094
sqft
|
built
1996
3598 Larkspur Dr, Longmont, CO 80503
$-1,409
Cash flow
-11.0%
Cash-on-Cash Return
3.2%
Cap rate
0.5%
Rent to Value Ratio
Active
$314,000
2
bds
|
1
ba
|
756
sqft
|
built
1983
3535 28th St, Boulder, CO 80301
$-636
Cash flow
-10.6%
Cash-on-Cash Return
3.2%
Cap rate
0.6%
Rent to Value Ratio
Active
$500,000
3
bds
|
3
ba
|
1,550
sqft
|
built
1996
572 Ridgeview Dr, Louisville, CO 80027
$-1,144
Cash flow
-11.9%
Cash-on-Cash Return
2.9%
Cap rate
0.5%
Rent to Value Ratio
Active
$494,999
2
bds
|
2
ba
|
1,102
sqft
|
built
1969
3009 Madison Ave, Boulder, CO 80303
$-1,353
Cash flow
-14.3%
Cash-on-Cash Return
2.4%
Cap rate
0.5%
Rent to Value Ratio
Active
$550,000
2
bds
|
1
ba
|
724
sqft
|
built
1999
855 Main St, Boulder, CO 80302
$-1,108
Cash flow
-10.5%
Cash-on-Cash Return
3.3%
Cap rate
0.5%
Rent to Value Ratio
Active
$25,000,000
6
bds
|
8
ba
|
10,801
sqft
|
built
2006
6880 Saint Vrain Rd, Longmont, CO 80503
$-115,957
Cash flow
-24.2%
Cash-on-Cash Return
0.1%
Cap rate
0.0%
Rent to Value Ratio
Active
$739,000
5
bds
|
5
ba
|
4,369
sqft
|
built
2003
502 Peregrine Cir, Longmont, CO 80504
$-1,743
Cash flow
-12.3%
Cash-on-Cash Return
2.8%
Cap rate
0.4%
Rent to Value Ratio
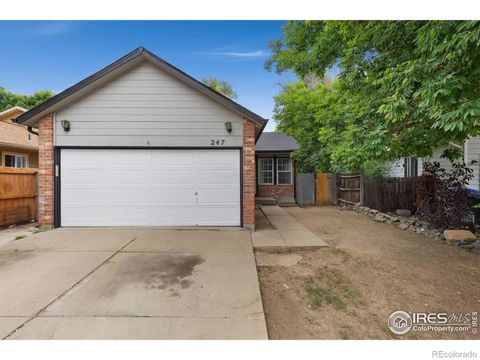
Active
$473,000
4
bds
|
2
ba
|
1,840
sqft
|
built
1987
247 Wadsworth Cir, Longmont, CO 80504
$-750
Cash flow
-8.3%
Cash-on-Cash Return
3.8%
Cap rate
0.5%
Rent to Value Ratio
Active
$525,000
3
bds
|
2
ba
|
1,508
sqft
|
built
1995
791 Thornwood Cir, Longmont, CO 80503
$-828
Cash flow
-8.2%
Cash-on-Cash Return
3.8%
Cap rate
0.5%
Rent to Value Ratio
Active
$375,000
2
bds
|
3
ba
|
1,372
sqft
|
built
2002
818 S Terry St, Longmont, CO 80501
$-853
Cash flow
-11.9%
Cash-on-Cash Return
3.0%
Cap rate
0.6%
Rent to Value Ratio
Active
$500,000
3
bds
|
2
ba
|
1,689
sqft
|
built
1973
2305 Corey St, Longmont, CO 80501
$-627
Cash flow
-6.5%
Cash-on-Cash Return
4.2%
Cap rate
0.6%
Rent to Value Ratio
Active
$1,145,000
4
bds
|
3
ba
|
2,416
sqft
|
built
1910
831 4th Ave, Longmont, CO 80501
$-3,405
Cash flow
-15.5%
Cash-on-Cash Return
2.1%
Cap rate
0.3%
Rent to Value Ratio
Active
$660,000
3
bds
|
1
ba
|
1,893
sqft
|
built
1969
12884 Anhawa Ave, Longmont, CO 80503
$-1,279
Cash flow
-10.1%
Cash-on-Cash Return
3.4%
Cap rate
0.5%
Rent to Value Ratio
Active
$525,000
2
bds
|
2
ba
|
1,136
sqft
|
built
1984
2990 Shadow Creek Dr, Boulder, CO 80303
$-1,409
Cash flow
-14.0%
Cash-on-Cash Return
2.5%
Cap rate
0.5%
Rent to Value Ratio
Active
$635,000
5
bds
|
4
ba
|
3,111
sqft
|
built
1976
2304 Jewel St, Longmont, CO 80501
$-1,330
Cash flow
-10.9%
Cash-on-Cash Return
3.2%
Cap rate
0.4%
Rent to Value Ratio
Active
$890,000
4
bds
|
3
ba
|
1,964
sqft
|
built
1985
3592 Ridge Rd, Nederland, CO 80466
$-1,680
Cash flow
-9.8%
Cash-on-Cash Return
3.4%
Cap rate
0.5%
Rent to Value Ratio
Active
$2,690,000
5
bds
|
5
ba
|
5,405
sqft
|
built
2005
6557 Legend Ridge Trl, Niwot, CO 80503
$-9,073
Cash flow
-17.6%
Cash-on-Cash Return
1.6%
Cap rate
0.3%
Rent to Value Ratio
Active
$775,000
2
bds
|
2
ba
|
2,104
sqft
|
built
1976
251 Haugen Slide Rd, Allenspark, CO 80510
$-1,496
Cash flow
-10.1%
Cash-on-Cash Return
3.4%
Cap rate
0.5%
Rent to Value Ratio
Active
$1,125,000
5
bds
|
4
ba
|
3,527
sqft
|
built
1998
1380 Northpark Dr, Lafayette, CO 80026
$-3,213
Cash flow
-14.9%
Cash-on-Cash Return
2.3%
Cap rate
0.4%
Rent to Value Ratio
Active
$725,000
4
bds
|
3
ba
|
2,718
sqft
|
built
2016
31 Stewart Way, Erie, CO 80516
$-1,720
Cash flow
-12.4%
Cash-on-Cash Return
2.8%
Cap rate
0.4%
Rent to Value Ratio
Active
$710,000
6
bds
|
2
ba
|
2,378
sqft
|
built
1980
1305 Inverness Dr, Lafayette, CO 80026
$-1,498
Cash flow
-11.0%
Cash-on-Cash Return
3.1%
Cap rate
0.5%
Rent to Value Ratio
Active
$1,095,000
4
bds
|
4
ba
|
3,647
sqft
|
built
2007
121 Osprey Ln, Lyons, CO 80540
$-2,551
Cash flow
-12.2%
Cash-on-Cash Return
2.9%
Cap rate
0.4%
Rent to Value Ratio
Active
$341,000
2
bds
|
1
ba
|
840
sqft
|
built
1984
1068 Milo Cir, Lafayette, CO 80026
$-892
Cash flow
-13.6%
Cash-on-Cash Return
2.5%
Cap rate
0.6%
Rent to Value Ratio
Active
$600,000
3
bds
|
3
ba
|
1,824
sqft
|
built
1997
2408 Concord Cir, Lafayette, CO 80026
$-1,661
Cash flow
-14.4%
Cash-on-Cash Return
2.4%
Cap rate
0.5%
Rent to Value Ratio
Active
$600,000
4
bds
|
2
ba
|
1,736
sqft
|
built
1981
309 Baron Ave, Lafayette, CO 80026
$-1,183
Cash flow
-10.3%
Cash-on-Cash Return
3.3%
Cap rate
0.5%
Rent to Value Ratio
Active
$345,000
2
bds
|
2
ba
|
1,064
sqft
|
built
1984
1045 Milo Cir, Lafayette, CO 80026
$-791
Cash flow
-12.0%
Cash-on-Cash Return
2.9%
Cap rate
0.6%
Rent to Value Ratio