Boulder County Investment Properties for Sale
Browse homes for sale and investment properties in Boulder County. Refine your search by price, property type, or more.
Best cash flowing properties in Boulder County
Active under contract
$485,500
3
bds
|
2
ba
|
1,440
sqft
|
built
1979
1085 Malory St, Lafayette, CO 80026
$-601
Cash flow
-6.5%
Cash-on-Cash Return
4.2%
Cap rate
0.6%
Rent to Value Ratio
Active
$425,000
2
bds
|
1
ba
|
720
sqft
|
built
1952
128 E 5th Ave, Longmont, CO 80504
$-667
Cash flow
-8.2%
Cash-on-Cash Return
3.8%
Cap rate
0.5%
Rent to Value Ratio
1,192 out of 1,330 properties for sale in Boulder County
Limited Results Shown
Create a free account, or log in to reveal all property listings and enjoy the complete experience.
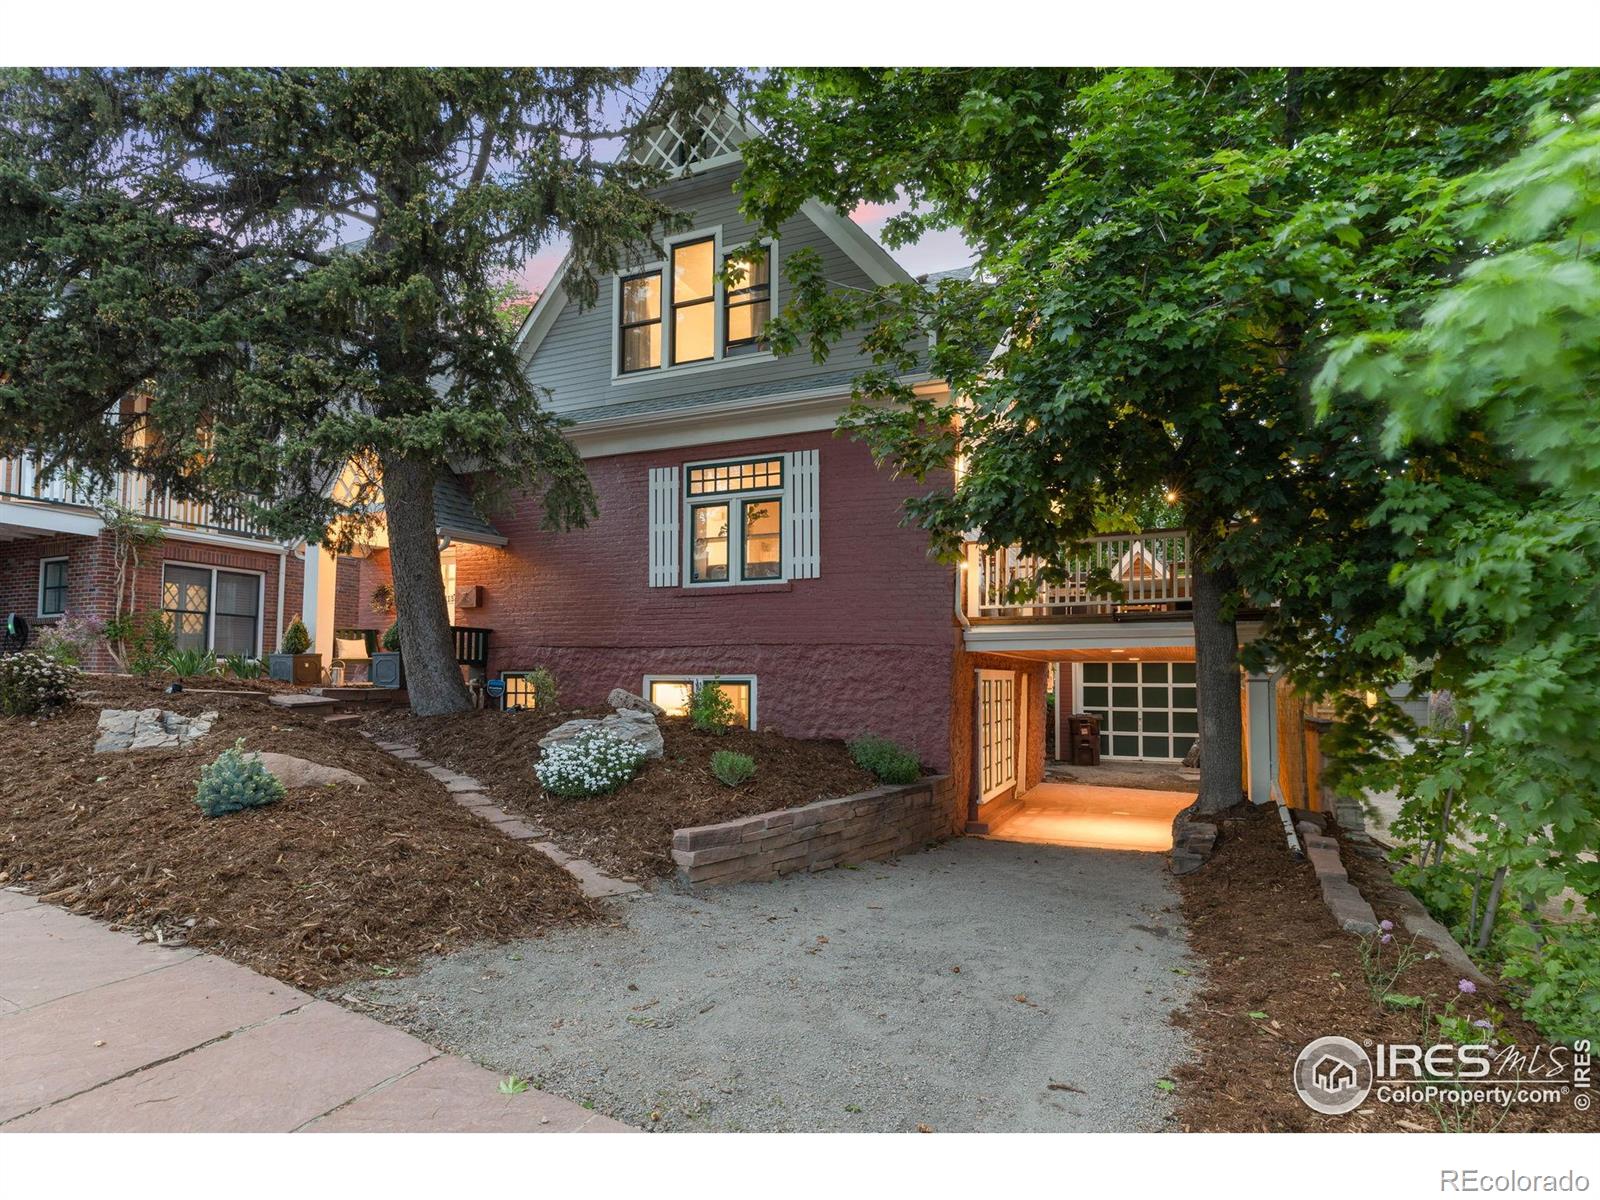
Active under contract
$1,895,000
5
bds
|
3
ba
|
2,781
sqft
|
built
1914
1133 Mapleton Ave, Boulder, CO 80304
$-5,907
Cash flow
-16.3%
Cash-on-Cash Return
1.9%
Cap rate
0.3%
Rent to Value Ratio
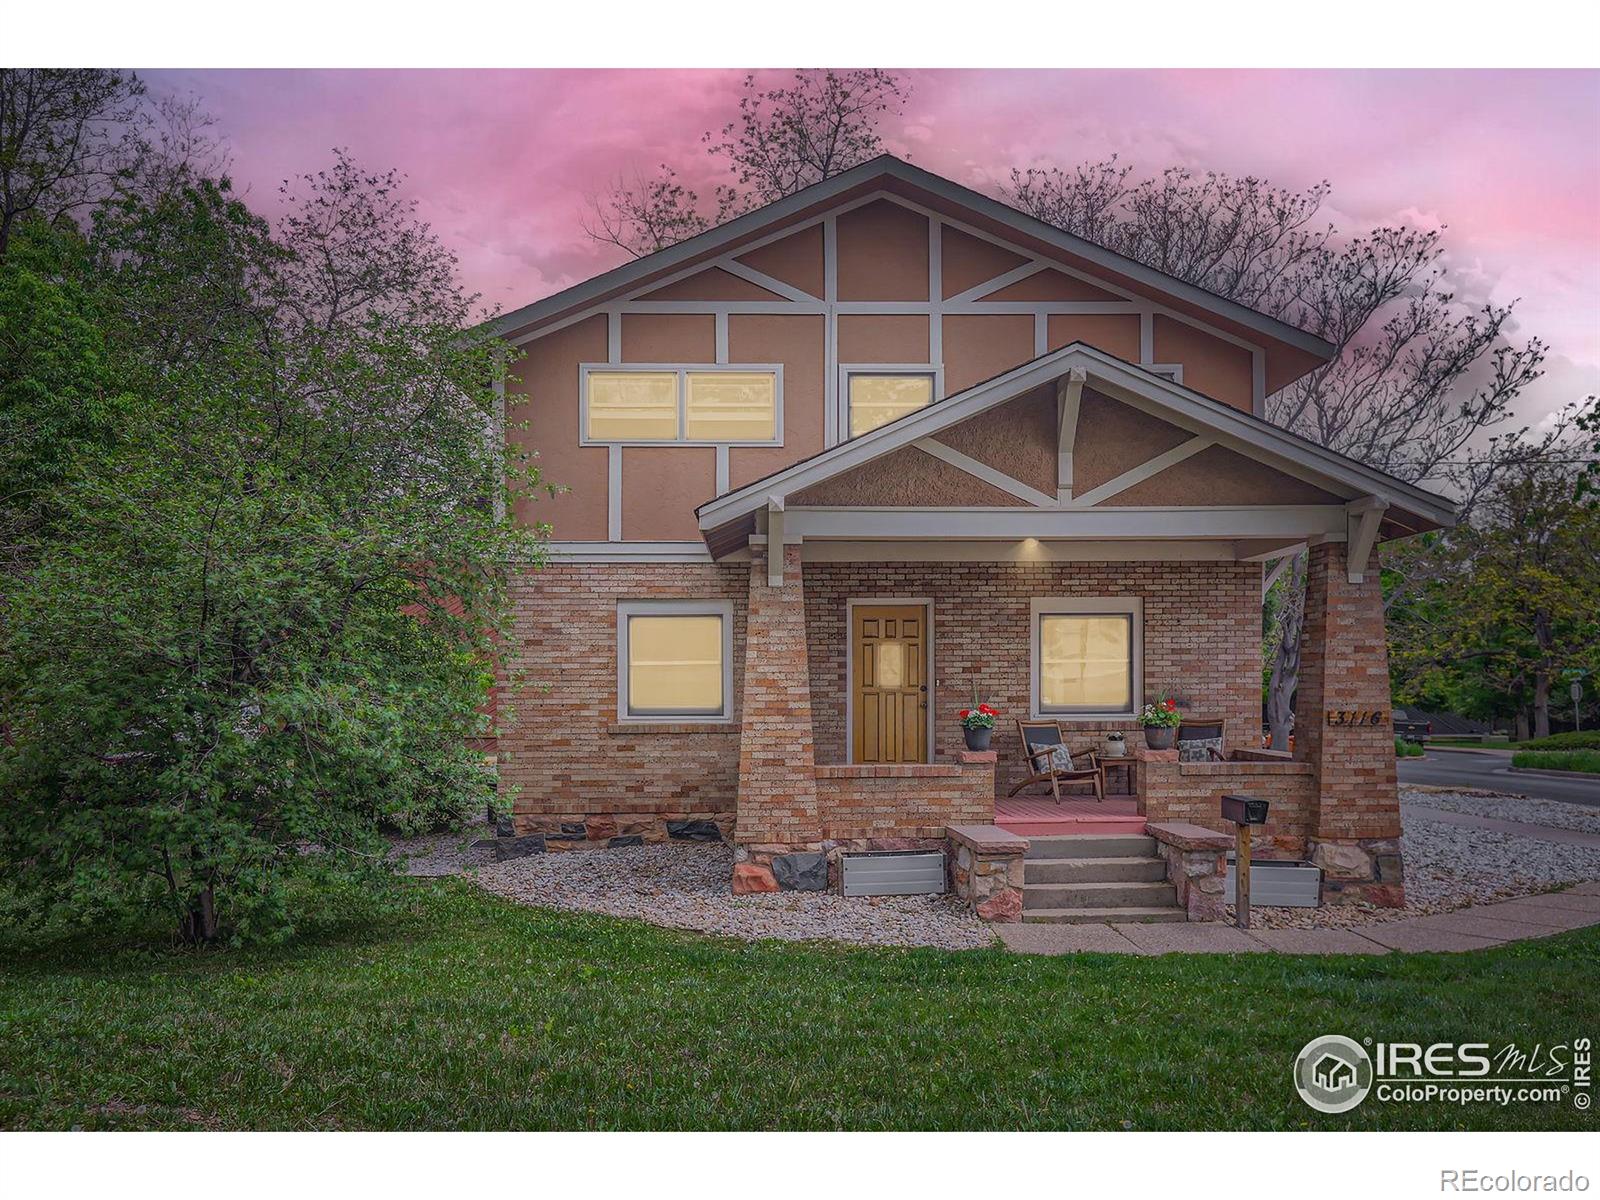
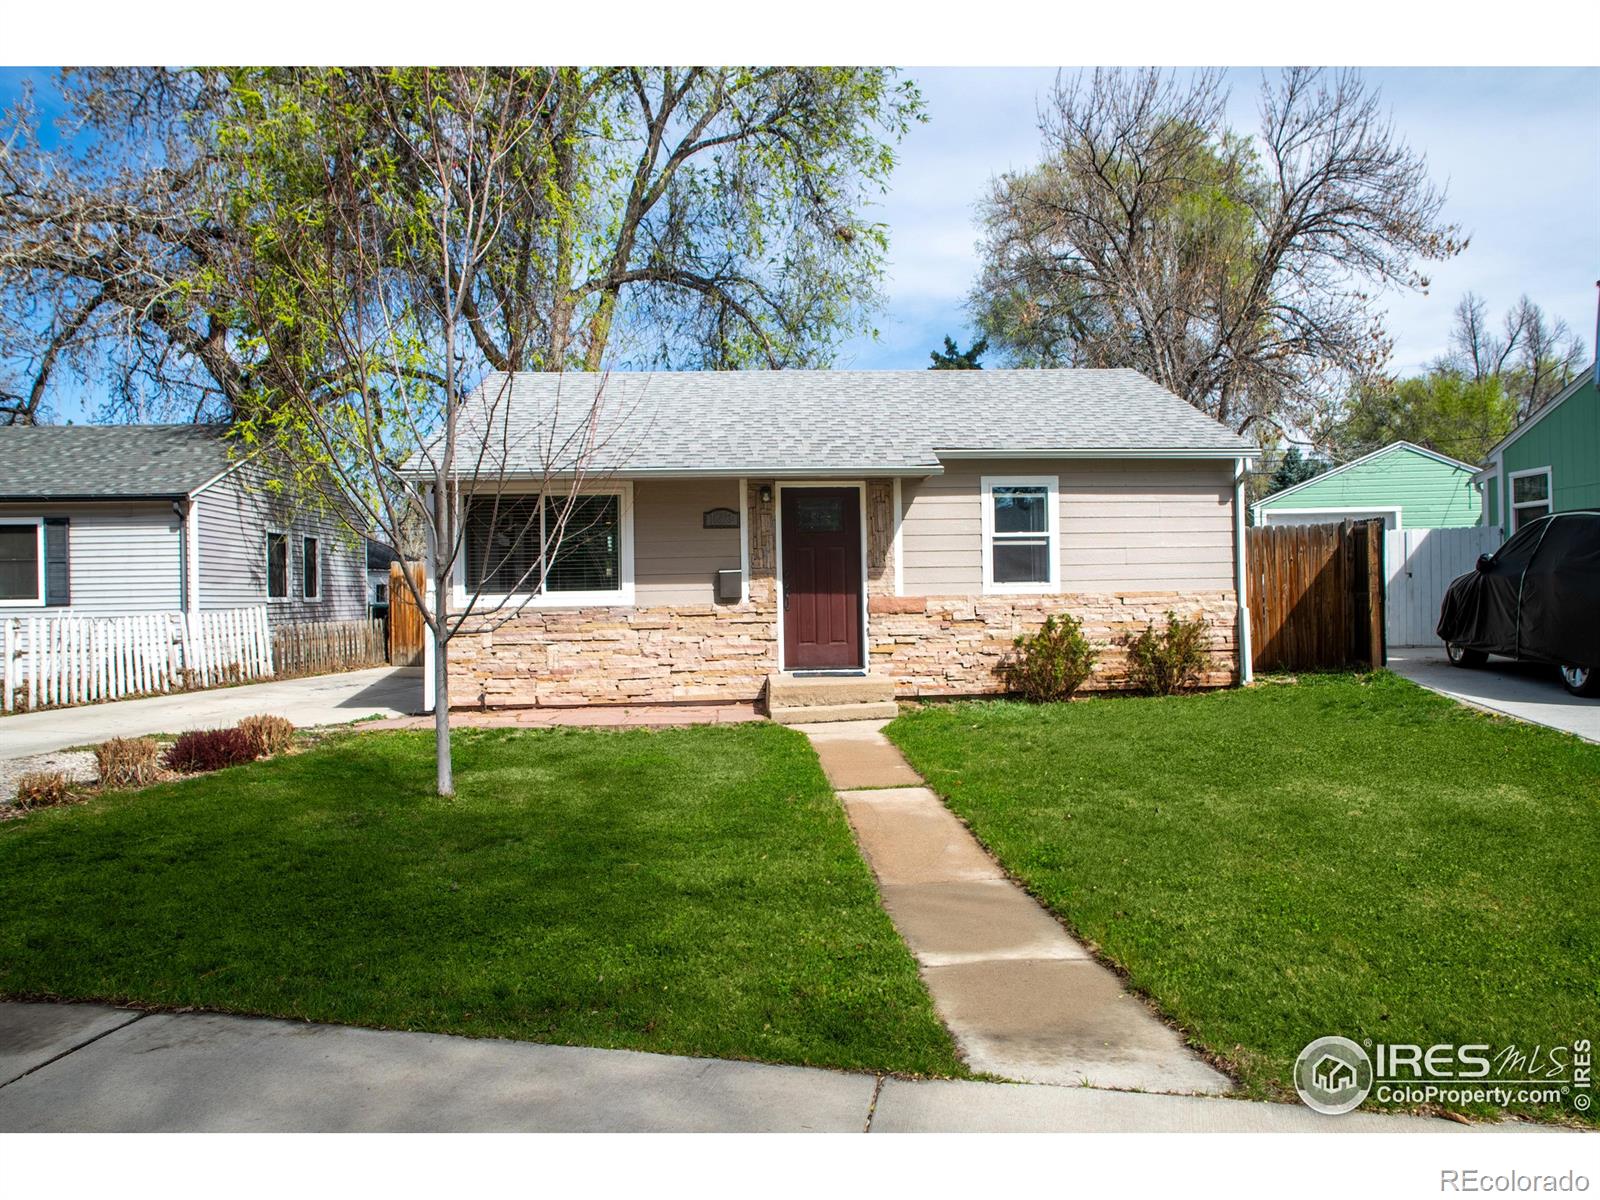
Active
$899,000
4
bds
|
2
ba
|
2,214
sqft
|
built
1923
3116 47th St, Boulder, CO 80301
$-2,210
Cash flow
-12.8%
Cash-on-Cash Return
2.7%
Cap rate
0.4%
Rent to Value Ratio
Active
$360,000
bds
|
1
ba
|
400
sqft
|
built
2002
1089 Laramie Blvd, Boulder, CO 80304
$-793
Cash flow
-11.5%
Cash-on-Cash Return
3.0%
Cap rate
0.5%
Rent to Value Ratio
Active
$1,495,000
4
bds
|
2
ba
|
2,349
sqft
|
built
1985
265 31st St, Boulder, CO 80305
$-4,821
Cash flow
-16.8%
Cash-on-Cash Return
1.8%
Cap rate
0.3%
Rent to Value Ratio
Active
$524,000
1
bds
|
1
ba
|
858
sqft
|
built
2004
3215 Foundry Pl, Boulder, CO 80301
$-1,637
Cash flow
-16.3%
Cash-on-Cash Return
1.9%
Cap rate
0.4%
Rent to Value Ratio
Active
$610,000
2
bds
|
1
ba
|
800
sqft
|
built
2014
1707 Walnut St, Boulder, CO 80302
$-1,501
Cash flow
-12.8%
Cash-on-Cash Return
2.7%
Cap rate
0.5%
Rent to Value Ratio
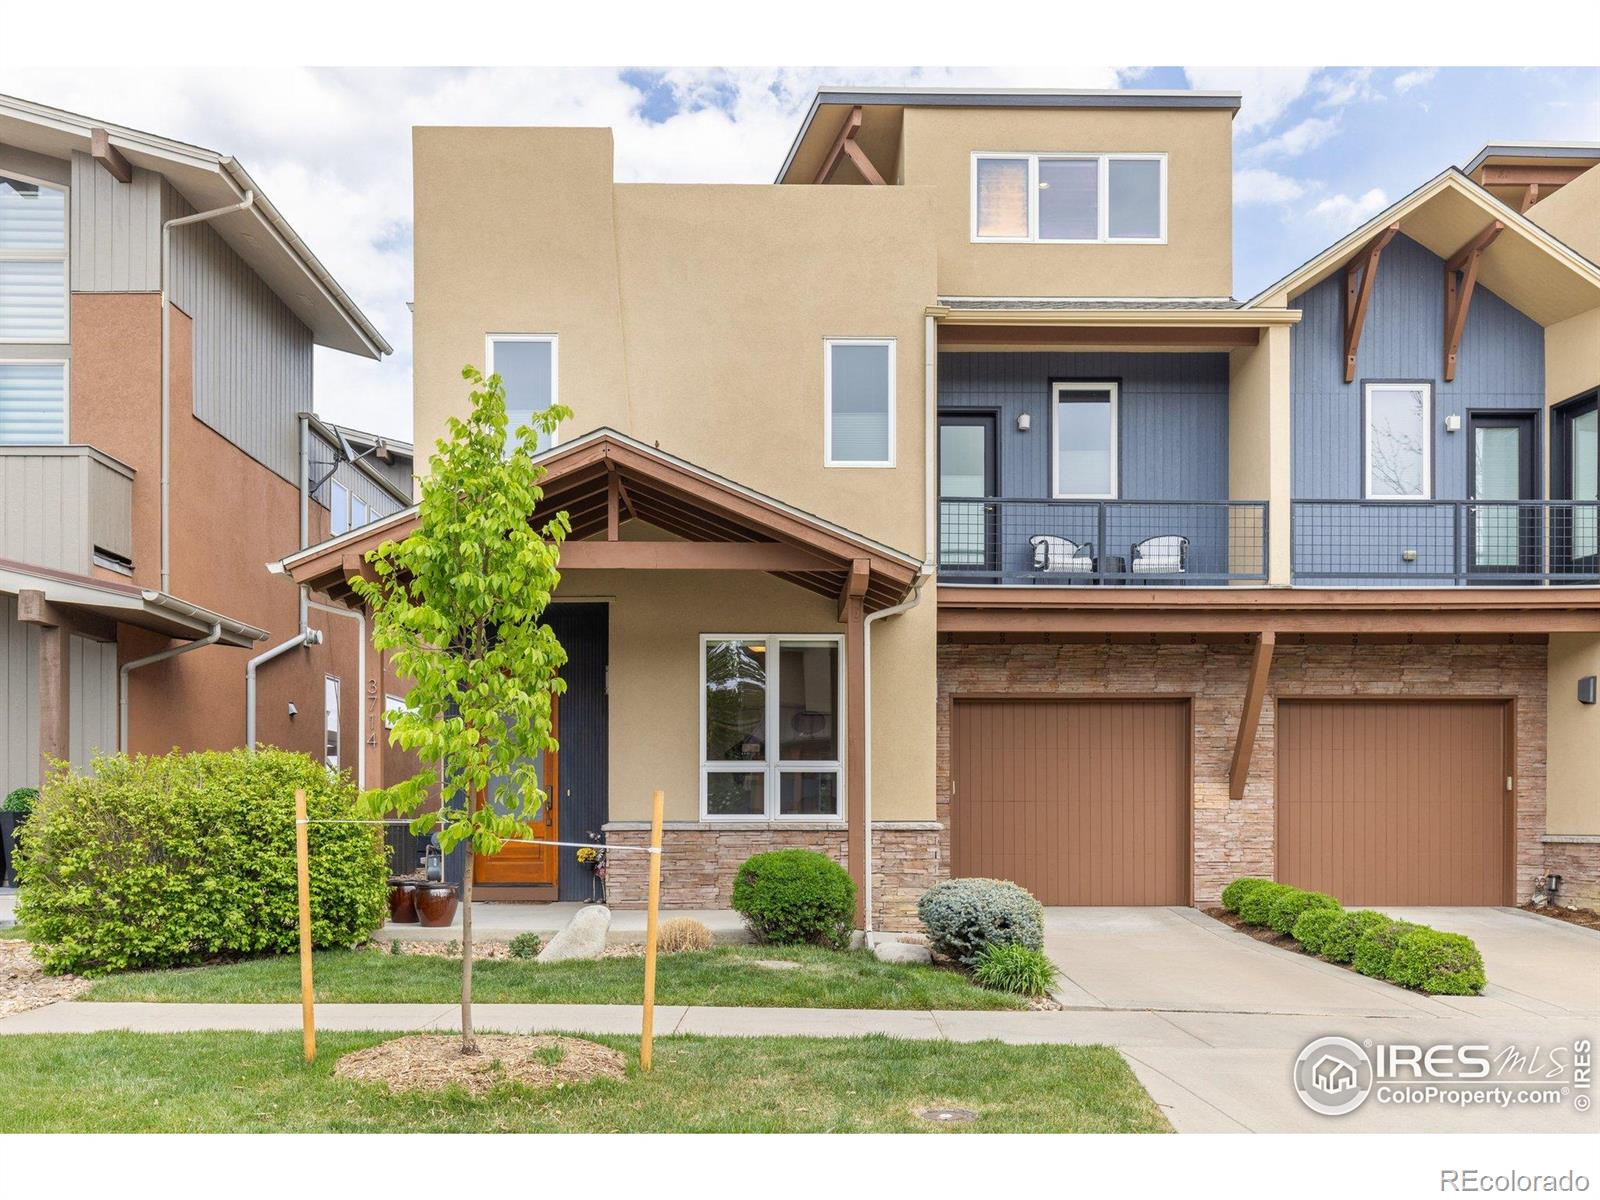
Active
$1,118,000
3
bds
|
3
ba
|
3,159
sqft
|
built
2010
3714 Ridgeway St, Boulder, CO 80301
$-3,788
Cash flow
-17.7%
Cash-on-Cash Return
1.6%
Cap rate
0.3%
Rent to Value Ratio
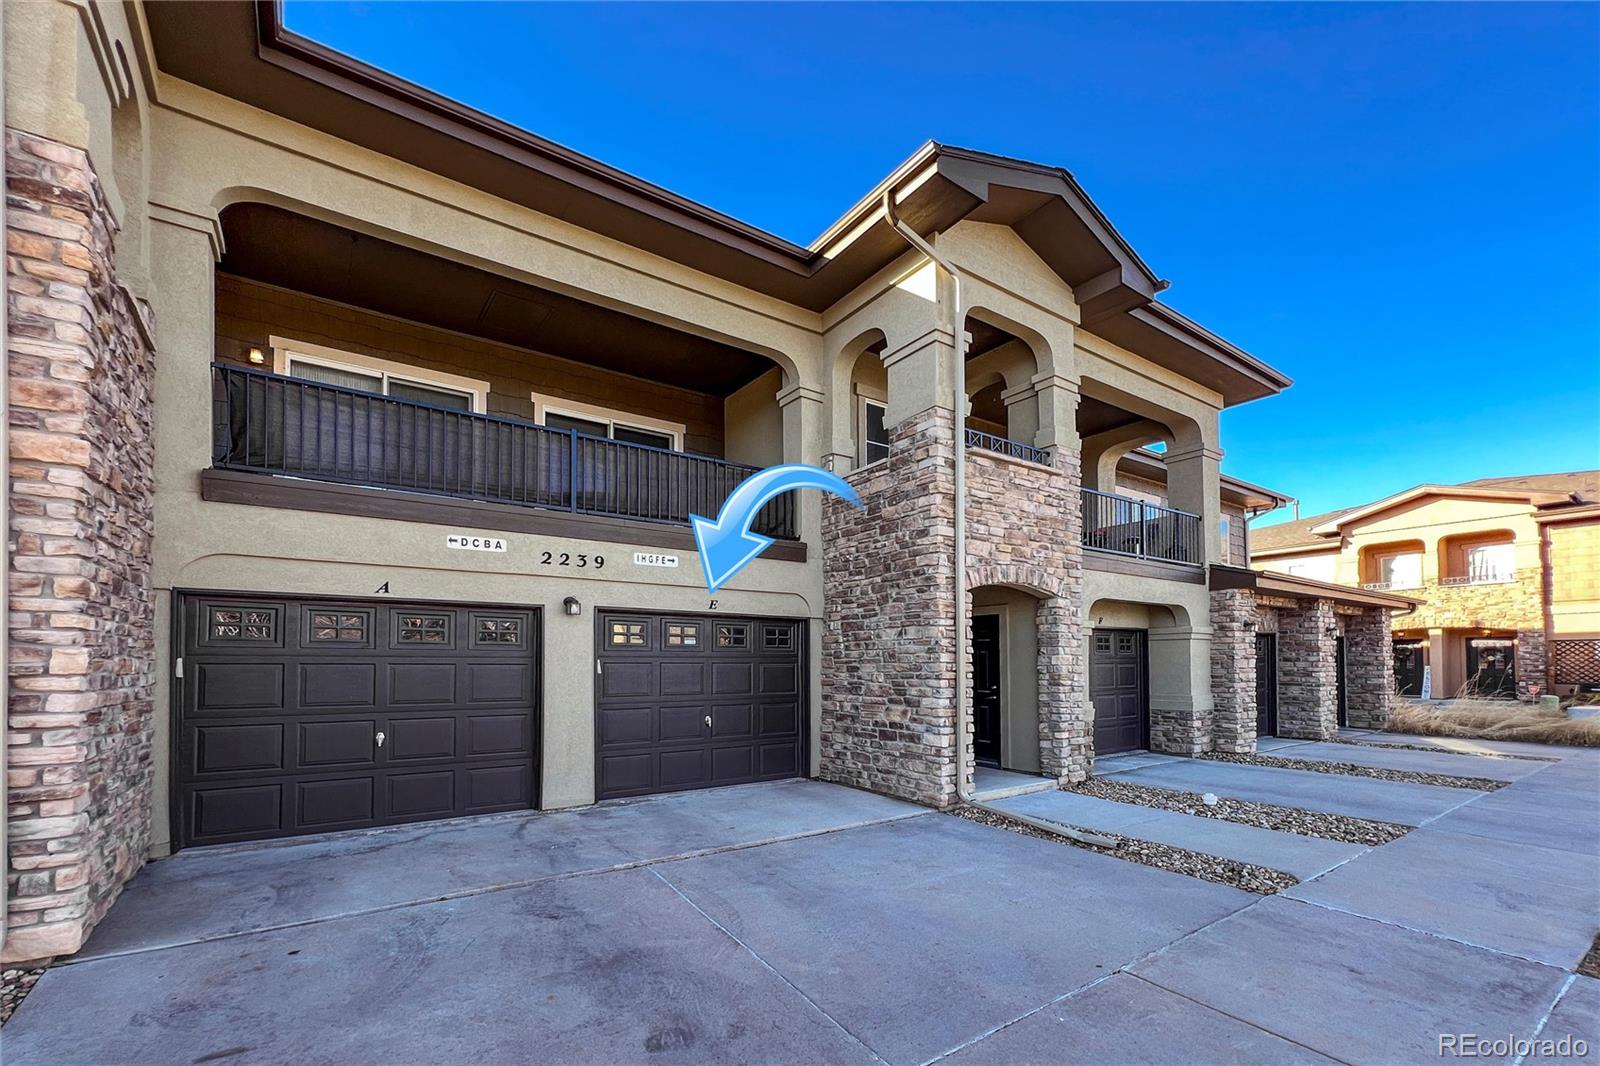
Active
$405,000
2
bds
|
2
ba
|
1,201
sqft
|
built
2005
2239 Calais Dr, Longmont, CO 80504
$-855
Cash flow
-11.0%
Cash-on-Cash Return
3.1%
Cap rate
0.6%
Rent to Value Ratio
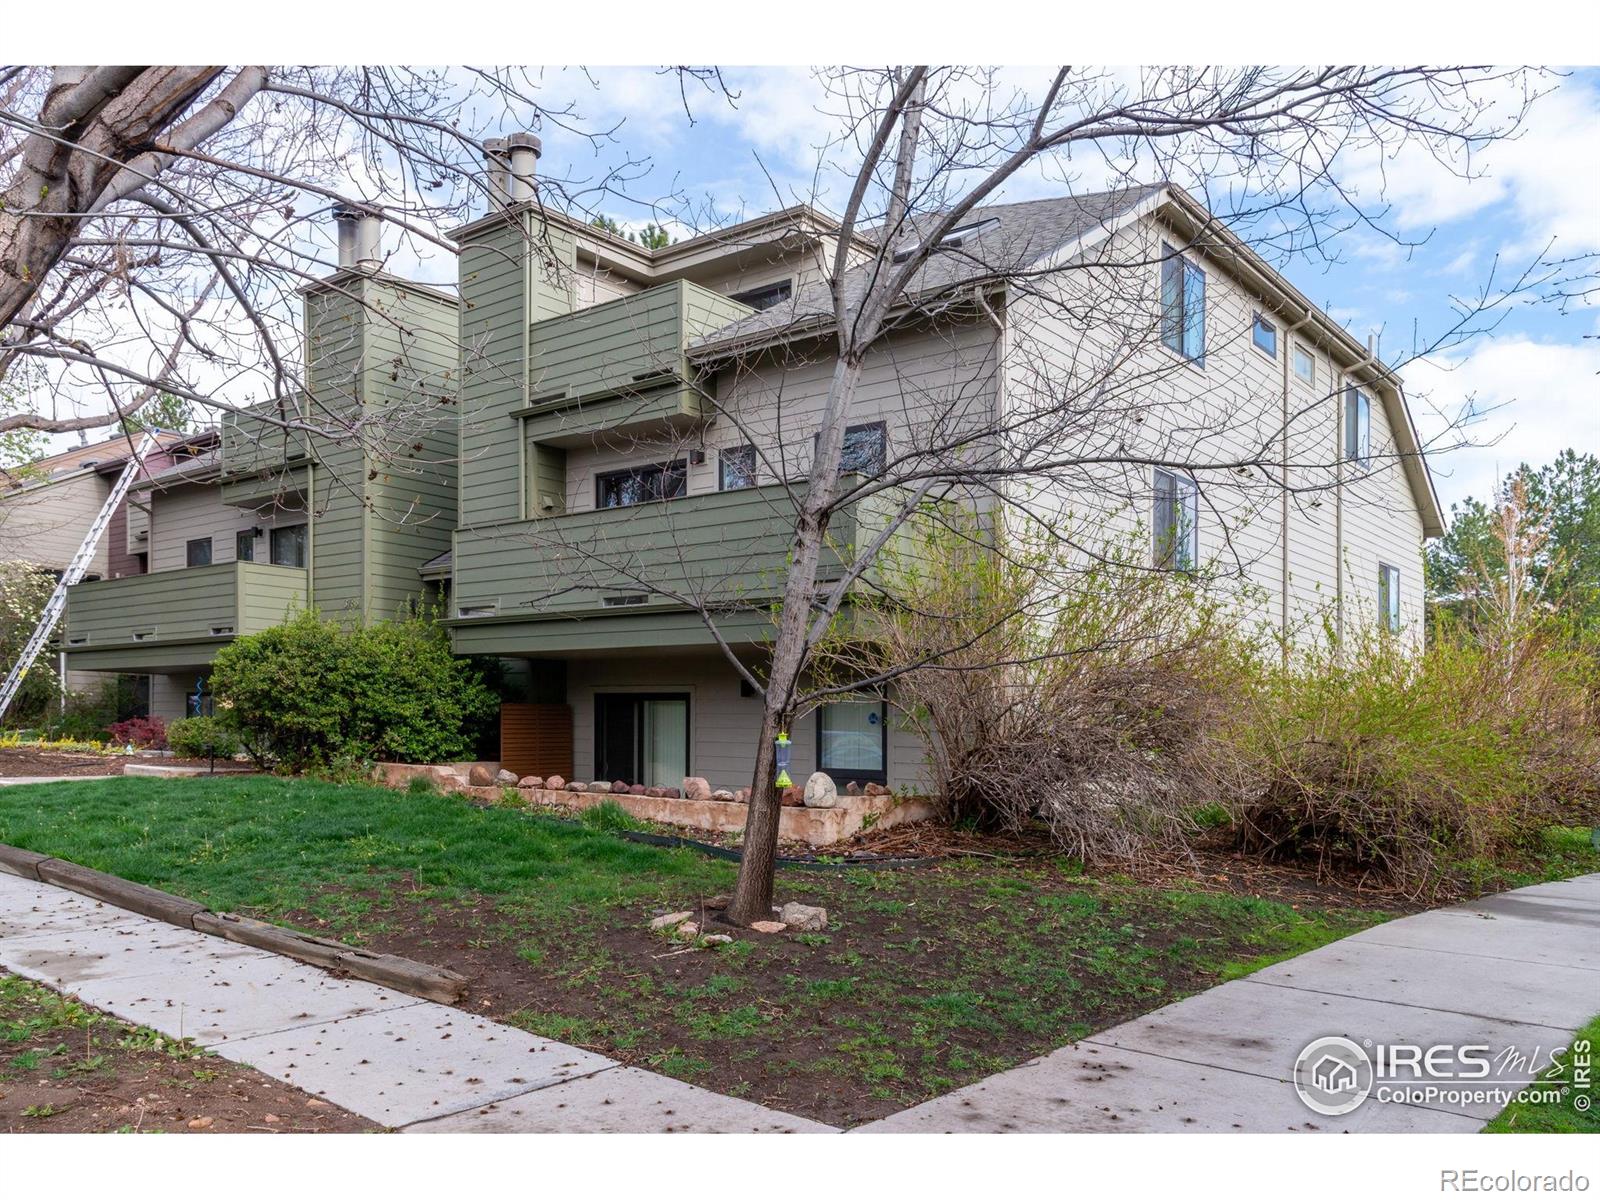
Active
$659,000
3
bds
|
2
ba
|
1,632
sqft
|
built
1983
3785 Birchwood Dr, Boulder, CO 80304
$-2,074
Cash flow
-16.4%
Cash-on-Cash Return
1.9%
Cap rate
0.5%
Rent to Value Ratio
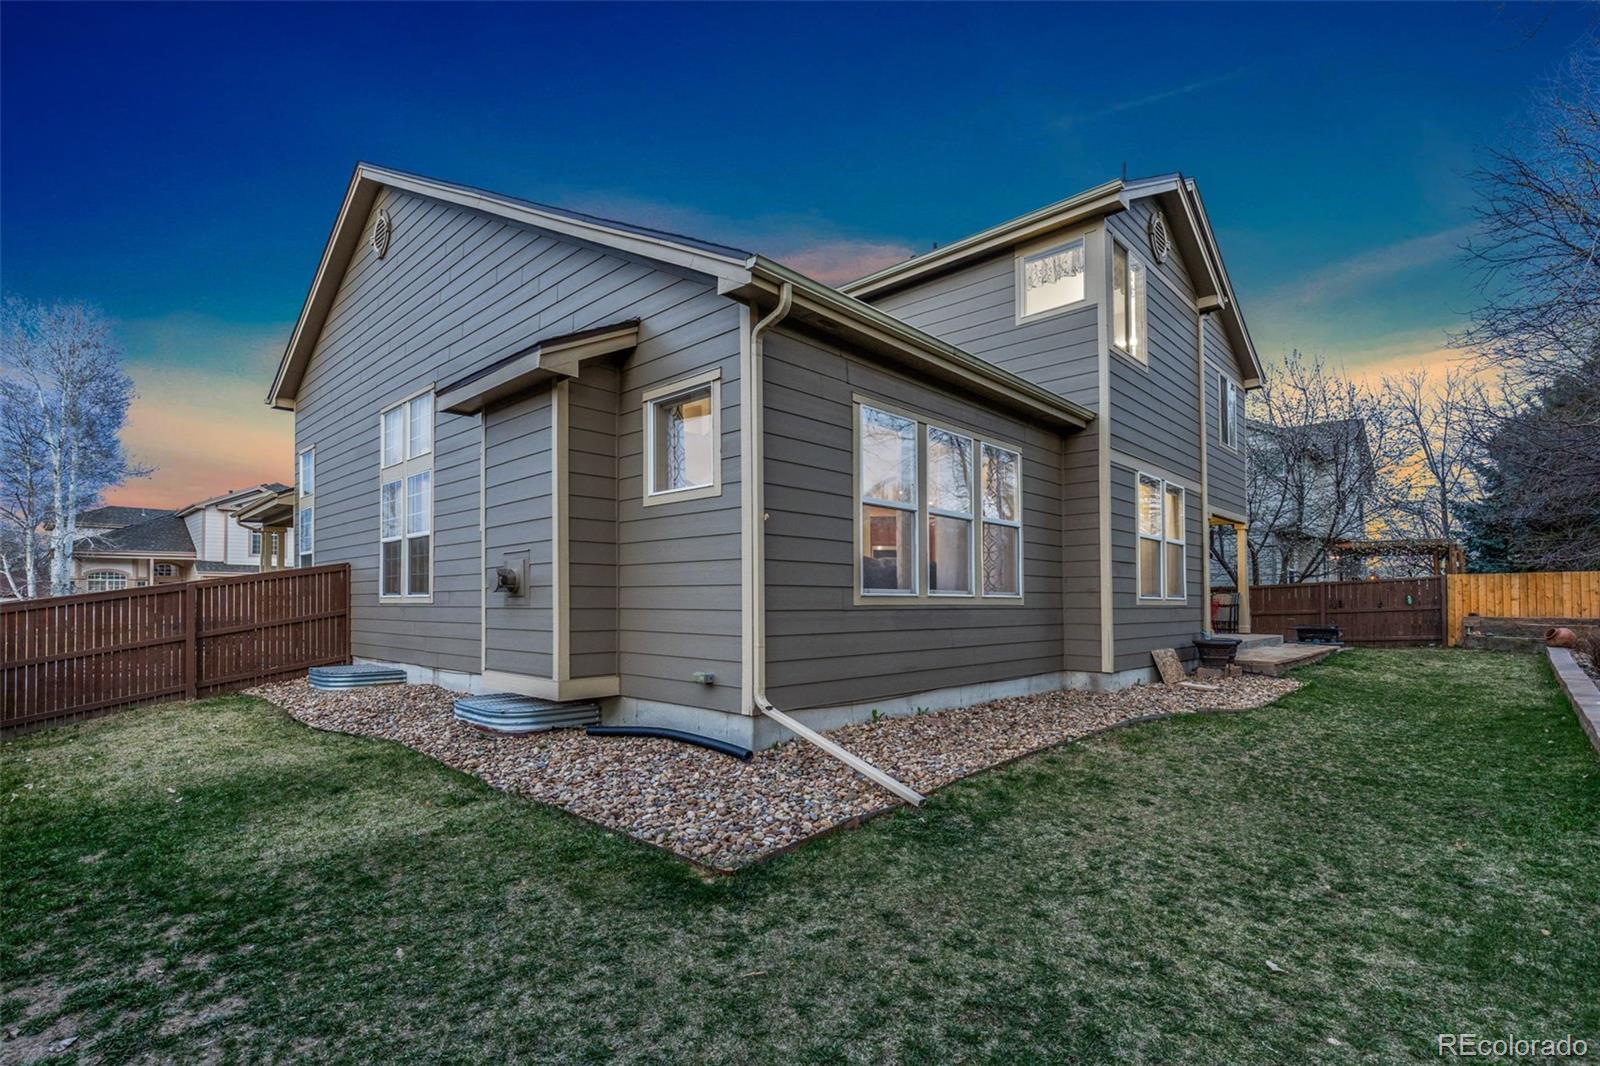
Active
$765,000
6
bds
|
5
ba
|
4,782
sqft
|
built
2000
1831 Ashford Cir, Longmont, CO 80504
$-1,666
Cash flow
-11.4%
Cash-on-Cash Return
3.1%
Cap rate
0.5%
Rent to Value Ratio
Active
$2,250,000
3
bds
|
4
ba
|
5,807
sqft
|
built
1993
524 Cutter Ln, Boulder, CO 80302
$-6,456
Cash flow
-15.0%
Cash-on-Cash Return
2.2%
Cap rate
0.4%
Rent to Value Ratio
Active
$3,500,000
4
bds
|
5
ba
|
4,385
sqft
|
built
1981
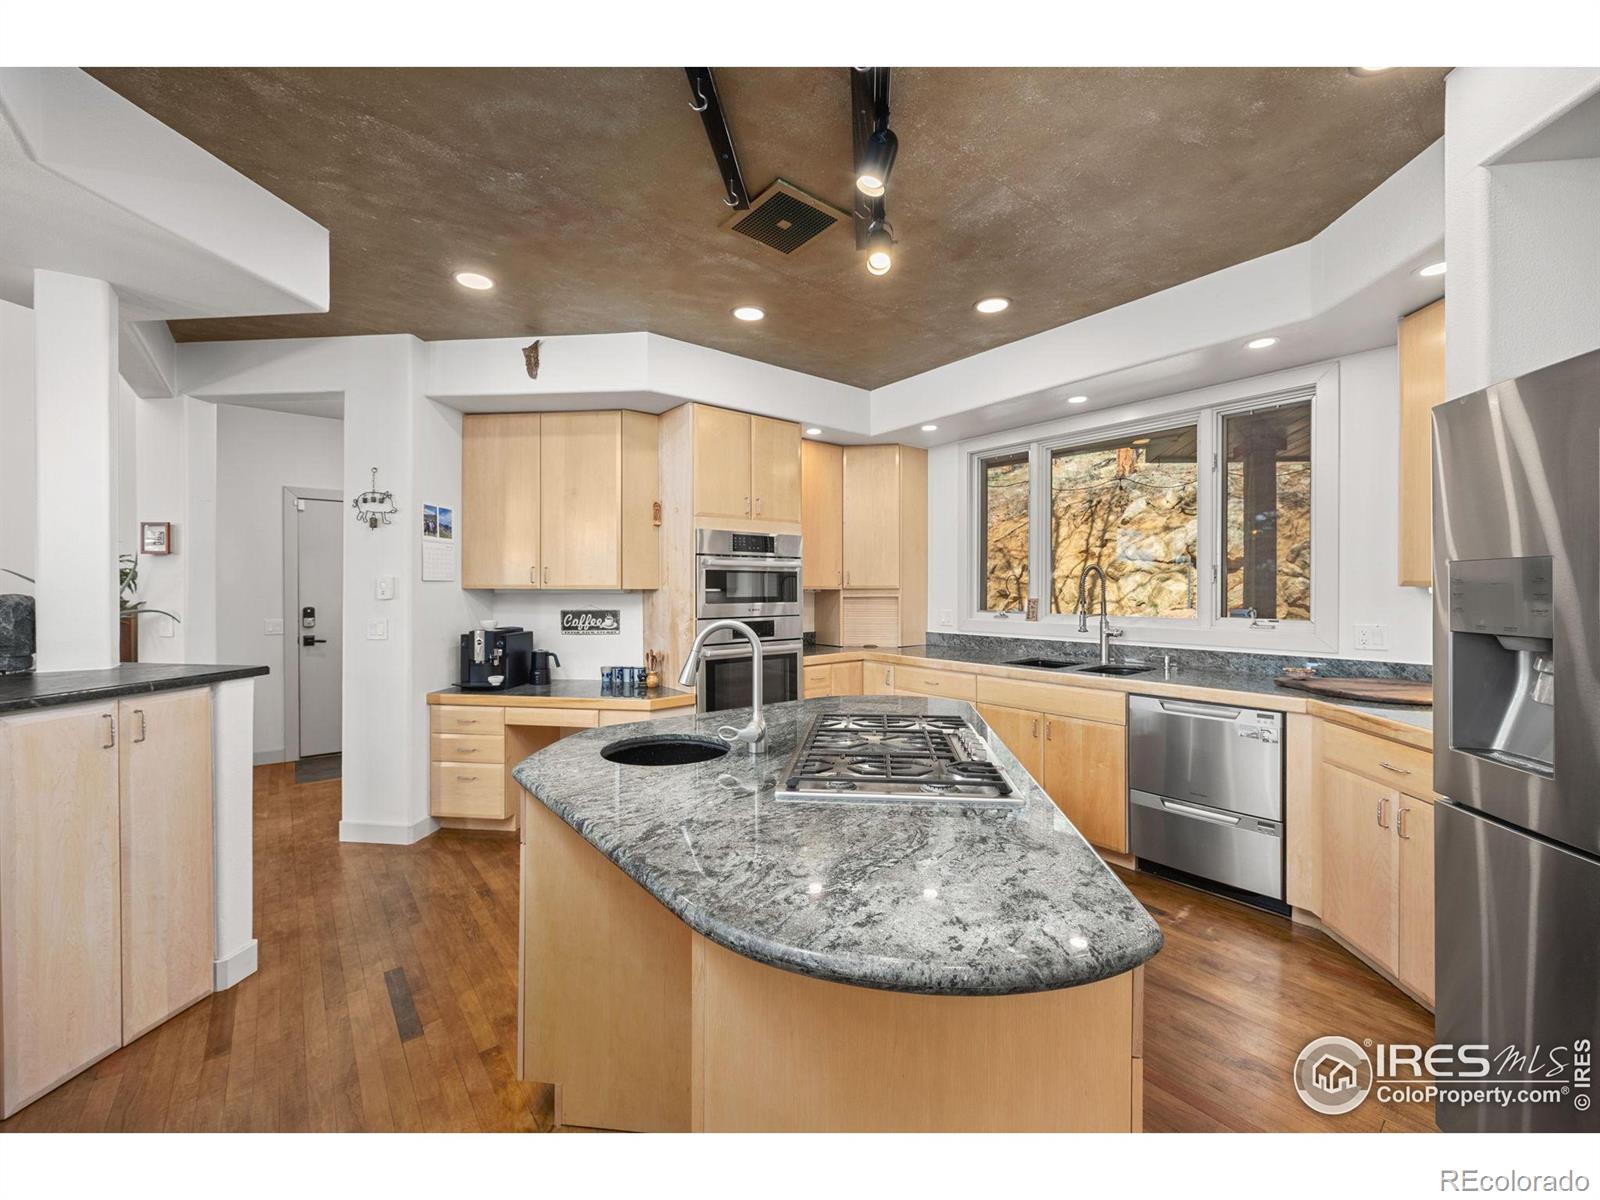
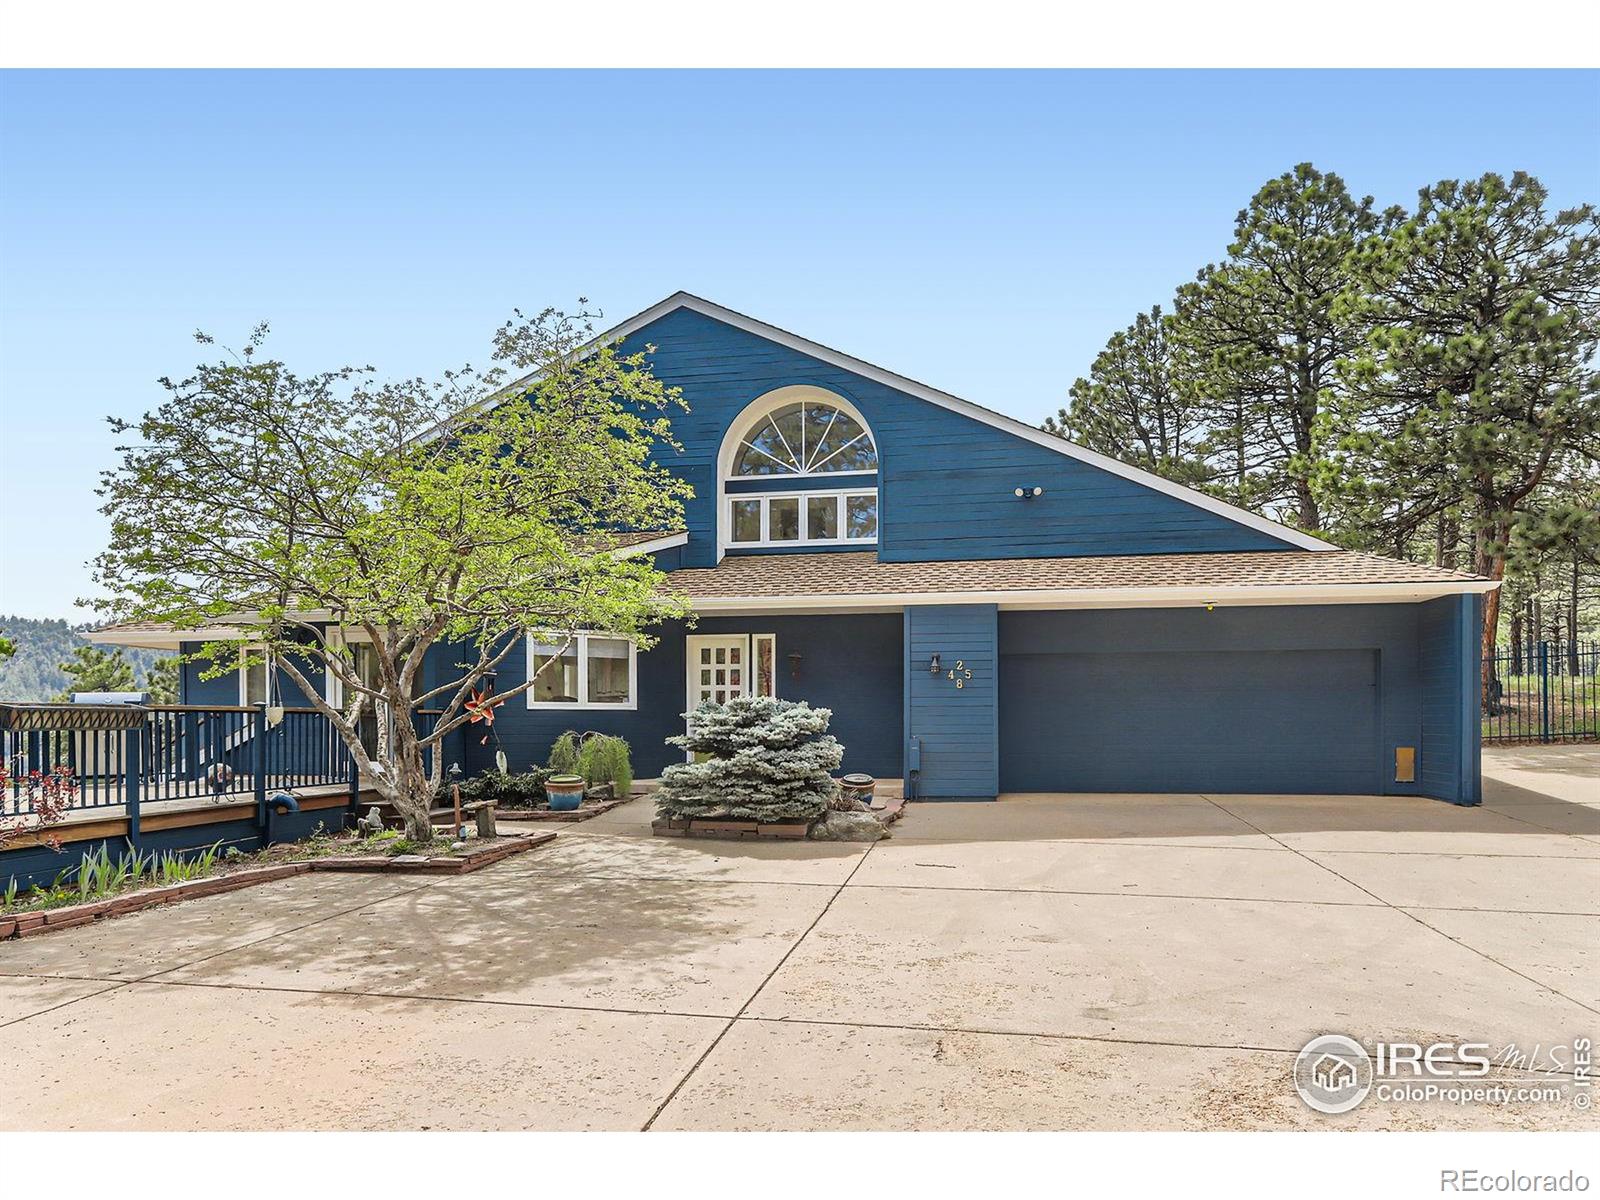
2485 Lee Hill Dr, Boulder, CO 80302
$-12,467
Cash flow
-18.6%
Cash-on-Cash Return
1.4%
Cap rate
0.2%
Rent to Value Ratio
Active
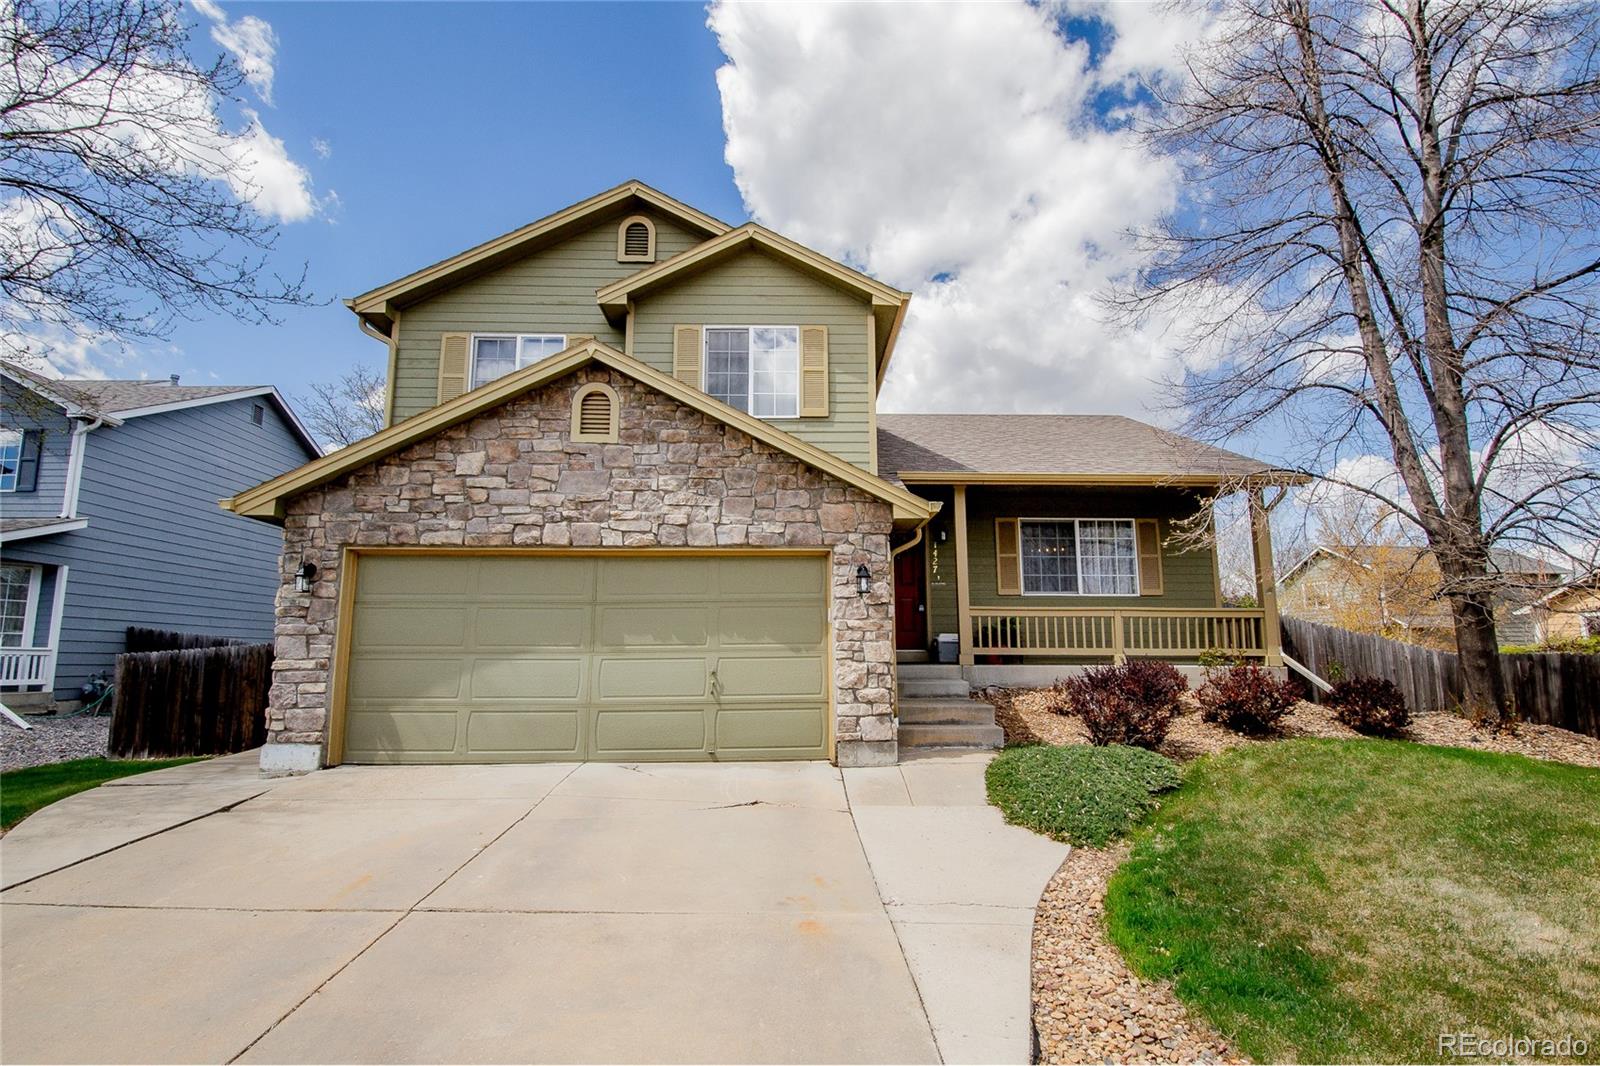
$625,000
4
bds
|
4
ba
|
1,875
sqft
|
built
1997
1427 Deerwood Dr, Longmont, CO 80504
$-1,363
Cash flow
-11.4%
Cash-on-Cash Return
3.1%
Cap rate
0.4%
Rent to Value Ratio
Active
$600,000
2
bds
|
3
ba
|
1,153
sqft
|
built
2002
911 Laramie Blvd, Boulder, CO 80304
$-1,526
Cash flow
-13.3%
Cash-on-Cash Return
2.6%
Cap rate
0.5%
Rent to Value Ratio
Active
$6,500,000
5
bds
|
5
ba
|
3,266
sqft
|
built
1965
7929 Valmont Rd, Boulder, CO 80301
$-25,502
Cash flow
-20.5%
Cash-on-Cash Return
1.0%
Cap rate
0.1%
Rent to Value Ratio
Active
$299,900
1
bds
|
1
ba
|
737
sqft
|
built
1983
6036 Gunbarrel Ave, Boulder, CO 80301
$-744
Cash flow
-12.9%
Cash-on-Cash Return
2.7%
Cap rate
0.7%
Rent to Value Ratio
Active
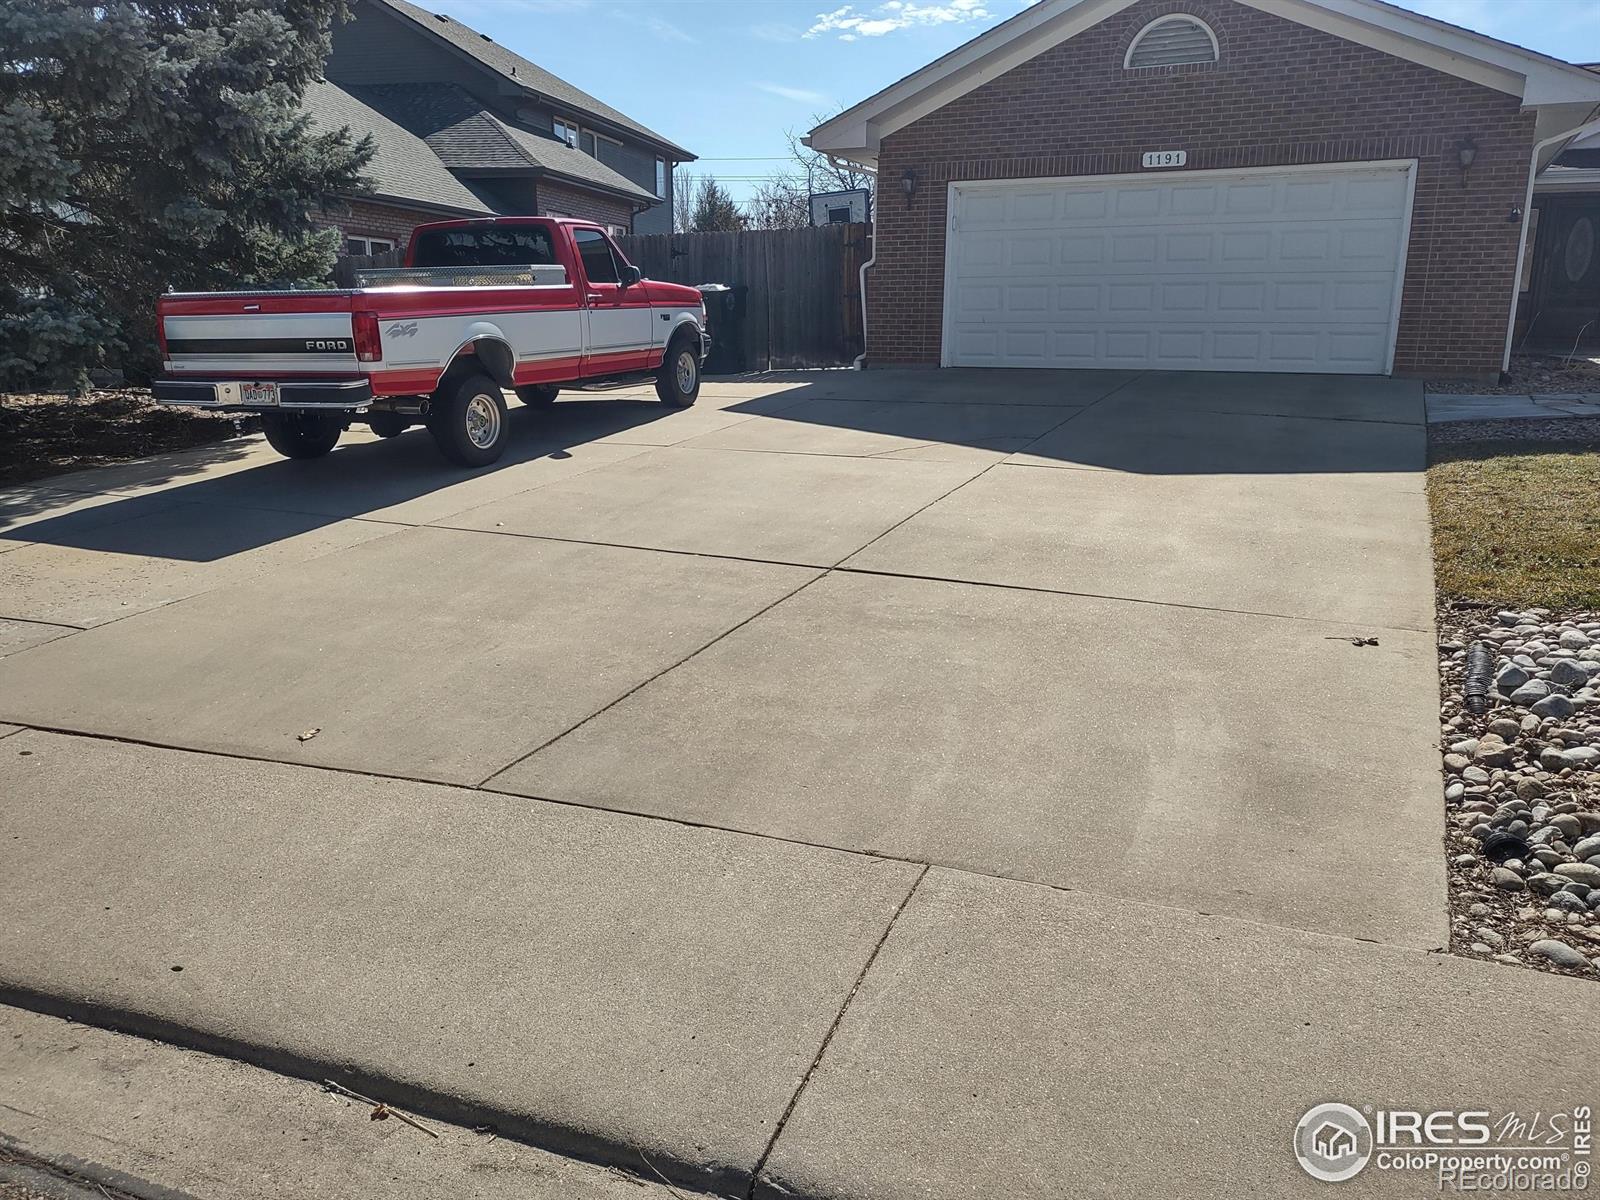
$670,000
3
bds
|
3
ba
|
2,125
sqft
|
built
1987
1191 Twin Peaks Cir, Longmont, CO 80503
$-1,316
Cash flow
-10.2%
Cash-on-Cash Return
3.3%
Cap rate
0.5%
Rent to Value Ratio
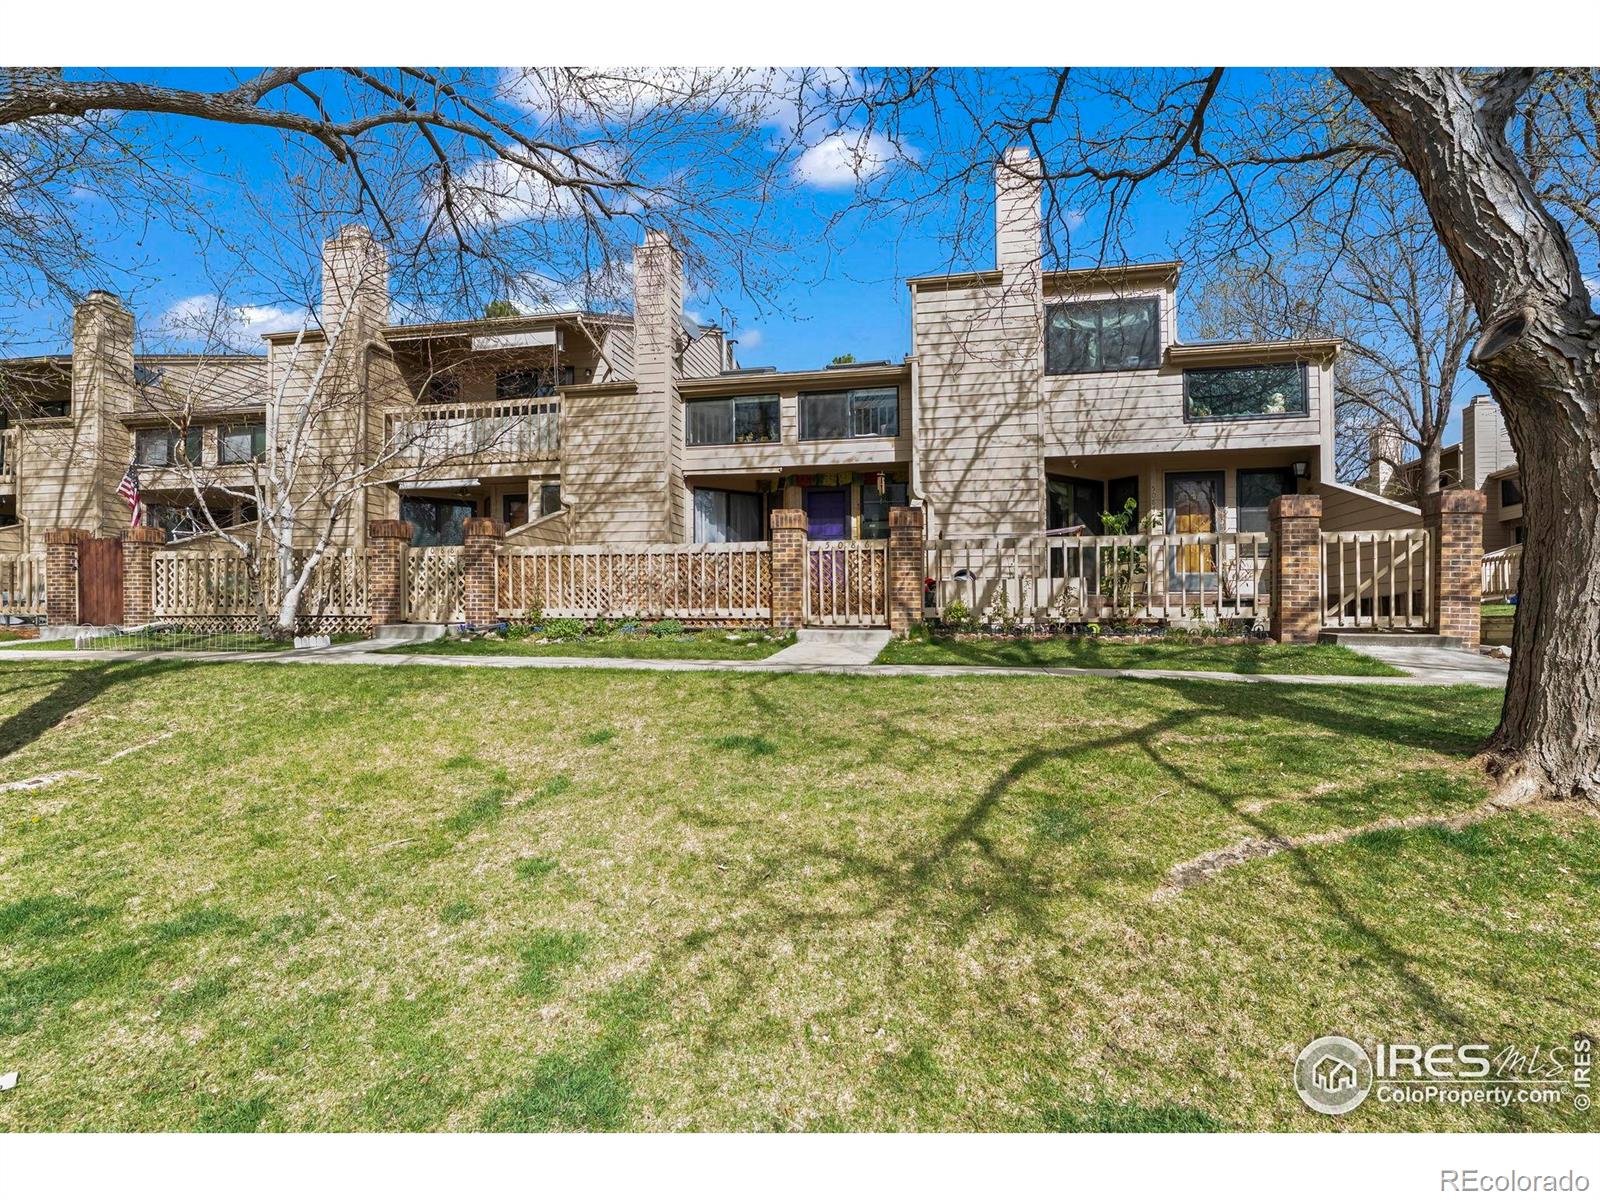
Active under contract
$399,000
1
bds
|
1
ba
|
862
sqft
|
built
1984
5086 Buckingham Rd, Boulder, CO 80301
$-838
Cash flow
-11.0%
Cash-on-Cash Return
3.2%
Cap rate
0.6%
Rent to Value Ratio
Active
$436,800
2
bds
|
1
ba
|
747
sqft
|
built
1983
4799 White Rock Cir, Boulder, CO 80301
$-1,277
Cash flow
-15.3%
Cash-on-Cash Return
2.2%
Cap rate
0.5%
Rent to Value Ratio
Active
$1,825,000
3
bds
|
2
ba
|
1,620
sqft
|
built
1900
826 Maxwell Ave, Boulder, CO 80304
$-6,009
Cash flow
-17.2%
Cash-on-Cash Return
1.7%
Cap rate
0.3%
Rent to Value Ratio
Active
$1,190,000
4
bds
|
4
ba
|
3,601
sqft
|
built
2019
1923 High Plains Dr, Longmont, CO 80503
$-3,690
Cash flow
-16.2%
Cash-on-Cash Return
2.0%
Cap rate
0.3%
Rent to Value Ratio
Active
$425,000
2
bds
|
1
ba
|
720
sqft
|
built
1952
128 E 5th Ave, Longmont, CO 80504
$-667
Cash flow
-8.2%
Cash-on-Cash Return
3.8%
Cap rate
0.5%
Rent to Value Ratio
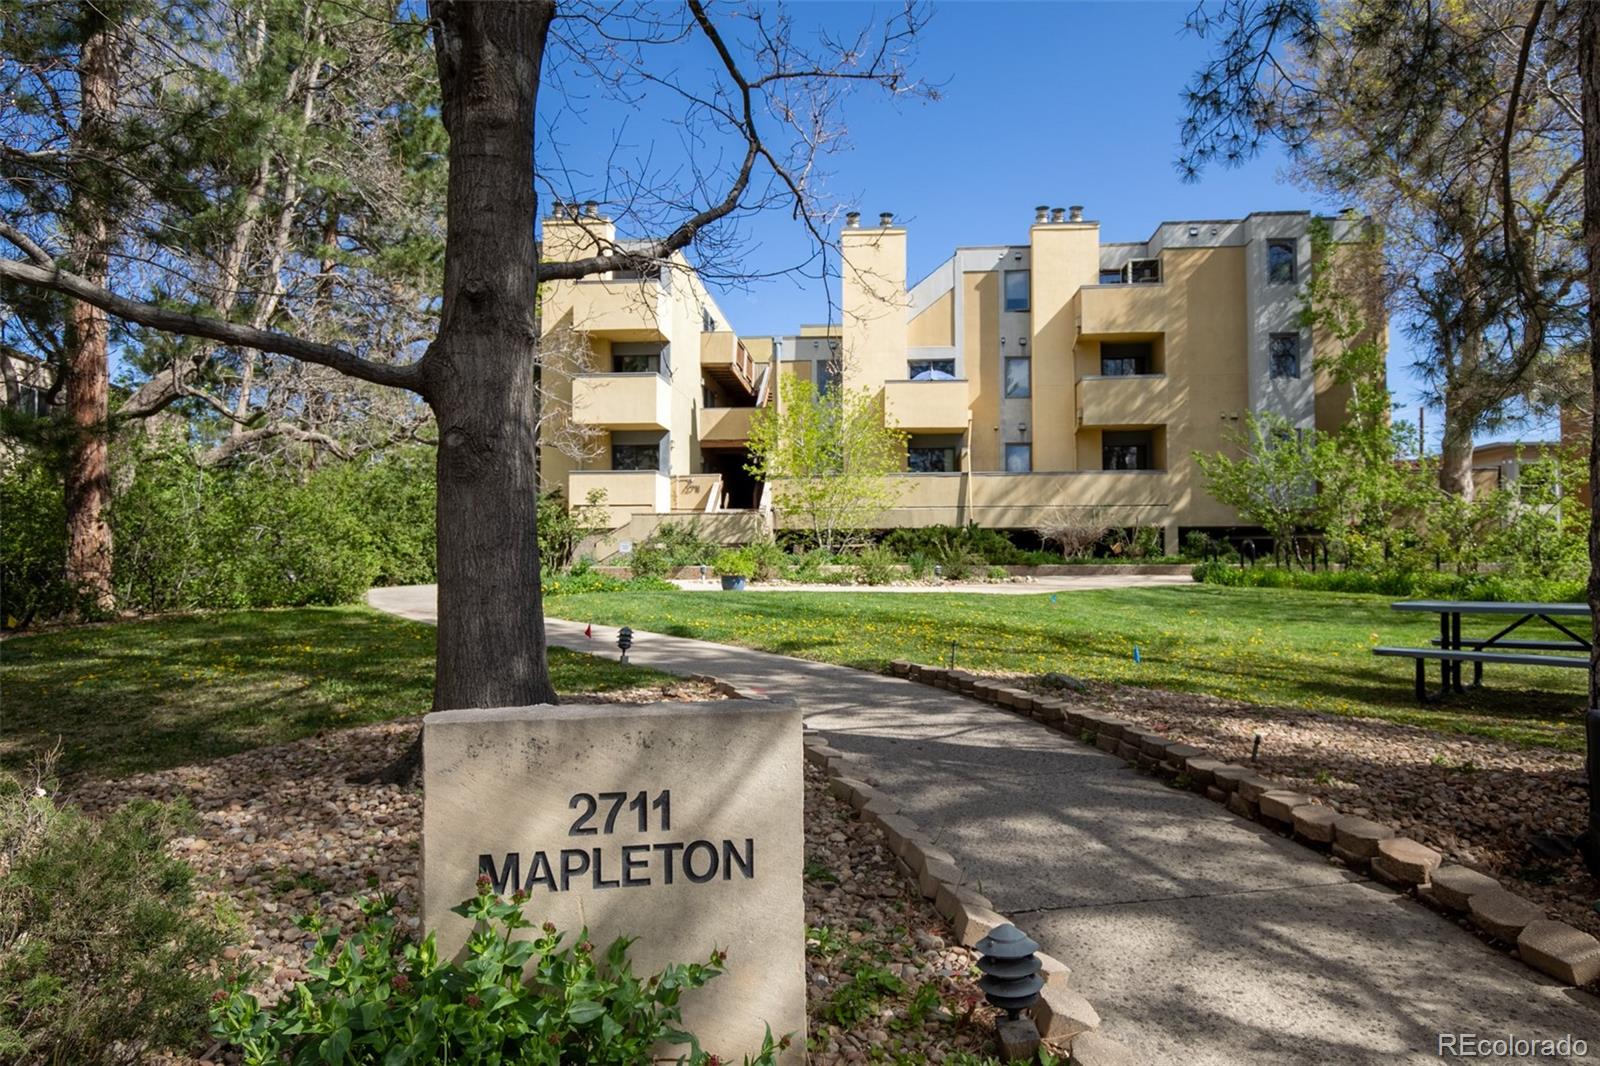
Active
$335,000
1
bds
|
1
ba
|
400
sqft
|
built
1983
2711 Mapleton Ave, Boulder, CO 80304
$-877
Cash flow
-13.7%
Cash-on-Cash Return
2.5%
Cap rate
0.5%
Rent to Value Ratio
Active
$1,070,000
5
bds
|
4
ba
|
3,290
sqft
|
built
1997
2066 Ridgeview Way, Longmont, CO 80504
$-3,044
Cash flow
-14.8%
Cash-on-Cash Return
2.3%
Cap rate
0.3%
Rent to Value Ratio
Active
$874,000
2
bds
|
2
ba
|
1,280
sqft
|
built
1984
2444 9th St, Boulder, CO 80304
$-2,562
Cash flow
-15.3%
Cash-on-Cash Return
2.2%
Cap rate
0.4%
Rent to Value Ratio
Active
$2,600,000
4
bds
|
4
ba
|
4,281
sqft
|
built
1974
560 Northstar Ct, Boulder, CO 80304
$-9,379
Cash flow
-18.8%
Cash-on-Cash Return
1.4%
Cap rate
0.2%
Rent to Value Ratio
Active
$960,000
4
bds
|
3
ba
|
2,657
sqft
|
built
1967
4667 Ashfield Dr, Boulder, CO 80301
$-2,257
Cash flow
-12.3%
Cash-on-Cash Return
2.9%
Cap rate
0.4%
Rent to Value Ratio
Active
$609,000
3
bds
|
2
ba
|
1,044
sqft
|
built
1976
4350 Monroe Dr, Boulder, CO 80303
$-1,912
Cash flow
-16.4%
Cash-on-Cash Return
1.9%
Cap rate
0.4%
Rent to Value Ratio
Active
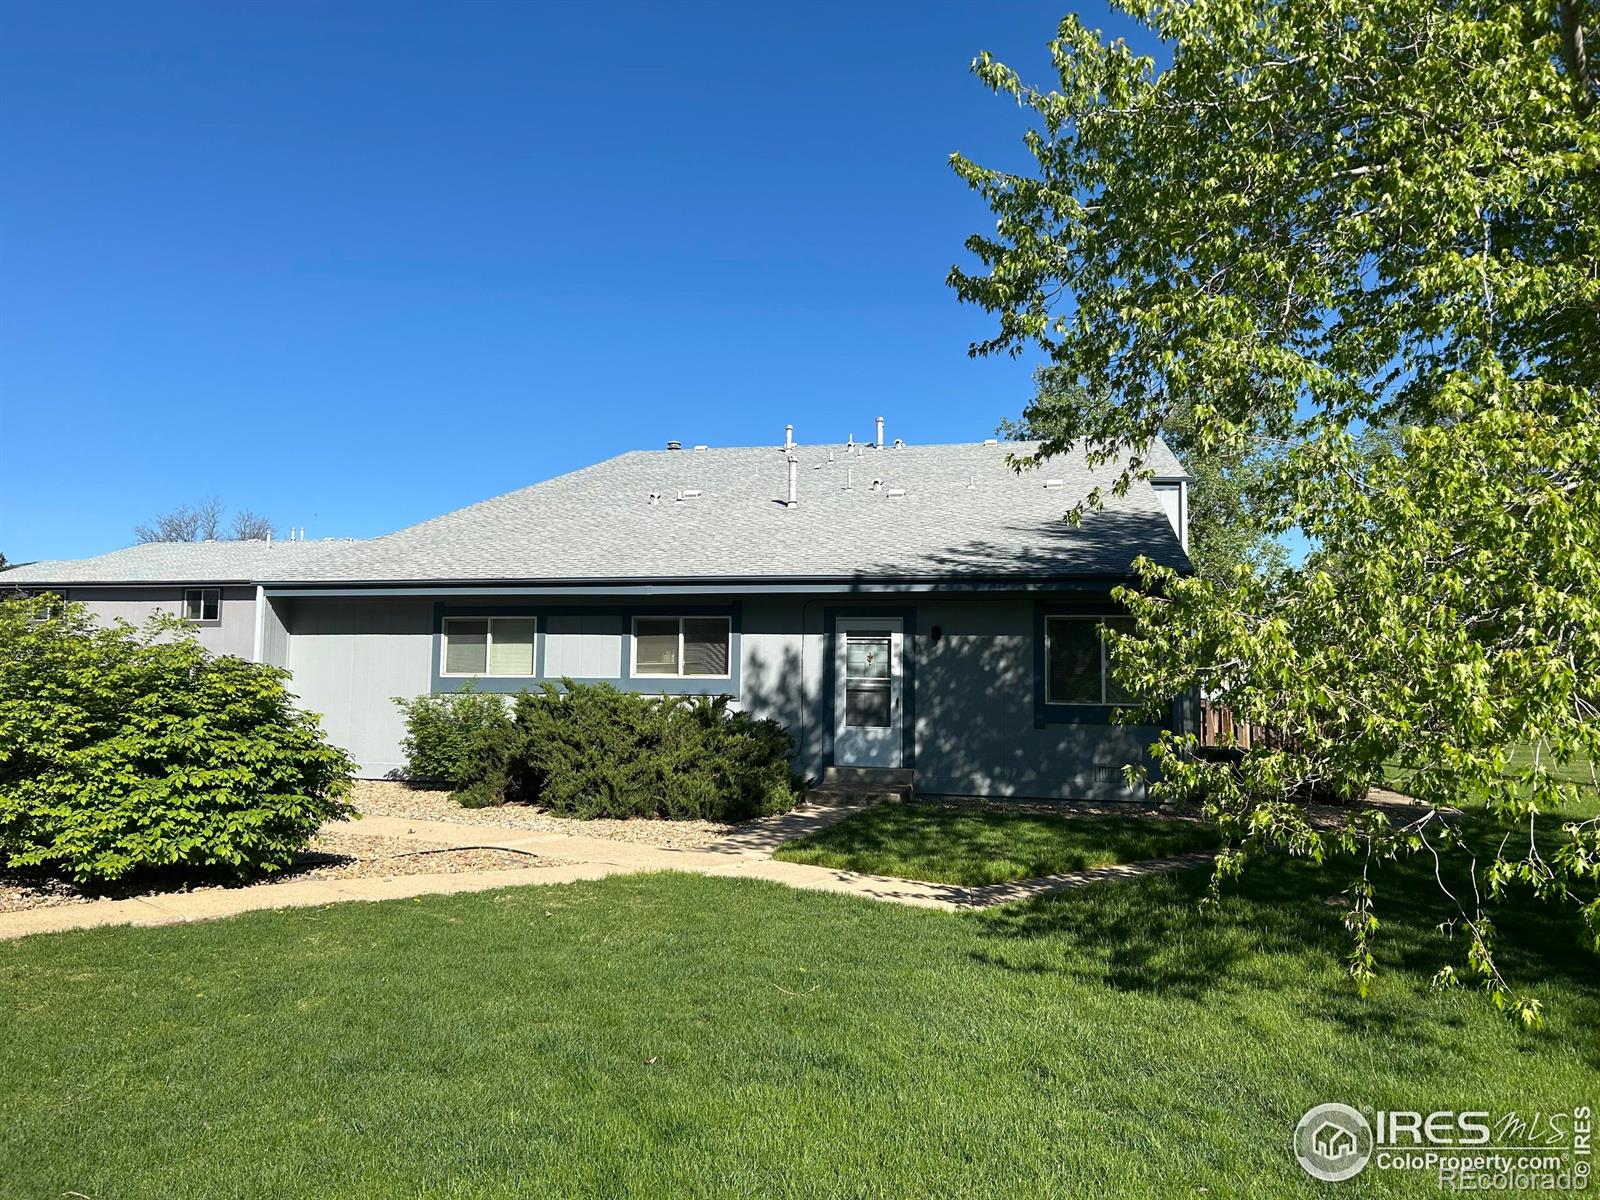
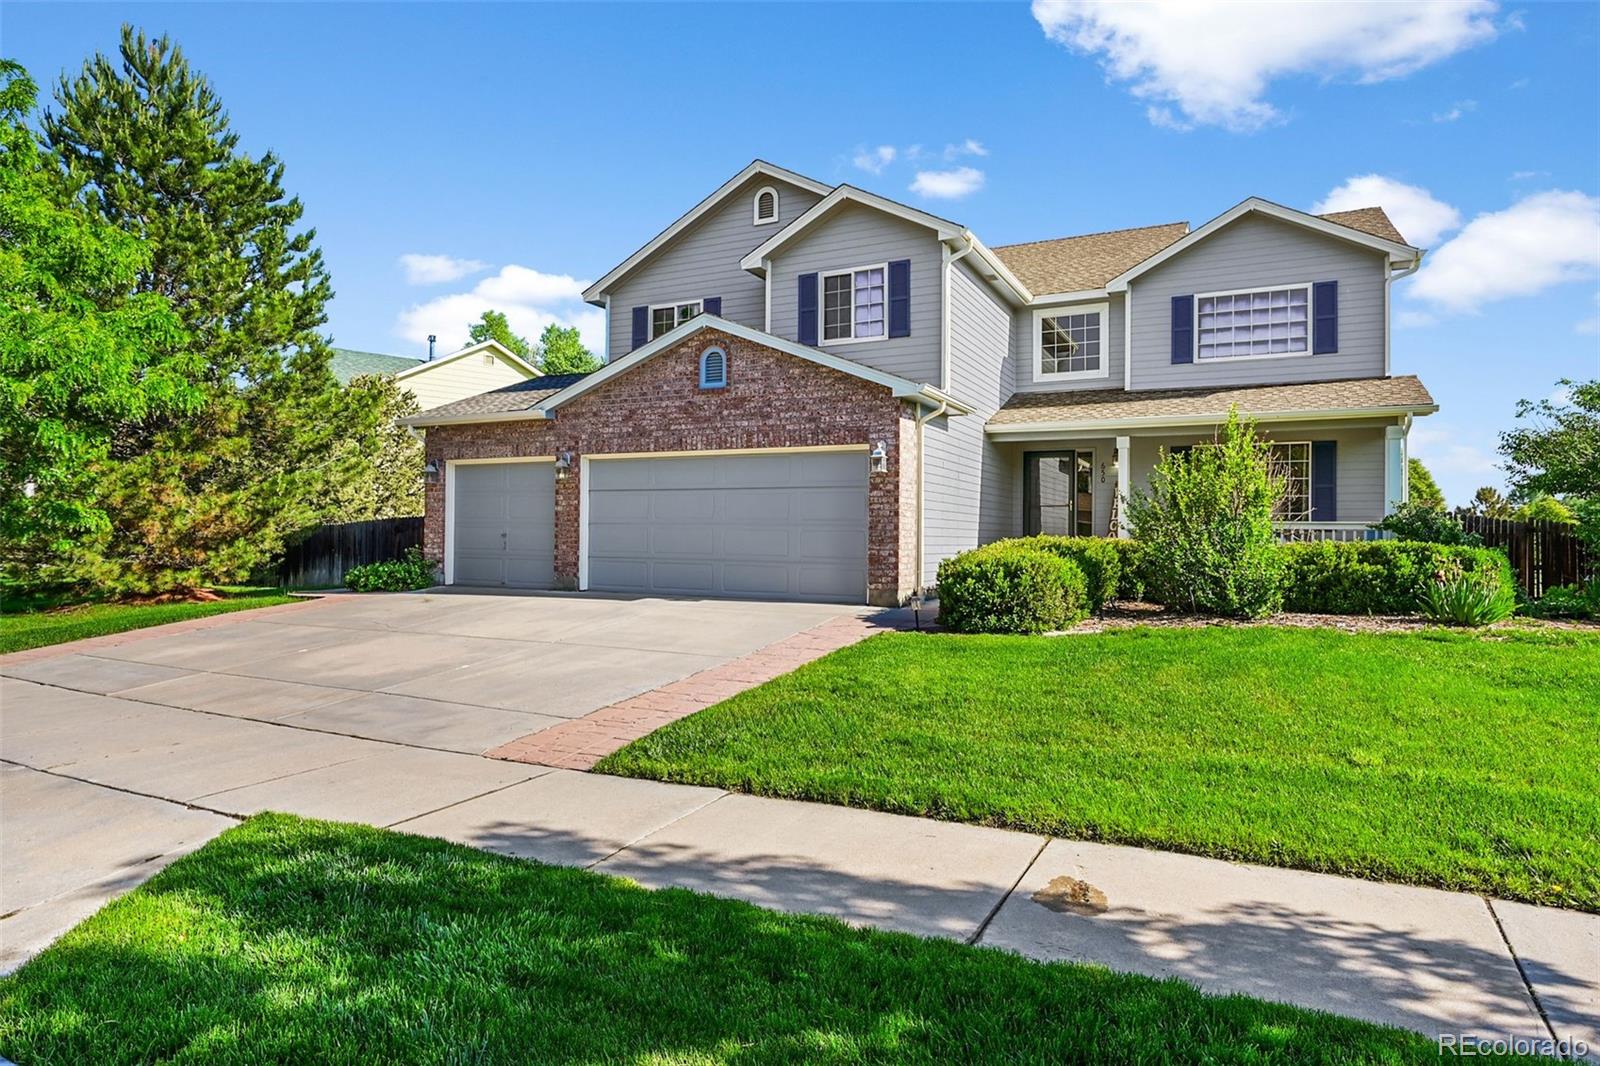
$740,000
3
bds
|
3
ba
|
2,610
sqft
|
built
2001
650 Olympia Ave, Longmont, CO 80504
$-1,726
Cash flow
-12.2%
Cash-on-Cash Return
2.9%
Cap rate
0.4%
Rent to Value Ratio
Active
$4,250,000
5
bds
|
4
ba
|
5,113
sqft
|
built
1978
503 Kalmia Ave, Boulder, CO 80304
$-16,256
Cash flow
-20.0%
Cash-on-Cash Return
1.1%
Cap rate
0.2%
Rent to Value Ratio
Active
$949,700
4
bds
|
3
ba
|
2,074
sqft
|
built
1975
4924 Clubhouse Ct, Boulder, CO 80301
$-2,531
Cash flow
-13.9%
Cash-on-Cash Return
2.5%
Cap rate
0.4%
Rent to Value Ratio
Active
$1,150,000
5
bds
|
4
ba
|
3,430
sqft
|
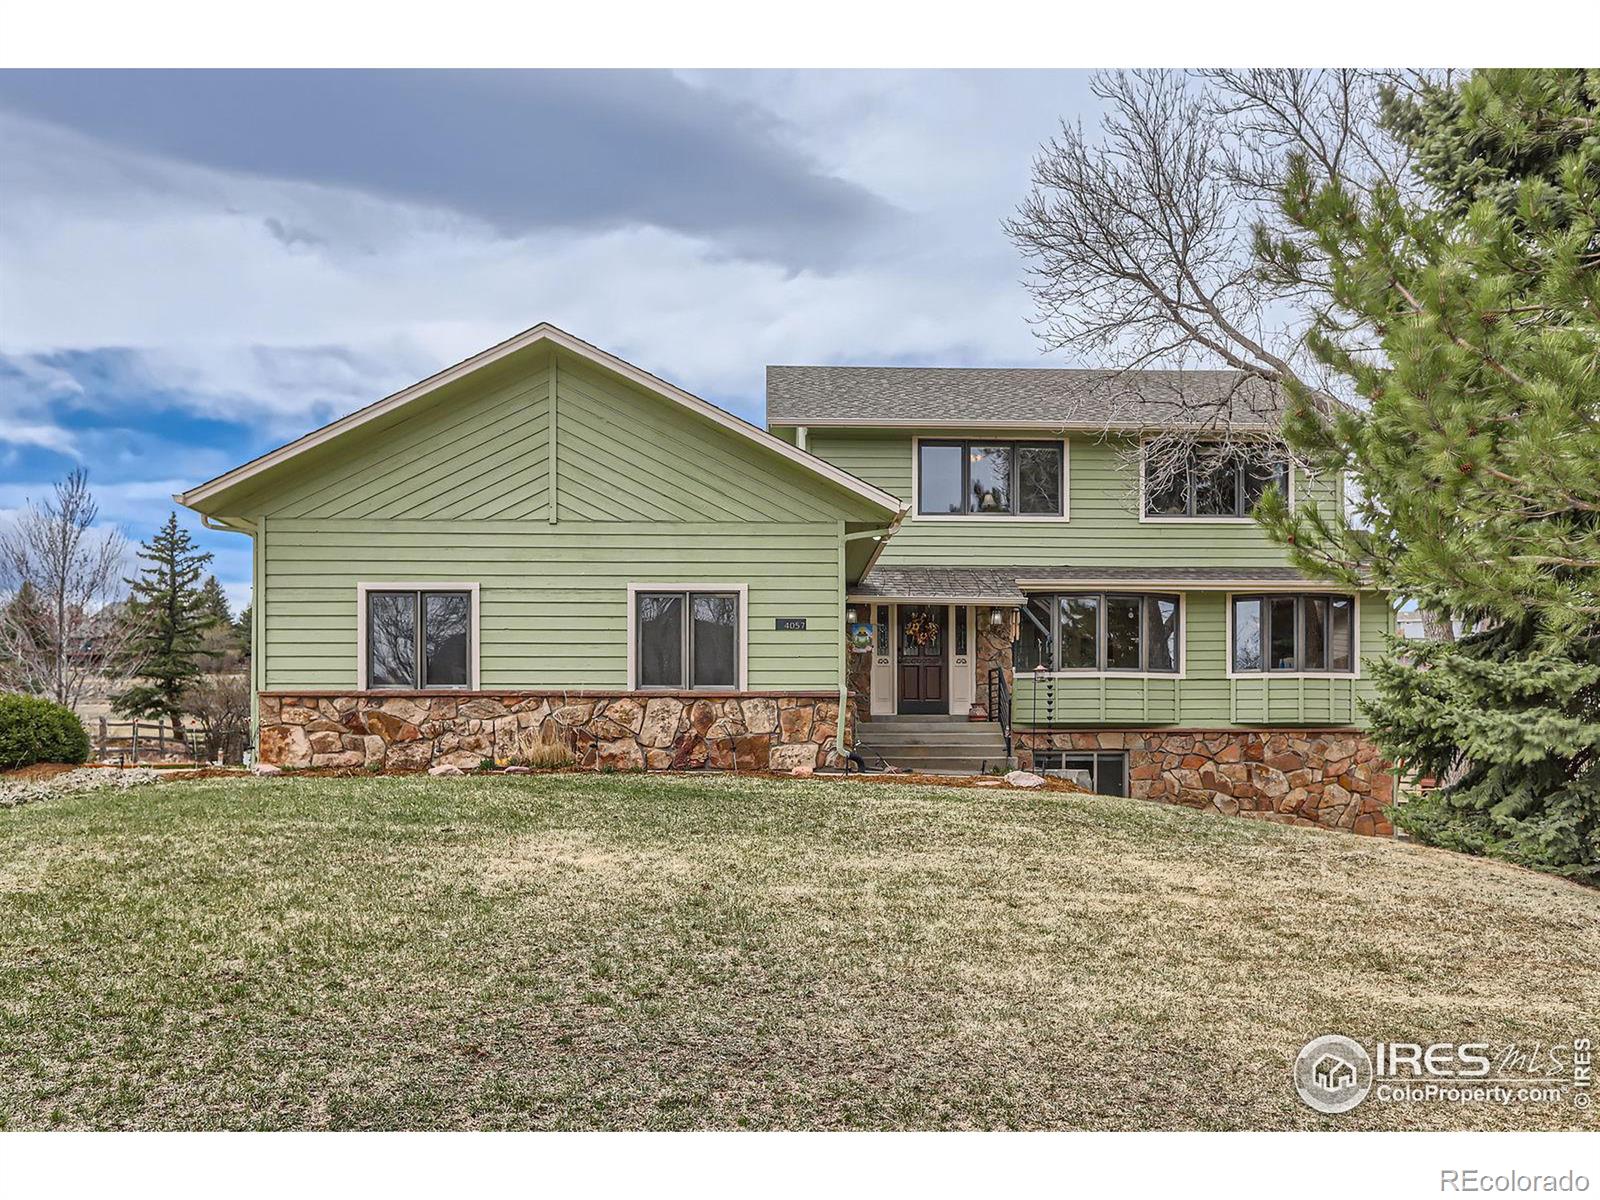
built
1987
4057 Niblick Dr, Longmont, CO 80503
$-3,113
Cash flow
-14.1%
Cash-on-Cash Return
2.4%
Cap rate
0.4%
Rent to Value Ratio
Active
$2,425,000
5
bds
|
5
ba
|
3,048
sqft
|
built
1925
1727 Mapleton Ave, Boulder, CO 80304
$-9,238
Cash flow
-19.9%
Cash-on-Cash Return
1.1%
Cap rate
0.2%
Rent to Value Ratio
Active
$825,000
3
bds
|
2
ba
|
2,164
sqft
|
built
1993
398 Fred Rd, Boulder, CO 80302
$-1,914
Cash flow
-12.1%
Cash-on-Cash Return
2.9%
Cap rate
0.4%
Rent to Value Ratio
Active
$3,450,000
4
bds
|
5
ba
|
4,742
sqft
|
built
1958
512 Ponderosa Dr, Boulder, CO 80303
$-14,438
Cash flow
-21.8%
Cash-on-Cash Return
0.7%
Cap rate
0.1%
Rent to Value Ratio
Active
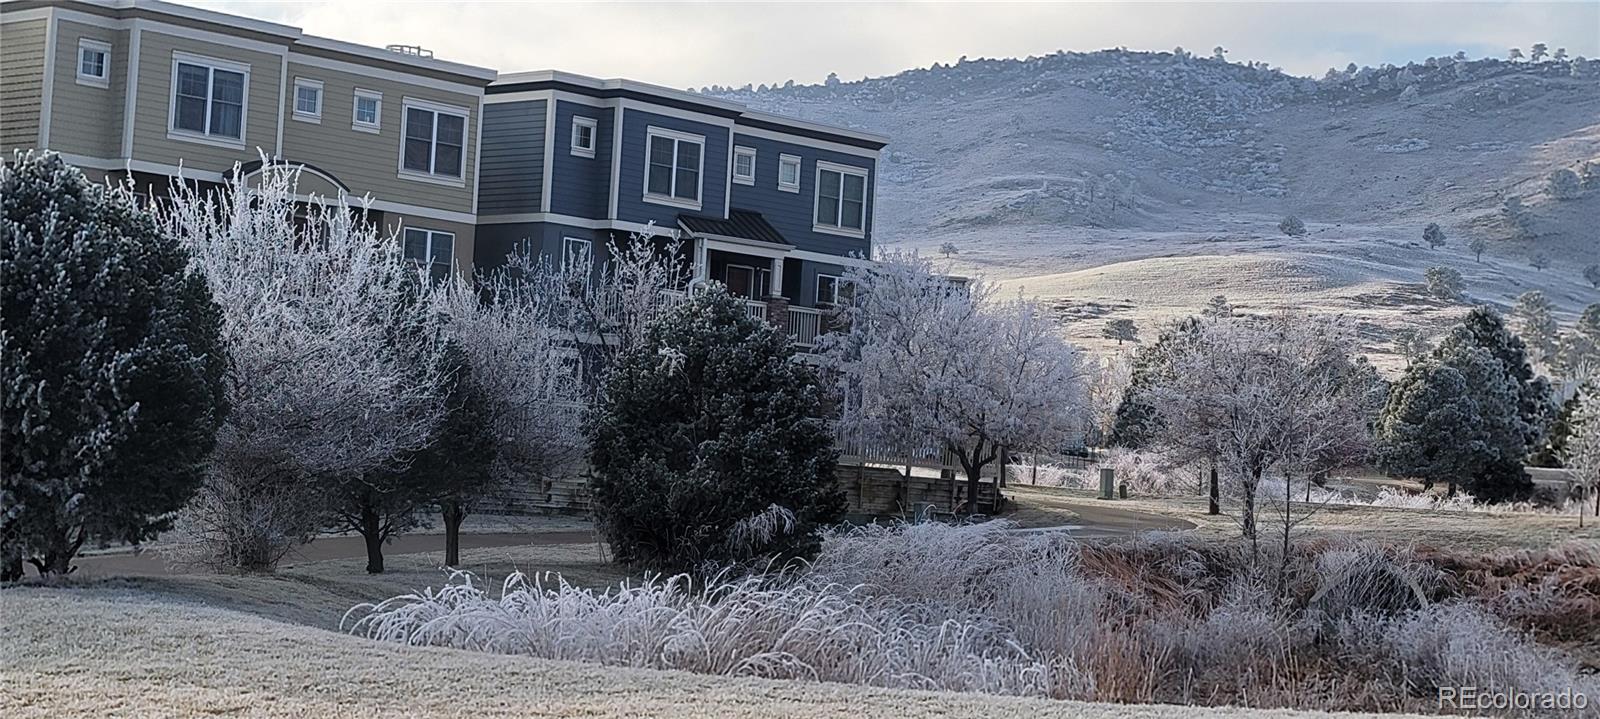
$500,000
2
bds
|
2
ba
|
1,286
sqft
|
built
1996
1747 High Plains Ct, Superior, CO 80027
$-1,288
Cash flow
-13.4%
Cash-on-Cash Return
2.6%
Cap rate
0.5%
Rent to Value Ratio
Active
$425,000
2
bds
|
2
ba
|
1,224
sqft
|
built
1996
2092 Concord Ln, Superior, CO 80027
$-1,008
Cash flow
-12.4%
Cash-on-Cash Return
2.8%
Cap rate
0.5%
Rent to Value Ratio
Active
$1,345,000
4
bds
|
4
ba
|
4,082
sqft
|
built
1983
133 Mine Ln, Boulder, CO 80302
$-2,650
Cash flow
-10.3%
Cash-on-Cash Return
3.3%
Cap rate
0.5%
Rent to Value Ratio

Active
$545,000
2
bds
|
3
ba
|
1,509
sqft
|
built
1999
2855 Rock Creek Cir, Superior, CO 80027
$-1,318
Cash flow
-12.6%
Cash-on-Cash Return
2.8%
Cap rate
0.5%
Rent to Value Ratio
Active under contract
$485,500
3
bds
|
2
ba
|
1,440
sqft
|
built
1979
1085 Malory St, Lafayette, CO 80026
$-601
Cash flow
-6.5%
Cash-on-Cash Return
4.2%
Cap rate
0.6%
Rent to Value Ratio