New London County Investment Properties for Sale
Browse homes for sale and investment properties in New London County. Refine your search by price, property type, or more.
Best cash flowing properties in New London County
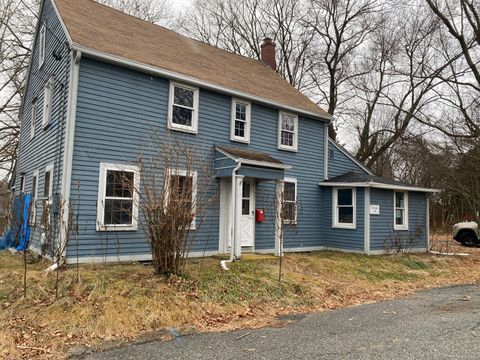
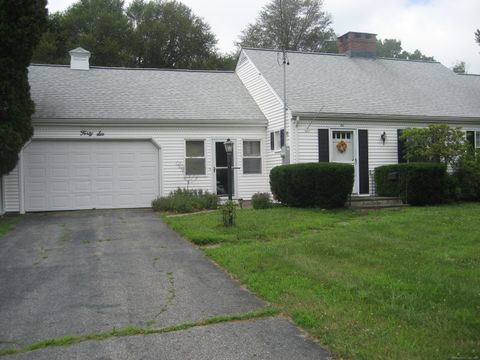
Active
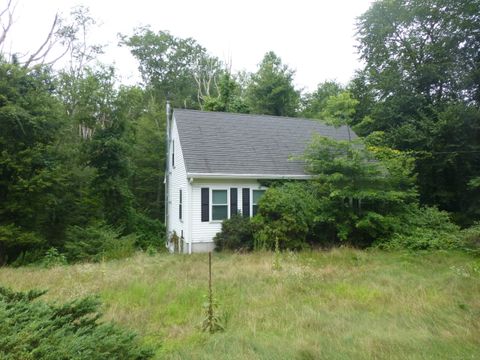
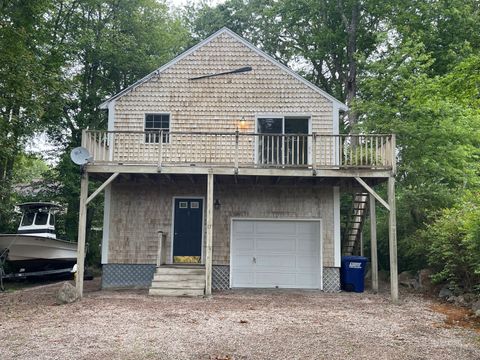
$125,000
2
bds
|
2
ba
|
1,350
sqft
|
built
1998
3 Kenyon Rd, Lisbon, CT 06351
$783
Cash flow
32.7%
Cash-on-Cash Return
13.2%
Cap rate
2.0%
Rent to Value Ratio
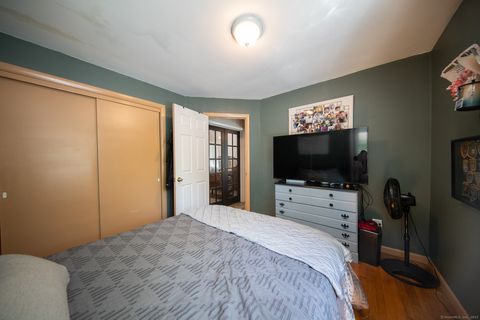
Active
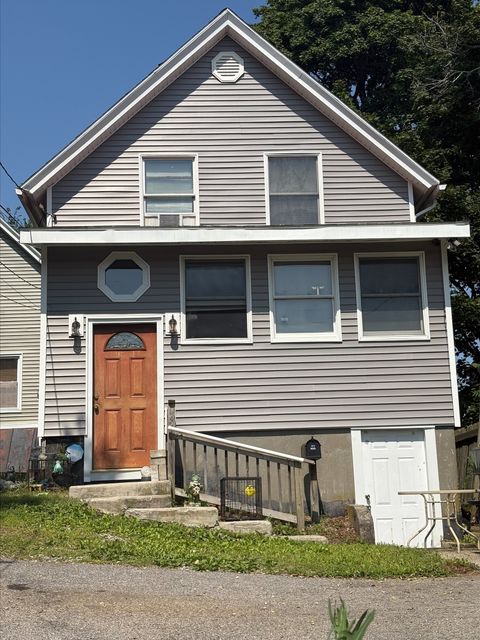
$209,000
3
bds
|
1
ba
|
952
sqft
|
built
1865
38 Mountain Ave, New London, CT 06320
$281
Cash flow
7.0%
Cash-on-Cash Return
7.3%
Cap rate
1.1%
Rent to Value Ratio
164 out of 238 properties for sale in New London County
Limited Results Shown
Create a free account, or log in to reveal all property listings and enjoy the complete experience.
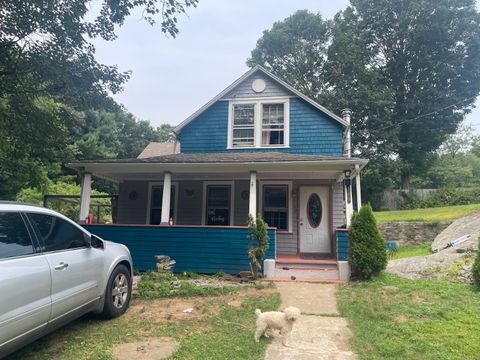
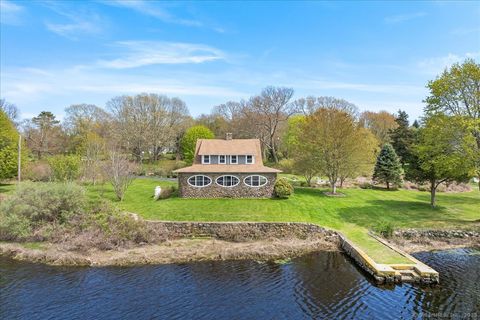
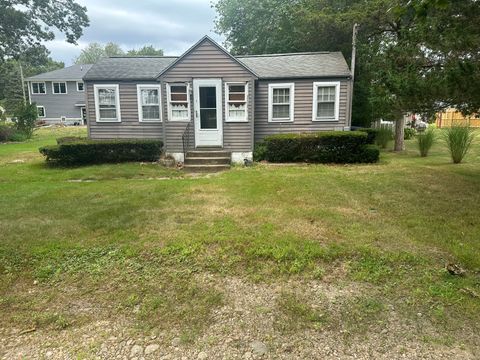
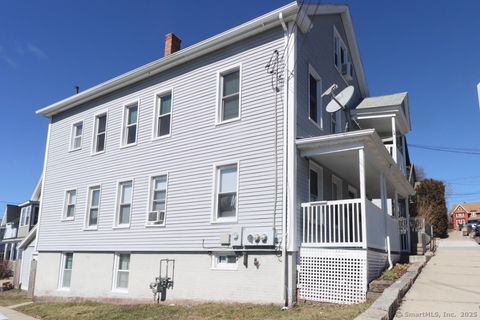
Active
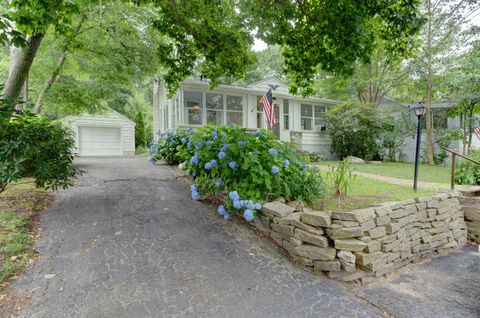
$350,000
2
bds
|
1
ba
|
720
sqft
|
built
1945
285 Deepwood Dr, Lebanon, CT 06249
$-412
Cash flow
-6.1%
Cash-on-Cash Return
4.3%
Cap rate
0.7%
Rent to Value Ratio
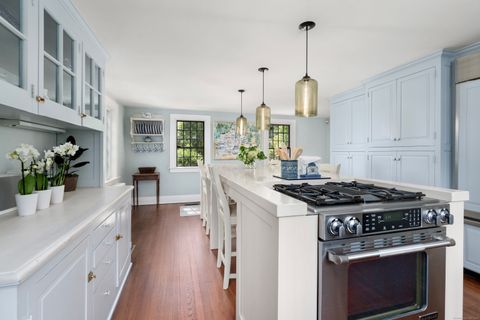
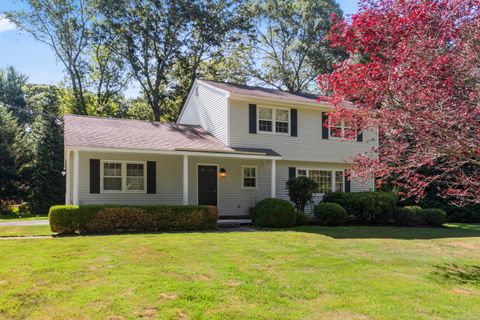
Active
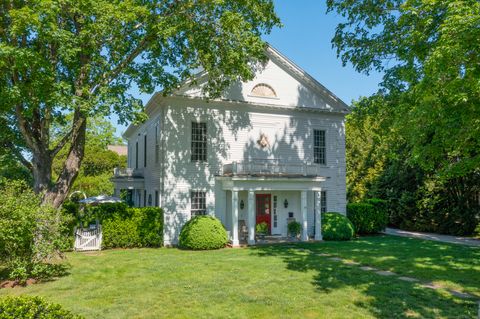
$1,650,000
4
bds
|
3
ba
|
3,781
sqft
|
built
1850
20 Lyme St, Old Lyme, CT 06371
$-5,451
Cash flow
-17.2%
Cash-on-Cash Return
1.7%
Cap rate
0.3%
Rent to Value Ratio
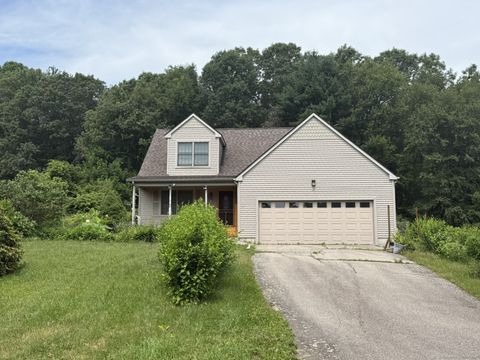
Active
$499,999
1
bds
|
2
ba
|
937
sqft
|
built
2001
17 Langworthy Ave, Stonington, CT 06378
$-986
Cash flow
-10.3%
Cash-on-Cash Return
3.3%
Cap rate
0.6%
Rent to Value Ratio
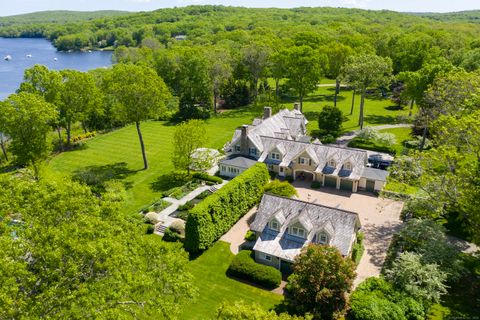
Active
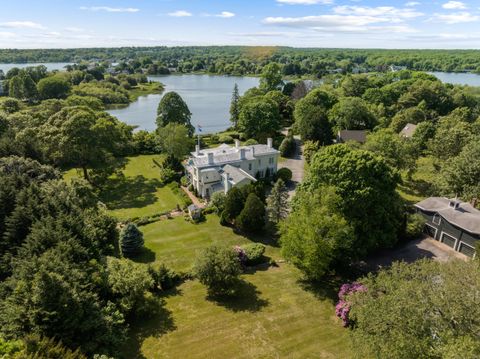
$3,395,000
5
bds
|
6
ba
|
4,956
sqft
|
built
1750
117 Elys Ferry Rd, Lyme, CT 06371
$-10,777
Cash flow
-16.6%
Cash-on-Cash Return
1.9%
Cap rate
0.3%
Rent to Value Ratio
Active
$11,750,000
5
bds
|
8
ba
|
9,489
sqft
|
built
2003
109 Elys Ferry Rd, Lyme, CT 06371
$-56,267
Cash flow
-25.0%
Cash-on-Cash Return
-0.1%
Cap rate
0.0%
Rent to Value Ratio
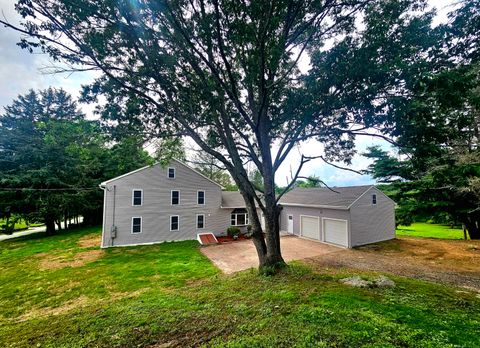
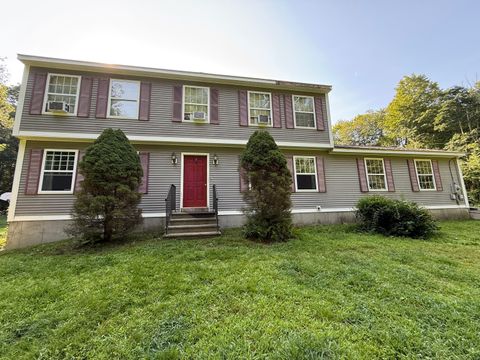
Active
$594,900
4
bds
|
3
ba
|
3,204
sqft
|
built
1705
203 Old Jewett City Rd, Preston, CT 06365
$-1,568
Cash flow
-13.8%
Cash-on-Cash Return
2.5%
Cap rate
0.4%
Rent to Value Ratio
Active
$220,000
3
bds
|
1
ba
|
1,949
sqft
|
built
1925
189 Maple St, Norwich, CT 06360
$195
Cash flow
4.6%
Cash-on-Cash Return
6.7%
Cap rate
1.1%
Rent to Value Ratio
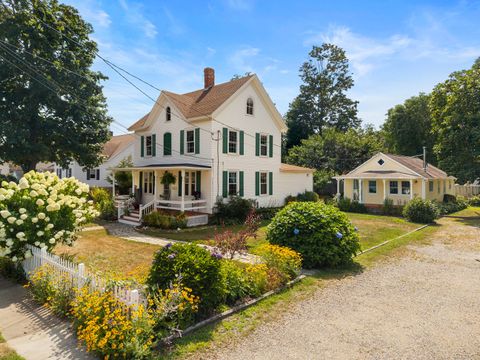
Active
$799,000
3
bds
|
2
ba
|
2,036
sqft
|
built
1905
22 York Ave, Niantic, CT 06357
$-2,575
Cash flow
-16.8%
Cash-on-Cash Return
1.8%
Cap rate
0.3%
Rent to Value Ratio
Active
$409,999
3
bds
|
3
ba
|
1,686
sqft
|
built
1955
675 Colonel Ledyard Hwy, Ledyard, CT 06339
$-316
Cash flow
-4.0%
Cash-on-Cash Return
4.8%
Cap rate
0.8%
Rent to Value Ratio
Active
$399,900
3
bds
|
2
ba
|
1,960
sqft
|
built
1999
146 Clubhouse Rd, Lebanon, CT 06249
$-197
Cash flow
-2.6%
Cash-on-Cash Return
5.1%
Cap rate
0.8%
Rent to Value Ratio
Active
$1,199,000
3
bds
|
3
ba
|
1,592
sqft
|
built
1925
28 Palmer Neck Rd, Pawcatuck, CT 06379
$-4,286
Cash flow
-18.7%
Cash-on-Cash Return
1.4%
Cap rate
0.3%
Rent to Value Ratio
Active
$320,000
2
bds
|
1
ba
|
684
sqft
|
built
1950
7 Katherine Rd, Old Lyme, CT 06371
$-229
Cash flow
-3.7%
Cash-on-Cash Return
4.8%
Cap rate
0.7%
Rent to Value Ratio
Active
$609,000
4
bds
|
2
ba
|
2,033
sqft
|
built
1966
231 Mile Creek Rd, Old Lyme, CT 06371
$-1,173
Cash flow
-10.0%
Cash-on-Cash Return
3.4%
Cap rate
0.5%
Rent to Value Ratio
Active
$459,000
4
bds
|
4
ba
|
2,076
sqft
|
built
2003
57 Roselund Hill Rd, Uncasville, CT 06382
$-299
Cash flow
-3.4%
Cash-on-Cash Return
4.9%
Cap rate
0.8%
Rent to Value Ratio
Active
$559,900
4
bds
|
2
ba
|
2,256
sqft
|
built
1938
15 Paster Rd, Preston, CT 06365
$-1,087
Cash flow
-10.1%
Cash-on-Cash Return
3.3%
Cap rate
0.5%
Rent to Value Ratio

Active
$249,999
3
bds
|
2
ba
|
1,037
sqft
|
built
1918
180 Central Ave, Norwich, CT 06360
$-119
Cash flow
-2.5%
Cash-on-Cash Return
5.1%
Cap rate
0.8%
Rent to Value Ratio
Active
$2,750,000
3
bds
|
3
ba
|
2,619
sqft
|
built
1885
92 Water St, Stonington, CT 06378
$-8,364
Cash flow
-15.9%
Cash-on-Cash Return
2.0%
Cap rate
0.4%
Rent to Value Ratio
Active
$2,850,000
3
bds
|
1
ba
|
1,754
sqft
|
built
1932
12 North St, Stonington, CT 06378
$-11,920
Cash flow
-21.8%
Cash-on-Cash Return
0.7%
Cap rate
0.2%
Rent to Value Ratio

Active
$645,000
3
bds
|
2
ba
|
1,408
sqft
|
built
1963
38 Rossie St, Mystic, CT 06355
$-1,136
Cash flow
-9.2%
Cash-on-Cash Return
3.6%
Cap rate
0.6%
Rent to Value Ratio
Active
$249,900
4
bds
|
2
ba
|
1,664
sqft
|
built
1920
746 Boswell Ave, Norwich, CT 06360
$-522
Cash flow
-10.9%
Cash-on-Cash Return
3.2%
Cap rate
0.6%
Rent to Value Ratio
Active
$1,300,000
2
bds
|
2
ba
|
1,949
sqft
|
built
1896
9 Columbus Ave, Niantic, CT 06357
$-4,132
Cash flow
-16.6%
Cash-on-Cash Return
1.9%
Cap rate
0.3%
Rent to Value Ratio
Active
$3,495,000
7
bds
|
7
ba
|
7,060
sqft
|
built
1857
259 N Main St, Stonington, CT 06378
$-15,771
Cash flow
-23.5%
Cash-on-Cash Return
0.3%
Cap rate
0.1%
Rent to Value Ratio
Active
$876,500
4
bds
|
4
ba
|
4,257
sqft
|
built
1989
34 Willow Ln, East Lyme, CT 06333
$-2,563
Cash flow
-15.3%
Cash-on-Cash Return
2.2%
Cap rate
0.5%
Rent to Value Ratio
Active
$220,000
3
bds
|
2
ba
|
1,939
sqft
|
built
1772
6 Lee Ave, Norwich, CT 06360
$-147
Cash flow
-3.5%
Cash-on-Cash Return
4.9%
Cap rate
0.9%
Rent to Value Ratio
Active
$949,000
2
bds
|
2
ba
|
1,345
sqft
|
built
2023
60 Willow St, Mystic, CT 06355
$-2,780
Cash flow
-15.3%
Cash-on-Cash Return
2.2%
Cap rate
0.5%
Rent to Value Ratio
Active
$579,000
3
bds
|
3
ba
|
1,942
sqft
|
built
2002
75 Heather Glen Ln, Mystic, CT 06355
$-916
Cash flow
-8.3%
Cash-on-Cash Return
3.8%
Cap rate
0.6%
Rent to Value Ratio

Active
$850,000
6
bds
|
4
ba
|
2,133
sqft
|
built
1901
218 N Water St, Stonington, CT 06378
$-803
Cash flow
-4.9%
Cash-on-Cash Return
4.5%
Cap rate
0.6%
Rent to Value Ratio
Active
$399,000
3
bds
|
3
ba
|
2,212
sqft
|
built
2005
136 Meridian St, Groton, CT 06340
$-678
Cash flow
-8.9%
Cash-on-Cash Return
3.6%
Cap rate
0.7%
Rent to Value Ratio

Active
$275,000
2
bds
|
2
ba
|
1,300
sqft
|
built
1997
5 Mountain Laurel Rdg, Uncasville, CT 06382
$-615
Cash flow
-11.7%
Cash-on-Cash Return
3.0%
Cap rate
0.9%
Rent to Value Ratio
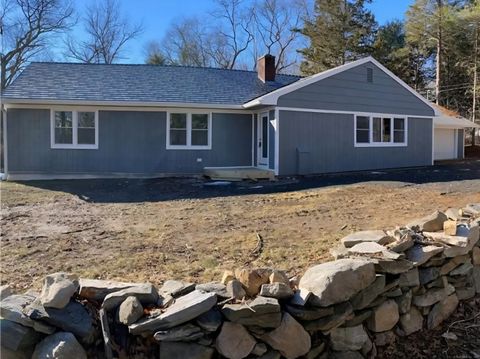
Active
$355,000
3
bds
|
2
ba
|
1,050
sqft
|
built
1986
209 Old Colchester Rd, Salem, CT 06420
$-331
Cash flow
-4.9%
Cash-on-Cash Return
4.6%
Cap rate
0.7%
Rent to Value Ratio
Active
$349,900
2
bds
|
1
ba
|
840
sqft
|
built
1955
25 Woodland Dr, Lebanon, CT 06249
$-110
Cash flow
-1.6%
Cash-on-Cash Return
5.3%
Cap rate
0.7%
Rent to Value Ratio

Active
$350,000
3
bds
|
1
ba
|
1,491
sqft
|
built
1955
3 George Ave, Groton, CT 06340
$-286
Cash flow
-4.3%
Cash-on-Cash Return
4.7%
Cap rate
0.7%
Rent to Value Ratio
Active
$525,000
3
bds
|
2
ba
|
1,936
sqft
|
built
1957
12 Josan Dr, Waterford, CT 06385
$-1,071
Cash flow
-10.6%
Cash-on-Cash Return
3.2%
Cap rate
0.5%
Rent to Value Ratio
Active
$349,500
2
bds
|
1
ba
|
1,379
sqft
|
built
1956
46 Wayne St, Norwich, CT 06360
$-440
Cash flow
-6.6%
Cash-on-Cash Return
4.2%
Cap rate
0.7%
Rent to Value Ratio
Active
$418,000
4
bds
|
3
ba
|
1,920
sqft
|
built
1900
32 Center St, New London, CT 06320
$-1,254
Cash flow
-15.7%
Cash-on-Cash Return
2.1%
Cap rate
0.4%
Rent to Value Ratio
Active
$7,700,000
5
bds
|
6
ba
|
4,544
sqft
|
built
1750
41 Joshua Ln, Lyme, CT 06371
$-34,912
Cash flow
-23.7%
Cash-on-Cash Return
0.2%
Cap rate
0.1%
Rent to Value Ratio
Active
$824,900
5
bds
|
3
ba
|
2,650
sqft
|
built
1940
321 N Anguilla Rd, Pawcatuck, CT 06379
$-2,018
Cash flow
-12.8%
Cash-on-Cash Return
2.7%
Cap rate
0.4%
Rent to Value Ratio

Active
$689,000
4
bds
|
3
ba
|
2,425
sqft
|
built
1987
270 N Bride Brook Rd, East Lyme, CT 06333
$-1,491
Cash flow
-11.3%
Cash-on-Cash Return
3.1%
Cap rate
0.5%
Rent to Value Ratio