Davenport, FL Investment Properties for Sale
Browse homes for sale and investment properties in Davenport, FL. Refine your search by price, property type, or more.
Best cash flowing properties in Davenport, FL
Active
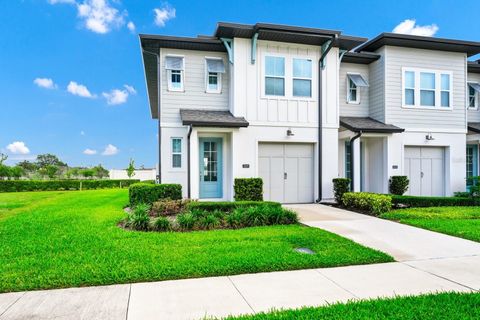
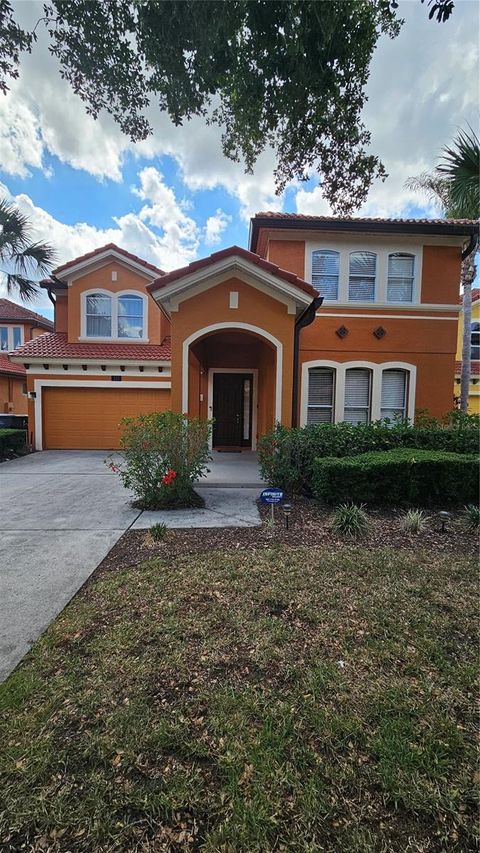
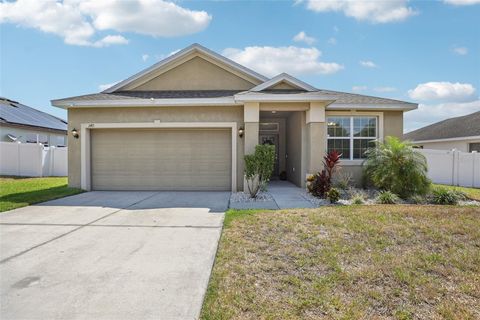
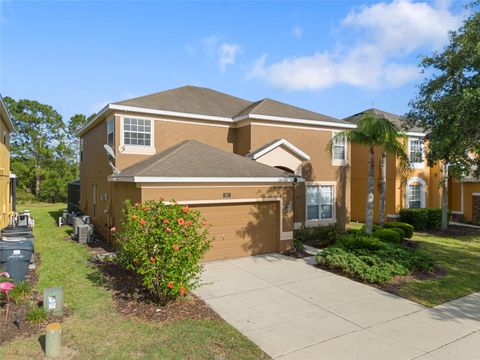
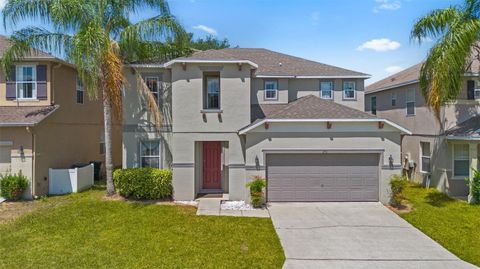
$334,900
4
bds
|
2
ba
|
1,760
sqft
|
built
2013
318 Highland Meadows Dr, Davenport, FL 33837
$-353
Cash flow
-5.5%
Cash-on-Cash Return
4.9%
Cap rate
0.7%
Rent to Value Ratio
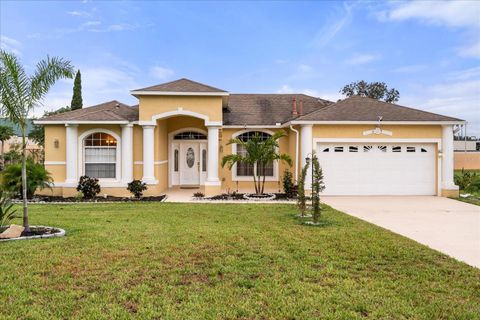
Active
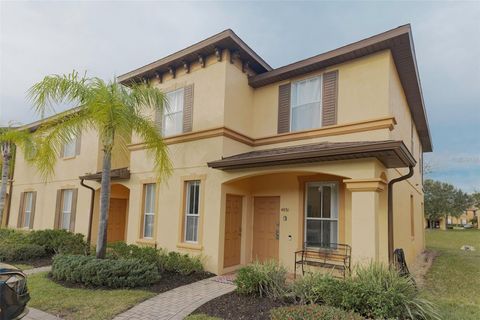
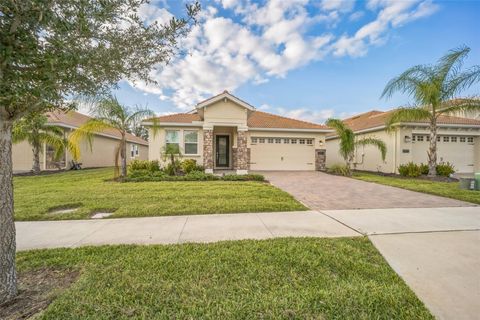
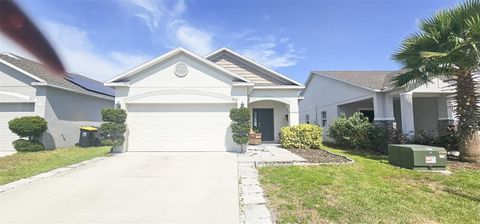
$325,000
3
bds
|
2
ba
|
1,625
sqft
|
built
2004
212 Ashford Dr, Davenport, FL 33837
$-381
Cash flow
-6.1%
Cash-on-Cash Return
4.7%
Cap rate
0.7%
Rent to Value Ratio
696 out of 703 properties for sale in Davenport, FL
Limited Results Shown
Create a free account, or log in to reveal all property listings and enjoy the complete experience.
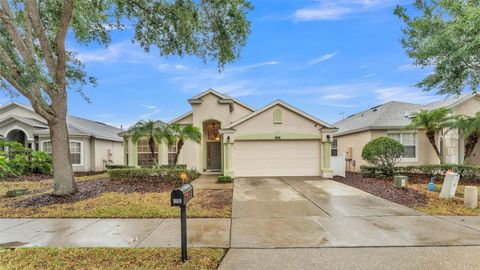
Active
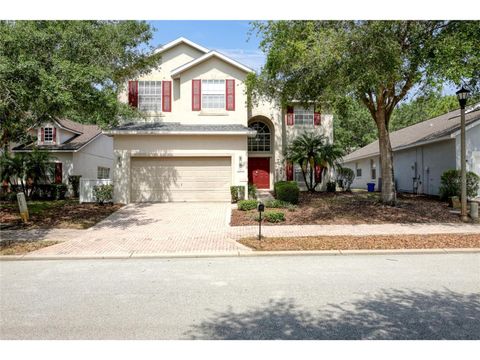
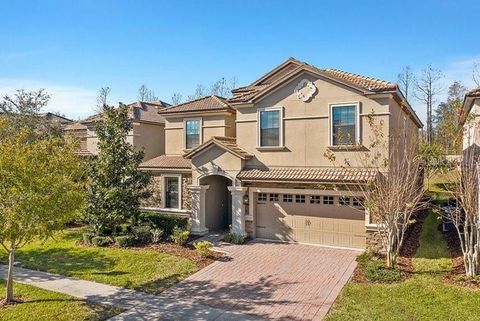
$629,000
7
bds
|
6
ba
|
3,632
sqft
|
built
2019
5273 Oakbourne Ave, Davenport, FL 33837
$-1,642
Cash flow
-13.6%
Cash-on-Cash Return
3.0%
Cap rate
0.7%
Rent to Value Ratio
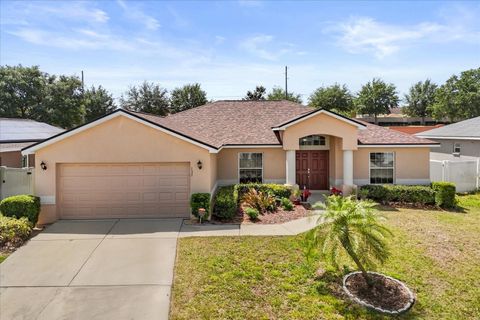
Active
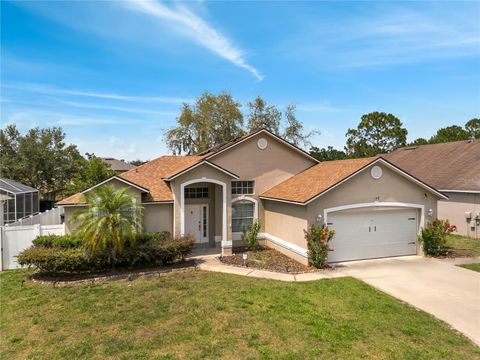
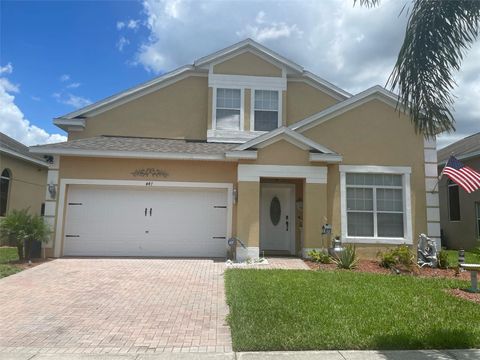
$330,000
3
bds
|
3
ba
|
1,534
sqft
|
built
1994
232 Oxford Rd, Davenport, FL 33896
$-500
Cash flow
-7.9%
Cash-on-Cash Return
4.3%
Cap rate
0.7%
Rent to Value Ratio
Active
$319,500
3
bds
|
3
ba
|
1,682
sqft
|
built
2020
809 Benoi Dr, Davenport, FL 33896
$-803
Cash flow
-13.1%
Cash-on-Cash Return
3.1%
Cap rate
0.7%
Rent to Value Ratio
Active
$305,000
4
bds
|
4
ba
|
1,856
sqft
|
built
2004
4031 Calabria Ave, Davenport, FL 33897
$-731
Cash flow
-12.5%
Cash-on-Cash Return
3.3%
Cap rate
0.8%
Rent to Value Ratio
Active
$580,999
6
bds
|
6
ba
|
3,410
sqft
|
built
2003
143 Windsor Pl, Davenport, FL 33896
$-1,530
Cash flow
-13.7%
Cash-on-Cash Return
3.0%
Cap rate
0.6%
Rent to Value Ratio
Active
$500,000
4
bds
|
2
ba
|
1,506
sqft
|
built
1996
149 Imperial Oak Ct, Davenport, FL 33896
$-1,063
Cash flow
-11.1%
Cash-on-Cash Return
3.6%
Cap rate
0.6%
Rent to Value Ratio
Active
$445,000
4
bds
|
4
ba
|
2,067
sqft
|
built
2007
153 Tigerlily Ct, Davenport, FL 33837
$-1,142
Cash flow
-13.4%
Cash-on-Cash Return
3.1%
Cap rate
0.7%
Rent to Value Ratio
Active
$460,000
4
bds
|
3
ba
|
2,029
sqft
|
built
1994
507 Westwind Dr, Davenport, FL 33896
$-869
Cash flow
-9.9%
Cash-on-Cash Return
3.9%
Cap rate
0.6%
Rent to Value Ratio
Active
$410,000
4
bds
|
3
ba
|
1,871
sqft
|
built
2005
506 Henley Cir, Davenport, FL 33896
$-1,028
Cash flow
-13.1%
Cash-on-Cash Return
3.1%
Cap rate
0.6%
Rent to Value Ratio
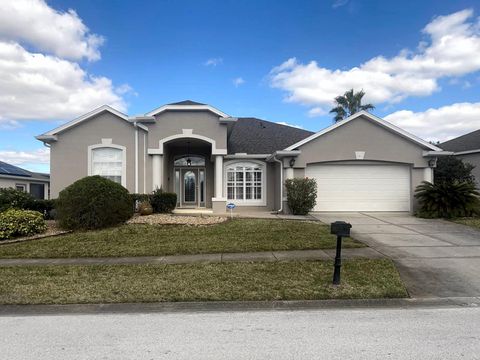
Active
$335,000
3
bds
|
2
ba
|
1,836
sqft
|
built
2014
131 Highland Meadows Pl, Davenport, FL 33837
$-679
Cash flow
-10.6%
Cash-on-Cash Return
3.7%
Cap rate
0.7%
Rent to Value Ratio
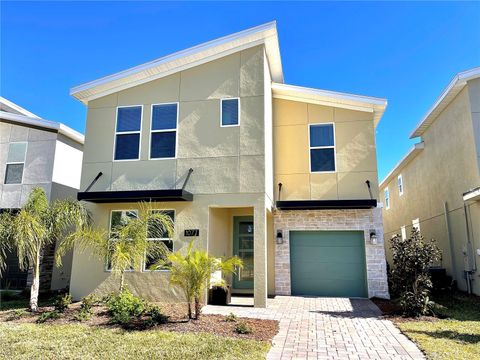
Active
$630,000
6
bds
|
5
ba
|
3,291
sqft
|
built
2021
1077 Leader St, Davenport, FL 33896
$-2,225
Cash flow
-18.4%
Cash-on-Cash Return
1.9%
Cap rate
0.6%
Rent to Value Ratio
Active
$539,000
5
bds
|
5
ba
|
2,114
sqft
|
built
2014
4416 Acorn Ct, Davenport, FL 33837
$-1,367
Cash flow
-13.2%
Cash-on-Cash Return
3.1%
Cap rate
0.6%
Rent to Value Ratio
Active
$479,990
4
bds
|
3
ba
|
3,028
sqft
|
built
2007
108 Whispering Pines Way, Davenport, FL 33837
$-1,117
Cash flow
-12.1%
Cash-on-Cash Return
3.4%
Cap rate
0.6%
Rent to Value Ratio
Active
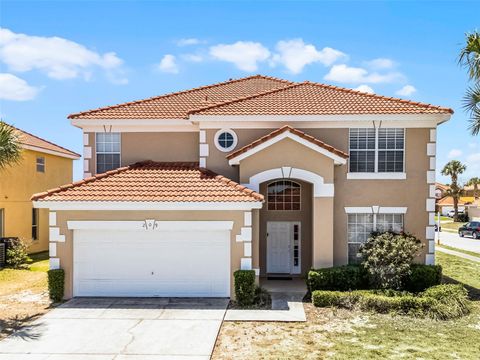
$424,900
5
bds
|
4
ba
|
2,345
sqft
|
built
2007
223 Cadiz Loop, Davenport, FL 33837
$-599
Cash flow
-7.4%
Cash-on-Cash Return
4.5%
Cap rate
0.7%
Rent to Value Ratio
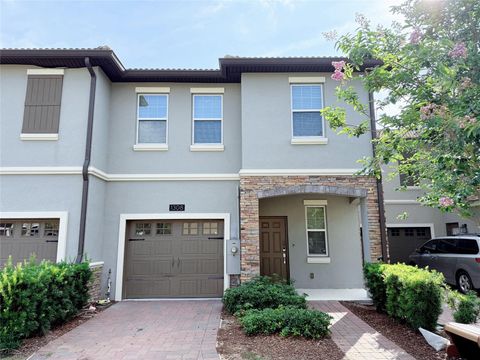
Active
$320,000
3
bds
|
3
ba
|
1,802
sqft
|
built
2020
1308 Shinnecock Hills Dr, Davenport, FL 33896
$-772
Cash flow
-12.6%
Cash-on-Cash Return
3.3%
Cap rate
0.8%
Rent to Value Ratio
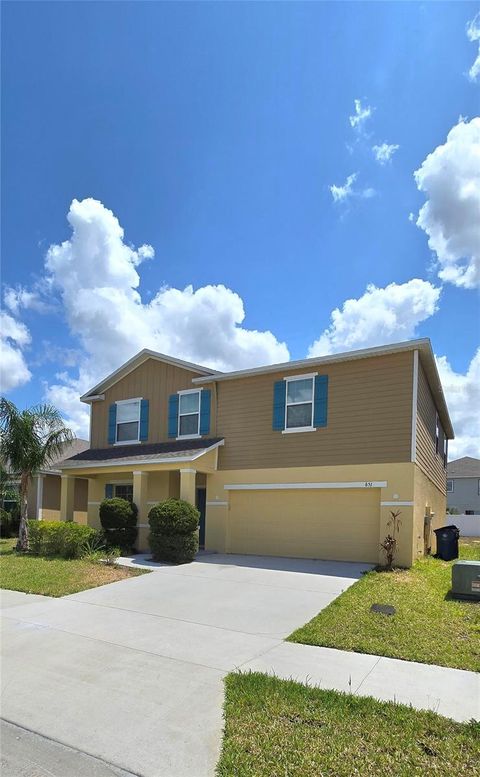
Active
$369,990
5
bds
|
3
ba
|
2,755
sqft
|
built
2021
651 Taft Dr, Davenport, FL 33837
$-770
Cash flow
-10.9%
Cash-on-Cash Return
3.6%
Cap rate
0.7%
Rent to Value Ratio
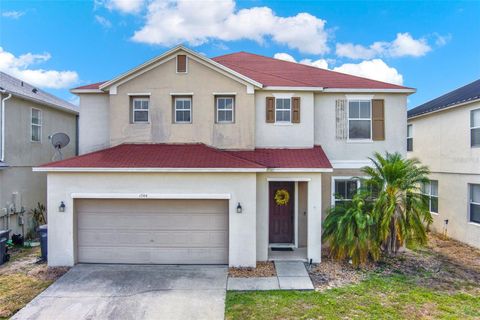
Active
$500,000
5
bds
|
5
ba
|
3,102
sqft
|
built
2004
1744 Pine Ridge Dr, Davenport, FL 33896
$-1,117
Cash flow
-11.7%
Cash-on-Cash Return
3.5%
Cap rate
0.6%
Rent to Value Ratio
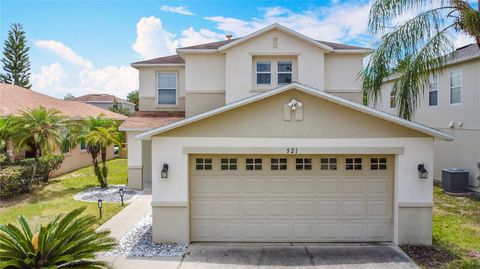
Active
$439,990
3
bds
|
3
ba
|
2,256
sqft
|
built
2004
521 Rena Dr, Davenport, FL 33897
$-721
Cash flow
-8.5%
Cash-on-Cash Return
4.2%
Cap rate
0.7%
Rent to Value Ratio
Active
$309,000
3
bds
|
2
ba
|
1,305
sqft
|
built
2014
140 Highland Meadows St, Davenport, FL 33837
$-680
Cash flow
-11.5%
Cash-on-Cash Return
3.5%
Cap rate
0.6%
Rent to Value Ratio
Active
$467,999
3
bds
|
2
ba
|
1,979
sqft
|
built
2021
8907 Fallen Oak Dr, Davenport, FL 33896
$-1,945
Cash flow
-21.7%
Cash-on-Cash Return
1.2%
Cap rate
0.6%
Rent to Value Ratio
Active
$1,100,000
9
bds
|
5
ba
|
3,909
sqft
|
built
2013
1466 Moon Valley Dr, Davenport, FL 33896
$-4,017
Cash flow
-19.1%
Cash-on-Cash Return
1.8%
Cap rate
0.4%
Rent to Value Ratio
Active
$429,900
5
bds
|
4
ba
|
2,345
sqft
|
built
2007
447 Cadiz Loop, Davenport, FL 33837
$-972
Cash flow
-11.8%
Cash-on-Cash Return
3.4%
Cap rate
0.6%
Rent to Value Ratio
Active
$434,000
4
bds
|
4
ba
|
2,554
sqft
|
built
2008
957 Orange Cosmos Blvd, Davenport, FL 33837
$-962
Cash flow
-11.6%
Cash-on-Cash Return
3.5%
Cap rate
0.7%
Rent to Value Ratio
Active
$329,990
3
bds
|
2
ba
|
1,280
sqft
|
built
2021
853 Bocavista Ct, Davenport, FL 33896
$-649
Cash flow
-10.3%
Cash-on-Cash Return
3.8%
Cap rate
0.6%
Rent to Value Ratio
Active
$439,000
5
bds
|
3
ba
|
2,396
sqft
|
built
2022
4792 Vellacito Way, Davenport, FL 33897
$-1,064
Cash flow
-12.6%
Cash-on-Cash Return
3.2%
Cap rate
0.6%
Rent to Value Ratio
Active
$408,000
4
bds
|
3
ba
|
1,844
sqft
|
built
2006
147 Bridgewater Dr, Davenport, FL 33897
$-723
Cash flow
-9.2%
Cash-on-Cash Return
4.0%
Cap rate
0.7%
Rent to Value Ratio
Active
$283,700
3
bds
|
2
ba
|
1,893
sqft
|
built
2006
1288 Grady Ln, Davenport, FL 33896
$-827
Cash flow
-15.2%
Cash-on-Cash Return
2.6%
Cap rate
0.7%
Rent to Value Ratio
Active
$745,000
8
bds
|
5
ba
|
3,916
sqft
|
built
2019
303 Ocean Course Ave, Davenport, FL 33896
$-2,418
Cash flow
-16.9%
Cash-on-Cash Return
2.3%
Cap rate
0.6%
Rent to Value Ratio

Active
$355,000
4
bds
|
3
ba
|
1,817
sqft
|
built
1955
200 North Blvd W, Davenport, FL 33837
$-504
Cash flow
-7.4%
Cash-on-Cash Return
4.4%
Cap rate
0.6%
Rent to Value Ratio
Active
$495,000
4
bds
|
3
ba
|
2,214
sqft
|
built
2018
274 Brunswick Dr, Davenport, FL 33837
$-1,037
Cash flow
-10.9%
Cash-on-Cash Return
3.6%
Cap rate
0.6%
Rent to Value Ratio
Active
$413,000
3
bds
|
2
ba
|
1,771
sqft
|
built
2018
193 Captiva Dr, Davenport, FL 33896
$-1,252
Cash flow
-15.8%
Cash-on-Cash Return
2.5%
Cap rate
0.6%
Rent to Value Ratio
Active
$420,000
4
bds
|
3
ba
|
2,550
sqft
|
built
2005
253 Aldridge Ln, Davenport, FL 33897
$-634
Cash flow
-7.9%
Cash-on-Cash Return
4.3%
Cap rate
0.7%
Rent to Value Ratio
Active
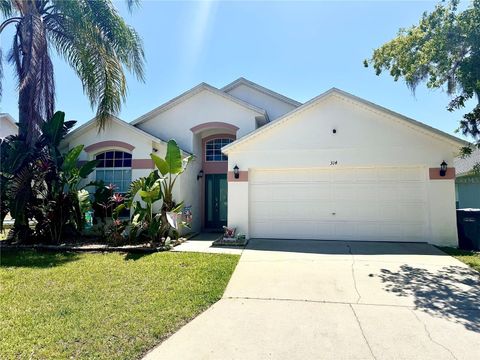
$374,900
4
bds
|
3
ba
|
1,627
sqft
|
built
2003
314 Saddle Ridge Dr, Davenport, FL 33896
$-614
Cash flow
-8.5%
Cash-on-Cash Return
4.2%
Cap rate
0.7%
Rent to Value Ratio
Active
$469,950
7
bds
|
5
ba
|
2,771
sqft
|
built
2006
209 Rosso Dr, Davenport, FL 33837
$-961
Cash flow
-10.7%
Cash-on-Cash Return
3.7%
Cap rate
0.7%
Rent to Value Ratio
Active
$599,999
6
bds
|
5
ba
|
3,000
sqft
|
built
2020
555 Meadow Bend Dr, Davenport, FL 33837
$-1,533
Cash flow
-13.3%
Cash-on-Cash Return
3.1%
Cap rate
0.5%
Rent to Value Ratio
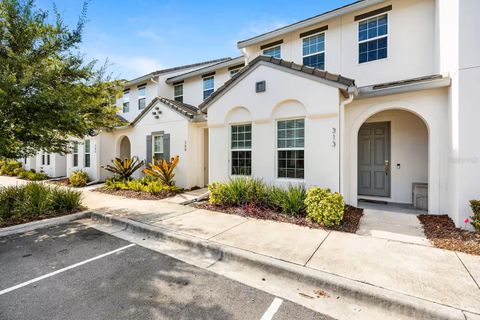
Active
$425,000
4
bds
|
4
ba
|
1,960
sqft
|
built
2016
313 Captiva Dr, Davenport, FL 33896
$-1,202
Cash flow
-14.8%
Cash-on-Cash Return
2.8%
Cap rate
0.7%
Rent to Value Ratio
Active
$524,000
4
bds
|
3
ba
|
2,471
sqft
|
built
2000
242 Prestwick Dr, Davenport, FL 33897
$-1,038
Cash flow
-10.3%
Cash-on-Cash Return
3.8%
Cap rate
0.6%
Rent to Value Ratio
Active
$219,950
2
bds
|
2
ba
|
1,134
sqft
|
built
2007
1375 Tuscana Ln, Davenport, FL 33896
$-813
Cash flow
-19.3%
Cash-on-Cash Return
1.7%
Cap rate
0.8%
Rent to Value Ratio