Farmington, UT Investment Properties for Sale
Browse homes for sale and investment properties in Farmington, UT. Refine your search by price, property type, or more.
Best cash flowing properties in Farmington, UT
Active
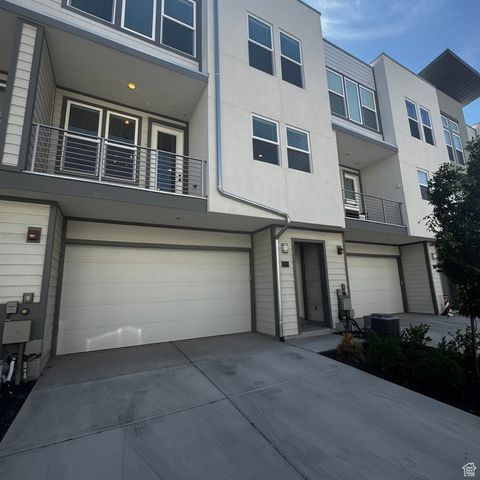
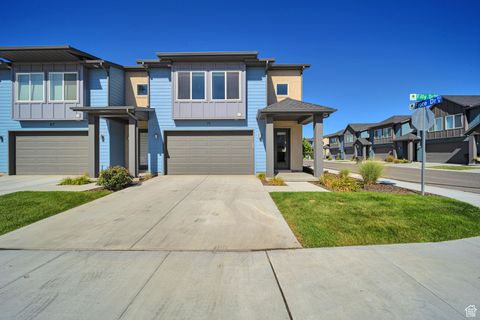
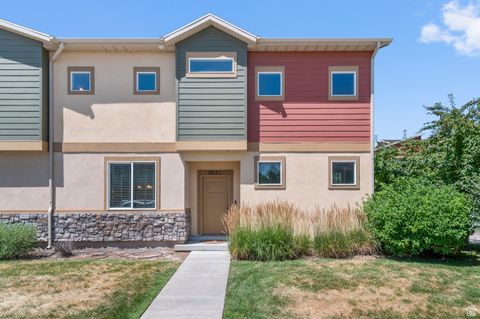
$399,999
2
bds
|
3
ba
|
1,370
sqft
|
built
2023
597 N Nichole Ln, Farmington, UT 84025
$-406
Cash flow
-5.3%
Cash-on-Cash Return
4.5%
Cap rate
0.6%
Rent to Value Ratio

Active
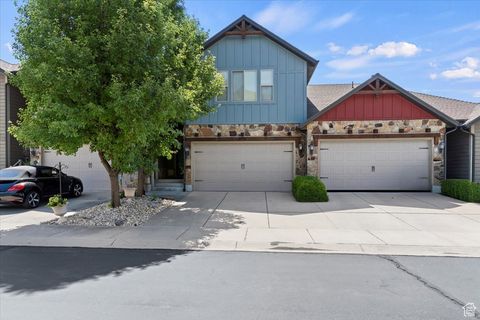
$399,999
2
bds
|
3
ba
|
1,370
sqft
|
built
2023
597 N Nichole Ln, Farmington, UT 84025
$-674
Cash flow
-8.8%
Cash-on-Cash Return
3.7%
Cap rate
0.6%
Rent to Value Ratio
46 out of 51 properties for sale in Farmington, UT
Limited Results Shown
Create a free account, or log in to reveal all property listings and enjoy the complete experience.
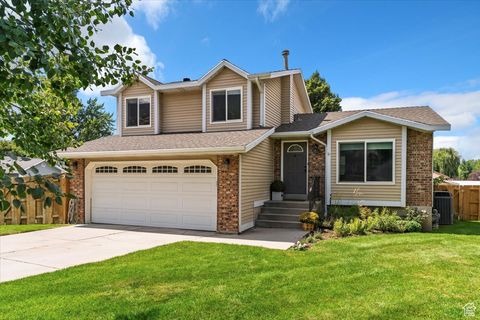
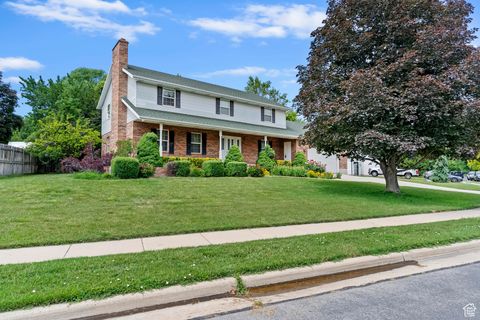
Active
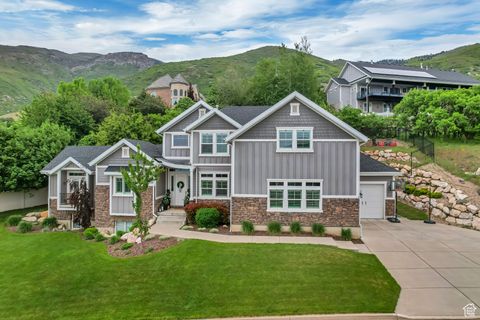
$550,000
4
bds
|
2
ba
|
1,901
sqft
|
built
1985
888 Rice Cir, Farmington, UT 84025
$-895
Cash flow
-8.5%
Cash-on-Cash Return
3.7%
Cap rate
0.5%
Rent to Value Ratio
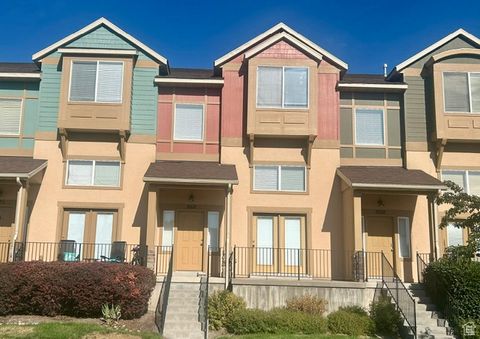
Active
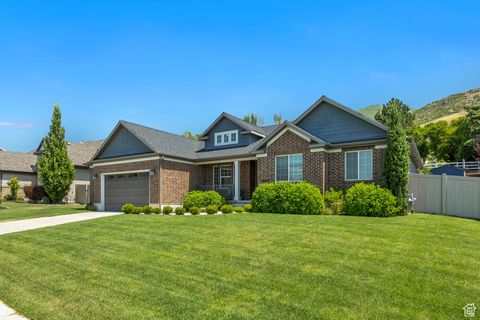
$399,900
2
bds
|
3
ba
|
1,498
sqft
|
built
2005
868 N Shepard Creek Pkwy, Farmington, UT 84025
$-914
Cash flow
-11.9%
Cash-on-Cash Return
2.9%
Cap rate
0.5%
Rent to Value Ratio
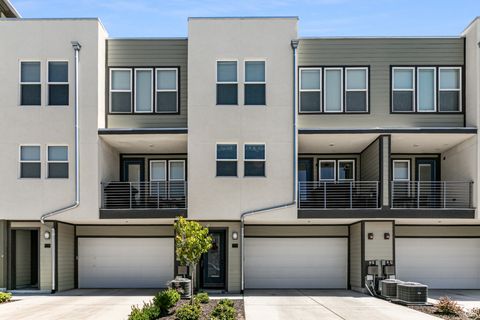
Active
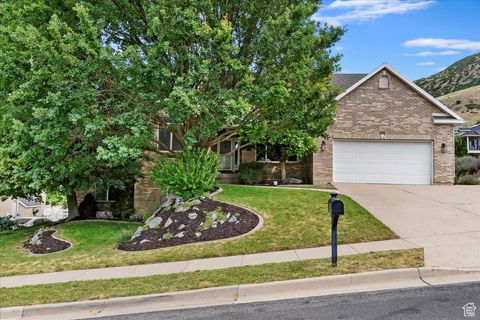
$420,000
2
bds
|
3
ba
|
1,342
sqft
|
built
2024
604 N Sego Way, Farmington, UT 84025
$-694
Cash flow
-8.6%
Cash-on-Cash Return
3.7%
Cap rate
0.5%
Rent to Value Ratio
Active
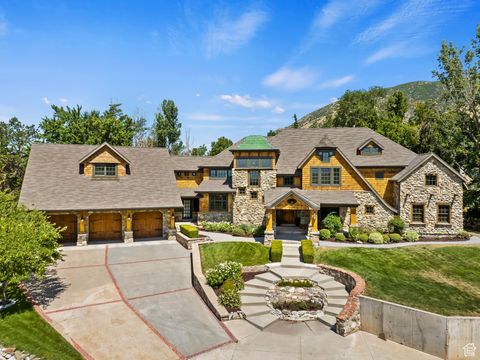
$1,300,000
4
bds
|
4
ba
|
5,145
sqft
|
built
2011
69 W Grove Creek Ln, Farmington, UT 84025
$-4,743
Cash flow
-19.0%
Cash-on-Cash Return
1.3%
Cap rate
0.2%
Rent to Value Ratio
Active
$1,199,000
6
bds
|
4
ba
|
4,874
sqft
|
built
2007
681 Country Ln, Farmington, UT 84025
$-4,066
Cash flow
-17.7%
Cash-on-Cash Return
1.6%
Cap rate
0.2%
Rent to Value Ratio
Active
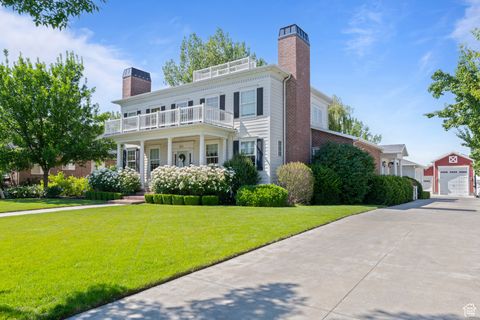
$674,900
4
bds
|
2
ba
|
3,016
sqft
|
built
1949
38 S 300 W, Farmington, UT 84025
$-1,312
Cash flow
-10.1%
Cash-on-Cash Return
3.3%
Cap rate
0.5%
Rent to Value Ratio
Active
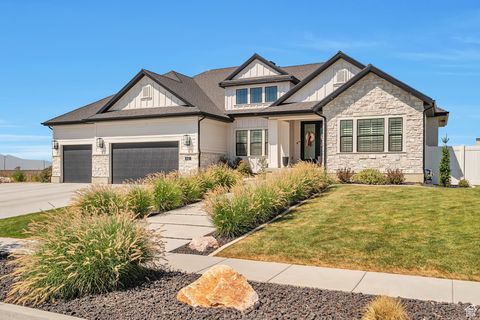
$750,000
4
bds
|
3
ba
|
3,097
sqft
|
built
2004
1663 Farm Meadow Rd, Farmington, UT 84025
$-1,651
Cash flow
-11.5%
Cash-on-Cash Return
3.0%
Cap rate
0.4%
Rent to Value Ratio
Active
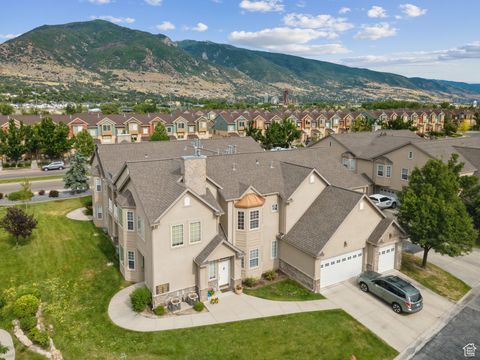
$554,900
3
bds
|
3
ba
|
1,916
sqft
|
built
2022
71 N Filly Dr, Farmington, UT 84025
$-1,392
Cash flow
-13.1%
Cash-on-Cash Return
2.7%
Cap rate
0.4%
Rent to Value Ratio
Active
$2,500,000
7
bds
|
7
ba
|
10,758
sqft
|
built
2006
139 E 400 N, Farmington, UT 84025
$-10,276
Cash flow
-21.4%
Cash-on-Cash Return
0.7%
Cap rate
0.1%
Rent to Value Ratio
Active
$1,490,000
5
bds
|
5
ba
|
5,601
sqft
|
built
2022
642 S Bareback Way, Farmington, UT 84025
$-3,307
Cash flow
-11.6%
Cash-on-Cash Return
3.0%
Cap rate
0.4%
Rent to Value Ratio
Active
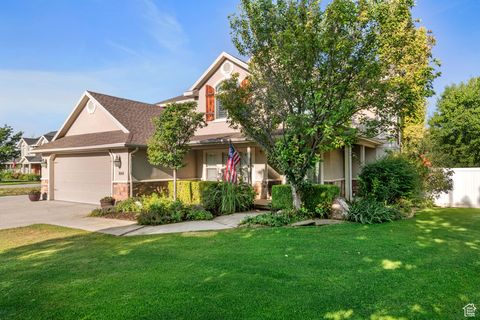
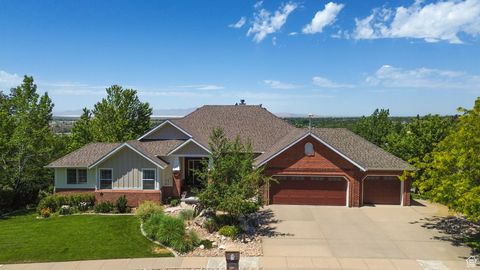
$735,000
4
bds
|
3
ba
|
2,558
sqft
|
built
2004
1844 Country Bend Cir, Farmington, UT 84025
$-1,321
Cash flow
-9.4%
Cash-on-Cash Return
3.5%
Cap rate
0.5%
Rent to Value Ratio
Active
$1,299,000
6
bds
|
4
ba
|
4,208
sqft
|
built
2014
588 W 1175 N, Farmington, UT 84025
$-4,304
Cash flow
-17.3%
Cash-on-Cash Return
1.7%
Cap rate
0.2%
Rent to Value Ratio
Active
$595,000
4
bds
|
4
ba
|
2,653
sqft
|
built
2012
800 S Rice Rd, Farmington, UT 84025
$-1,329
Cash flow
-11.7%
Cash-on-Cash Return
3.0%
Cap rate
0.5%
Rent to Value Ratio
Active
$1,350,000
5
bds
|
4
ba
|
5,065
sqft
|
built
2012
789 Eliza Ct, Farmington, UT 84025
$-4,070
Cash flow
-15.7%
Cash-on-Cash Return
2.1%
Cap rate
0.3%
Rent to Value Ratio
Active
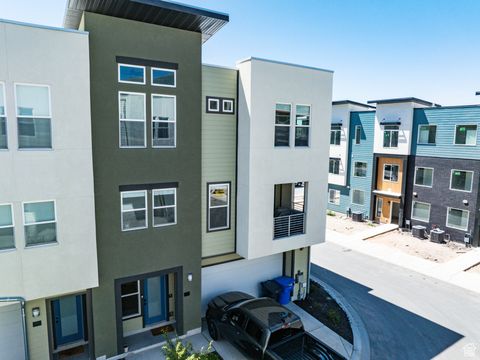
$494,000
3
bds
|
3
ba
|
1,870
sqft
|
built
2024
604 N Sego Way, Farmington, UT 84025
$-1,128
Cash flow
-11.9%
Cash-on-Cash Return
2.9%
Cap rate
0.4%
Rent to Value Ratio
Active
$405,000
3
bds
|
3
ba
|
1,540
sqft
|
built
2012
1012 W Willow Wind Dr, Farmington, UT 84025
$-1,014
Cash flow
-13.1%
Cash-on-Cash Return
2.7%
Cap rate
0.5%
Rent to Value Ratio
Active
$1,299,000
8
bds
|
6
ba
|
5,623
sqft
|
built
2014
467 Island View Cir, Farmington, UT 84025
$-2,232
Cash flow
-9.0%
Cash-on-Cash Return
3.6%
Cap rate
0.5%
Rent to Value Ratio
Active
$1,150,000
5
bds
|
4
ba
|
4,000
sqft
|
built
2019
1668 N 400 W, Farmington, UT 84025
$-3,934
Cash flow
-17.8%
Cash-on-Cash Return
1.6%
Cap rate
0.2%
Rent to Value Ratio
Active
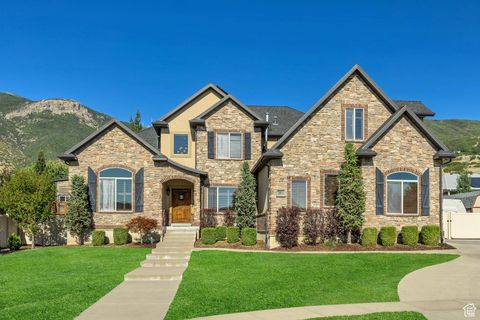
$874,900
6
bds
|
3
ba
|
4,560
sqft
|
built
1995
154 W 1100 N, Farmington, UT 84025
$-2,549
Cash flow
-15.2%
Cash-on-Cash Return
2.2%
Cap rate
0.3%
Rent to Value Ratio
Active
$709,900
3
bds
|
2
ba
|
2,063
sqft
|
built
2007
191 Ranch Rd, Farmington, UT 84025
$-1,961
Cash flow
-14.4%
Cash-on-Cash Return
2.4%
Cap rate
0.4%
Rent to Value Ratio
Active
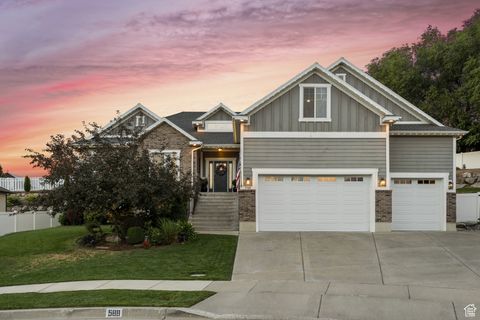
$511,999
3
bds
|
3
ba
|
2,023
sqft
|
built
2017
75 N Rio Grand Ave, Farmington, UT 84025
$-1,132
Cash flow
-11.5%
Cash-on-Cash Return
3.0%
Cap rate
0.5%
Rent to Value Ratio
Active
$730,000
6
bds
|
3
ba
|
4,017
sqft
|
built
1980
958 N Main St, Farmington, UT 84025
$-1,539
Cash flow
-11.0%
Cash-on-Cash Return
3.1%
Cap rate
0.4%
Rent to Value Ratio
Active
$1,159,000
4
bds
|
3
ba
|
4,197
sqft
|
built
2018
721 W Glovers Ln, Farmington, UT 84025
$-3,518
Cash flow
-15.8%
Cash-on-Cash Return
2.0%
Cap rate
0.3%
Rent to Value Ratio
Active
$1,999,995
6
bds
|
5
ba
|
5,828
sqft
|
built
2013
1254 W 475 S, Farmington, UT 84025
$-7,291
Cash flow
-19.0%
Cash-on-Cash Return
1.3%
Cap rate
0.2%
Rent to Value Ratio
Active
$359,000
2
bds
|
2
ba
|
1,188
sqft
|
built
2000
942 Shetland Ln, Farmington, UT 84025
$-845
Cash flow
-12.3%
Cash-on-Cash Return
2.9%
Cap rate
0.5%
Rent to Value Ratio
Active
$1,200,000
4
bds
|
3
ba
|
5,414
sqft
|
built
1997
1269 Alice Ln, Farmington, UT 84025
$-4,131
Cash flow
-18.0%
Cash-on-Cash Return
1.5%
Cap rate
0.2%
Rent to Value Ratio
Active
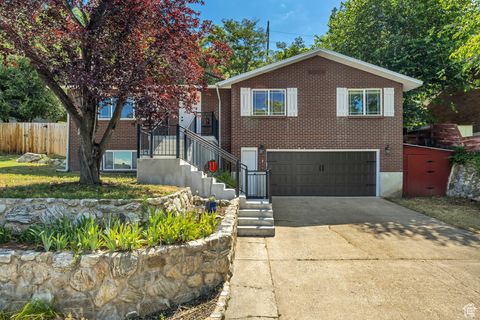
$573,900
3
bds
|
2
ba
|
2,199
sqft
|
built
1974
26 N 325 E, Farmington, UT 84025
$-1,164
Cash flow
-10.6%
Cash-on-Cash Return
3.2%
Cap rate
0.5%
Rent to Value Ratio
Active
$749,900
6
bds
|
4
ba
|
4,050
sqft
|
built
1978
1356 Fairway Cir, Farmington, UT 84025
$-1,145
Cash flow
-8.0%
Cash-on-Cash Return
3.8%
Cap rate
0.5%
Rent to Value Ratio
Active
$1,125,000
5
bds
|
4
ba
|
4,308
sqft
|
built
2011
514 Rigby Rd, Farmington, UT 84025
$-2,785
Cash flow
-12.9%
Cash-on-Cash Return
2.7%
Cap rate
0.4%
Rent to Value Ratio
Active
$599,800
4
bds
|
3
ba
|
2,174
sqft
|
built
1895
79 S 300 E, Farmington, UT 84025
$-1,406
Cash flow
-12.2%
Cash-on-Cash Return
2.9%
Cap rate
0.4%
Rent to Value Ratio
Active
$878,000
6
bds
|
5
ba
|
3,780
sqft
|
built
2023
849 N Evelyn St, Farmington, UT 84025
$-2,421
Cash flow
-14.4%
Cash-on-Cash Return
2.4%
Cap rate
0.4%
Rent to Value Ratio
Active
$669,900
6
bds
|
4
ba
|
3,177
sqft
|
built
1977
1789 N Stayner Dr, Farmington, UT 84025
$-1,435
Cash flow
-11.2%
Cash-on-Cash Return
3.1%
Cap rate
0.4%
Rent to Value Ratio
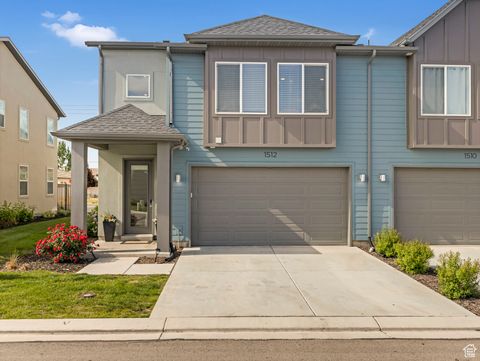
Active
$554,000
3
bds
|
3
ba
|
1,916
sqft
|
built
2022
1512 W Fiore Dr, Farmington, UT 84025
$-1,388
Cash flow
-13.1%
Cash-on-Cash Return
2.7%
Cap rate
0.4%
Rent to Value Ratio
Active
$391,800
3
bds
|
2
ba
|
1,454
sqft
|
built
1980
22 W 1470 S, Farmington, UT 84025
$-841
Cash flow
-11.2%
Cash-on-Cash Return
3.1%
Cap rate
0.4%
Rent to Value Ratio

Active
$1,900,000
6
bds
|
5
ba
|
6,459
sqft
|
built
2014
1309 W Atrium Ct, Farmington, UT 84025
$-5,738
Cash flow
-15.8%
Cash-on-Cash Return
2.1%
Cap rate
0.3%
Rent to Value Ratio

Active
$670,000
4
bds
|
3
ba
|
2,472
sqft
|
built
2009
1396 Churchill Downs, Farmington, UT 84025
$-1,543
Cash flow
-12.0%
Cash-on-Cash Return
2.9%
Cap rate
0.4%
Rent to Value Ratio
Active
$1,449,000
6
bds
|
6
ba
|
6,096
sqft
|
built
2012
916 Country Ln, Farmington, UT 84025
$-5,180
Cash flow
-18.7%
Cash-on-Cash Return
1.4%
Cap rate
0.2%
Rent to Value Ratio
Active
$1,399,000
6
bds
|
4
ba
|
4,817
sqft
|
built
1993
2076 Summerwood Dr, Farmington, UT 84025
$-4,020
Cash flow
-15.0%
Cash-on-Cash Return
2.2%
Cap rate
0.3%
Rent to Value Ratio