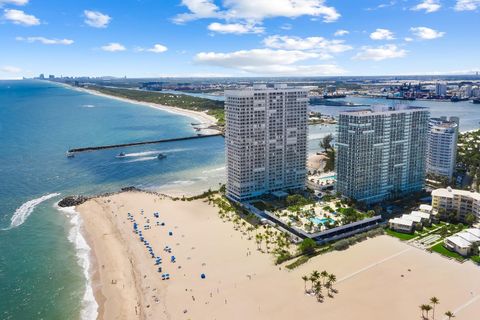
Broward County Investment Properties for Sale
Browse homes for sale and investment properties in Broward County. Refine your search by price, property type, or more.
Best cash flowing properties in Broward County
Active
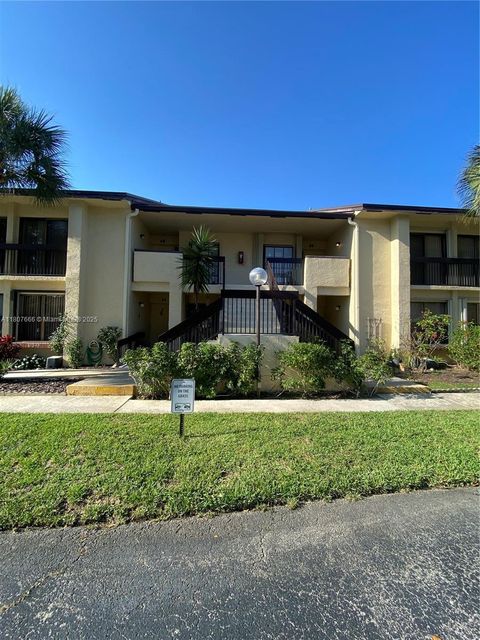
$185,000
1
bds
|
1
ba
|
956
sqft
|
built
1965
2555 NE 11th St, Fort Lauderdale, FL 33304
$37
Cash flow
1.0%
Cash-on-Cash Return
6.4%
Cap rate
1.1%
Rent to Value Ratio
Active
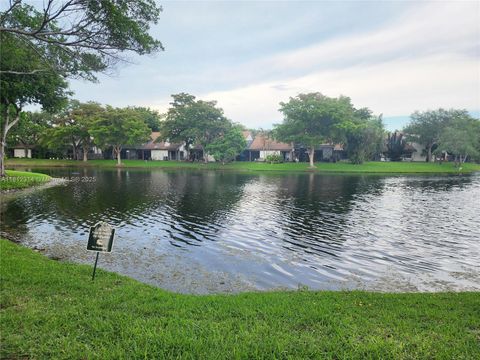
$159,998
1
bds
|
1
ba
|
672
sqft
|
built
1964
3600 Jackson St, Hollywood, FL 33021
$-50
Cash flow
-1.6%
Cash-on-Cash Return
5.8%
Cap rate
1.1%
Rent to Value Ratio
7,582 out of 8,882 properties for sale in Broward County
Limited Results Shown
Create a free account, or log in to reveal all property listings and enjoy the complete experience.
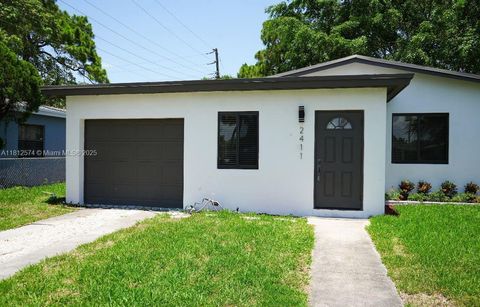
Active
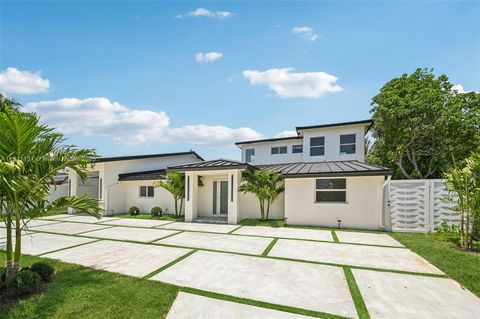
$429,900
4
bds
|
2
ba
|
955
sqft
|
built
1960
2411 NW 9th St, Fort Lauderdale, FL 33311
$-861
Cash flow
-10.4%
Cash-on-Cash Return
3.7%
Cap rate
0.5%
Rent to Value Ratio
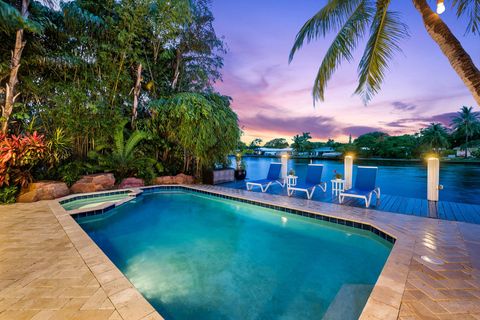
Active
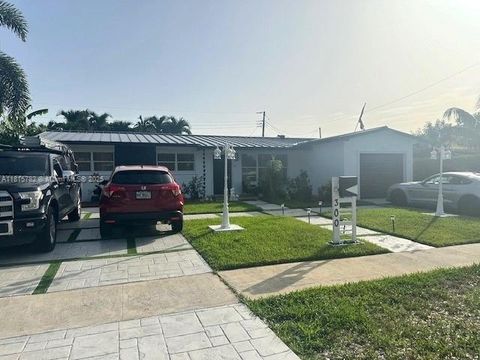
$1,045,000
2
bds
|
2
ba
|
1,189
sqft
|
built
1954
2807 Coral Shores Dr, Fort Lauderdale, FL 33306
$-2,489
Cash flow
-12.4%
Cash-on-Cash Return
3.3%
Cap rate
0.6%
Rent to Value Ratio
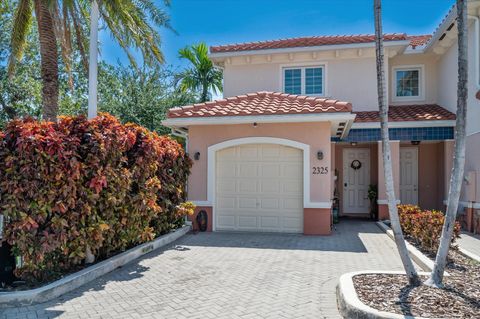
Active
$559,000
3
bds
|
3
ba
|
1,553
sqft
|
built
2014
2325 SE 5th St, Pompano Beach, FL 33062
$-1,411
Cash flow
-13.2%
Cash-on-Cash Return
3.1%
Cap rate
0.6%
Rent to Value Ratio
Active
$529,900
3
bds
|
2
ba
|
1,122
sqft
|
built
1954
1530 NW 18th Ct, Fort Lauderdale, FL 33311
$-986
Cash flow
-9.7%
Cash-on-Cash Return
3.9%
Cap rate
0.6%
Rent to Value Ratio
Active
$885,000
3
bds
|
2
ba
|
1,728
sqft
|
built
1964
1561 SE 24th Ter, Pompano Beach, FL 33062
$-1,465
Cash flow
-8.6%
Cash-on-Cash Return
4.2%
Cap rate
0.7%
Rent to Value Ratio
Active
$408,000
3
bds
|
2
ba
|
1,140
sqft
|
built
1960
2559 NW 62nd Ter, Margate, FL 33063
$-779
Cash flow
-10.0%
Cash-on-Cash Return
3.9%
Cap rate
0.7%
Rent to Value Ratio
Active
$1,299,000
3
bds
|
3
ba
|
2,030
sqft
|
built
1967
4300 N Ocean Blvd, Fort Lauderdale, FL 33308
$-4,275
Cash flow
-17.2%
Cash-on-Cash Return
2.2%
Cap rate
0.7%
Rent to Value Ratio
Active
$565,000
3
bds
|
2
ba
|
1,364
sqft
|
built
1975
12351 NW 29th Mnr, Sunrise, FL 33323
$-868
Cash flow
-8.0%
Cash-on-Cash Return
4.3%
Cap rate
0.7%
Rent to Value Ratio
Active
$765,000
4
bds
|
3
ba
|
2,555
sqft
|
built
1984
11217 NW 10th Mnr, Coral Springs, FL 33071
$-1,787
Cash flow
-12.2%
Cash-on-Cash Return
3.3%
Cap rate
0.5%
Rent to Value Ratio
Active
$698,000
3
bds
|
2
ba
|
1,525
sqft
|
built
1984
5071 SW 120th Ave, Cooper City, FL 33330
$-1,427
Cash flow
-10.7%
Cash-on-Cash Return
3.7%
Cap rate
0.5%
Rent to Value Ratio
Active
$625,000
4
bds
|
3
ba
|
2,172
sqft
|
built
2007
9741 Darlington Pl, Cooper City, FL 33328
$-1,655
Cash flow
-13.8%
Cash-on-Cash Return
3.0%
Cap rate
0.6%
Rent to Value Ratio
Active
$299,000
1
bds
|
2
ba
|
1,103
sqft
|
built
1971
2200 NE 33rd Ave, Fort Lauderdale, FL 33305
$-944
Cash flow
-16.5%
Cash-on-Cash Return
2.4%
Cap rate
0.8%
Rent to Value Ratio
Active
$340,000
2
bds
|
2
ba
|
1,358
sqft
|
built
1971
7019 NW 63rd St, Tamarac, FL 33321
$-629
Cash flow
-9.7%
Cash-on-Cash Return
3.9%
Cap rate
0.8%
Rent to Value Ratio

Active
$259,000
2
bds
|
2
ba
|
1,070
sqft
|
built
1994
4161 Coral Tree Cir, Coconut Creek, FL 33073
$-914
Cash flow
-18.4%
Cash-on-Cash Return
1.9%
Cap rate
0.9%
Rent to Value Ratio
Active
$1,950,000
6
bds
|
5
ba
|
4,707
sqft
|
built
2007
8146 Emerald Ave, Parkland, FL 33076
$-5,414
Cash flow
-14.5%
Cash-on-Cash Return
2.8%
Cap rate
0.5%
Rent to Value Ratio
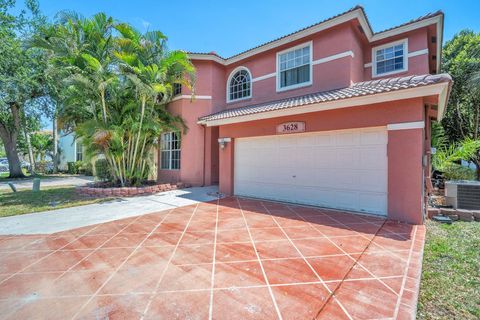
Active
$659,000
4
bds
|
3
ba
|
2,683
sqft
|
built
1999
3628 Dunes Vista Dr, Pompano Beach, FL 33069
$-1,699
Cash flow
-13.5%
Cash-on-Cash Return
3.1%
Cap rate
0.6%
Rent to Value Ratio

Active
$345,000
2
bds
|
3
ba
|
1,067
sqft
|
built
2006
4913 SW 141st Ave, Miramar, FL 33027
$-1,171
Cash flow
-17.7%
Cash-on-Cash Return
2.1%
Cap rate
0.7%
Rent to Value Ratio
Active
$254,000
3
bds
|
2
ba
|
1,100
sqft
|
built
1974
9423 NW 65th St, Tamarac, FL 33321
$-833
Cash flow
-17.1%
Cash-on-Cash Return
2.2%
Cap rate
0.9%
Rent to Value Ratio
Active
$255,000
2
bds
|
2
ba
|
1,064
sqft
|
built
1973
3091 N Course Dr, Pompano Beach, FL 33069
$-769
Cash flow
-15.7%
Cash-on-Cash Return
2.5%
Cap rate
0.9%
Rent to Value Ratio
Active
$235,000
2
bds
|
2
ba
|
1,000
sqft
|
built
1972
807 W Oakland Park Blvd, Wilton Manors, FL 33311
$-813
Cash flow
-18.0%
Cash-on-Cash Return
2.0%
Cap rate
0.9%
Rent to Value Ratio

Active
$325,000
3
bds
|
3
ba
|
1,300
sqft
|
built
1996
12154 Saint Andrews Pl, Miramar, FL 33025
$-1,118
Cash flow
-17.9%
Cash-on-Cash Return
2.0%
Cap rate
0.8%
Rent to Value Ratio
Active
$925,000
2
bds
|
2
ba
|
1,200
sqft
|
built
1969
2200 S Ocean Ln, Fort Lauderdale, FL 33316
$-3,558
Cash flow
-20.1%
Cash-on-Cash Return
1.5%
Cap rate
0.6%
Rent to Value Ratio
Active
$473,000
3
bds
|
2
ba
|
1,553
sqft
|
built
1956
3600 SW 2nd St, Fort Lauderdale, FL 33312
$-968
Cash flow
-10.7%
Cash-on-Cash Return
3.7%
Cap rate
0.6%
Rent to Value Ratio
Active
$239,000
2
bds
|
2
ba
|
949
sqft
|
built
1975
7900 Colony Cir S, Tamarac, FL 33321
$-698
Cash flow
-15.2%
Cash-on-Cash Return
2.6%
Cap rate
0.8%
Rent to Value Ratio

Active
$3,299,300
4
bds
|
5
ba
|
3,335
sqft
|
built
1979
2901 NE 46th St, Lighthouse Point, FL 33064
$-11,361
Cash flow
-18.0%
Cash-on-Cash Return
2.0%
Cap rate
0.3%
Rent to Value Ratio
Active
$375,000
3
bds
|
2
ba
|
1,120
sqft
|
built
1986
2850 Carambola Cir S, Coconut Creek, FL 33066
$-800
Cash flow
-11.1%
Cash-on-Cash Return
3.6%
Cap rate
0.7%
Rent to Value Ratio

Active
$679,900
3
bds
|
2
ba
|
1,662
sqft
|
built
2000
1020 Silktree Ln, Weston, FL 33327
$-1,355
Cash flow
-10.4%
Cash-on-Cash Return
3.8%
Cap rate
0.6%
Rent to Value Ratio
Active
$369,000
3
bds
|
2
ba
|
1,110
sqft
|
built
1997
761 N Pine Island Rd, Plantation, FL 33324
$-1,175
Cash flow
-16.6%
Cash-on-Cash Return
2.3%
Cap rate
0.7%
Rent to Value Ratio
Active
$205,000
2
bds
|
1
ba
|
903
sqft
|
built
1986
1247 SW 46th Ave, Pompano Beach, FL 33069
$-441
Cash flow
-11.2%
Cash-on-Cash Return
3.6%
Cap rate
1.0%
Rent to Value Ratio
Active
$4,750,000
6
bds
|
7
ba
|
5,431
sqft
|
built
1964
1601 Diplomat Pkwy, Hollywood, FL 33019
$-23,167
Cash flow
-25.4%
Cash-on-Cash Return
0.3%
Cap rate
0.2%
Rent to Value Ratio
Active
$415,000
4
bds
|
2
ba
|
1,080
sqft
|
built
1966
3175 NW 16th St, Lauderhill, FL 33311
$-934
Cash flow
-11.7%
Cash-on-Cash Return
3.4%
Cap rate
0.6%
Rent to Value Ratio
Active
$249,000
2
bds
|
2
ba
|
1,150
sqft
|
built
1981
1945 SW 15th St, Deerfield Beach, FL 33442
$-690
Cash flow
-14.5%
Cash-on-Cash Return
2.8%
Cap rate
0.9%
Rent to Value Ratio
Active
$239,900
2
bds
|
2
ba
|
964
sqft
|
built
1979
52 Wimbledon Lake Dr, Plantation, FL 33324
$-572
Cash flow
-12.4%
Cash-on-Cash Return
3.3%
Cap rate
0.8%
Rent to Value Ratio
Active
$1,950,000
5
bds
|
4
ba
|
2,985
sqft
|
built
1957
2001 SW 23rd Ave, Fort Lauderdale, FL 33312
$-6,782
Cash flow
-18.1%
Cash-on-Cash Return
2.0%
Cap rate
0.3%
Rent to Value Ratio
Active
$890,000
4
bds
|
2
ba
|
1,624
sqft
|
built
1966
300 NW 77th Way, Pembroke Pines, FL 33024
$-2,434
Cash flow
-14.3%
Cash-on-Cash Return
2.9%
Cap rate
0.5%
Rent to Value Ratio

Active
$6,995,000
6
bds
|
6
ba
|
5,526
sqft
|
built
2003
324 Coconut Isle Dr, Fort Lauderdale, FL 33301
$-34,488
Cash flow
-25.7%
Cash-on-Cash Return
0.2%
Cap rate
0.1%
Rent to Value Ratio
Active
$1,850,000
5
bds
|
4
ba
|
3,502
sqft
|
built
2004
15122 SW 34th St, Davie, FL 33331
$-5,431
Cash flow
-15.3%
Cash-on-Cash Return
2.6%
Cap rate
0.5%
Rent to Value Ratio
Active
$404,999
2
bds
|
3
ba
|
1,260
sqft
|
built
1985
10428 NW 3rd St, Pembroke Pines, FL 33026
$-931
Cash flow
-12.0%
Cash-on-Cash Return
3.4%
Cap rate
0.6%
Rent to Value Ratio